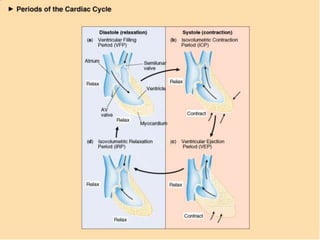
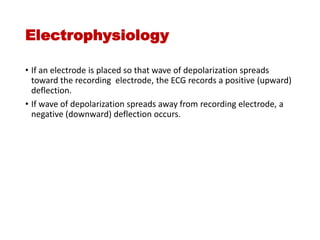
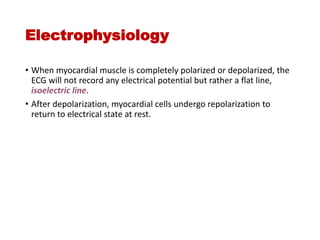
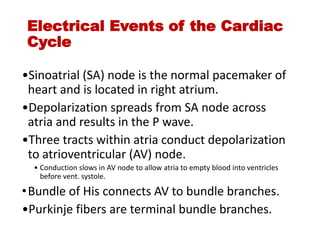
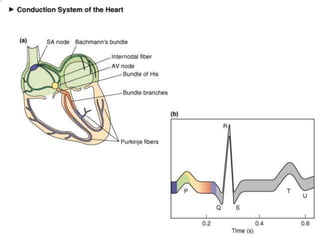
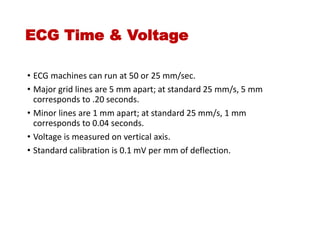
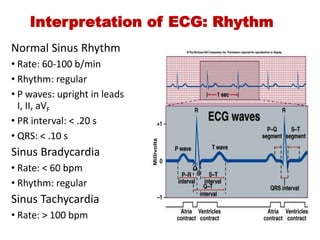
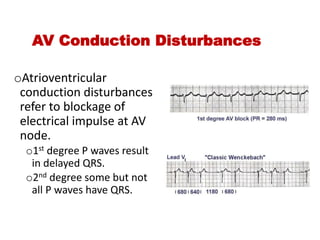
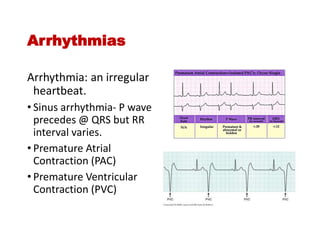
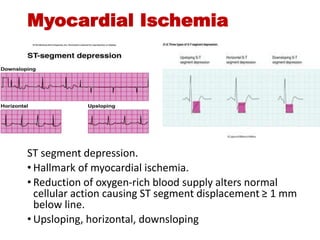
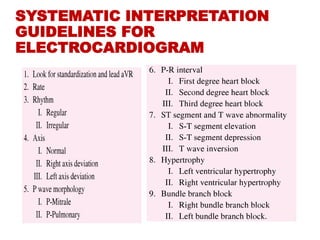
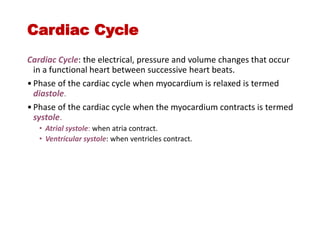
2. Cardiac Cycle
Cardiac Cycle: the electrical, pressure and volume changes that occur
in a functional heart between successive heart beats.
•Phase of the cardiac cycle when myocardium is relaxed is termed
diastole.
•Phase of the cardiac cycle when the myocardium contracts is termed
systole.
• Atrial systole: when atria contract.
• Ventricular systole: when ventricles contract.
3. Mechanical Events of the
Cardiac Cycle
1. Ventricular Filling Period [ventricular diastole,
atrial systole]
2. Isovolumetric Contraction Period [ventricular
systole]
3. Ventricular Ejection Period [ventricular
systole]
4. Isovolumetric Relaxation Period [ventricular
diastole, atrial diastole]
4.
5. Cardiac Cycle
• Electrical changes in heart tissue cause mechanical changes, i.e.
muscle contraction.
• Thus, changes in electrical membrane potential of specific parts of
the heart tissue represent mechanical events in specific areas of the
heart tissue.
6. Electrocardiography
• Two common abbreviations for electrocardiogram: EKG and ECG.
• EKG comes from German language where cardiogram is written as
kardiogram.
• The ECG records the electrical activity of the heart.
• Mechanical activity of the heart is sensed by echocardiography.
7. Electrocardiography
ECG - electrocardiogram
• graphic recording of electrical events
• established electrode pattern results in specific tracing pattern
• electrical pattern reveals blood supply problems
8. Electrophysiology
• If an electrode is placed so that wave of depolarization spreads
toward the recording electrode, the ECG records a positive (upward)
deflection.
• If wave of depolarization spreads away from recording electrode, a
negative (downward) deflection occurs.
12. Electrophysiology
• When myocardial muscle is completely polarized or depolarized, the
ECG will not record any electrical potential but rather a flat line,
isoelectric line.
• After depolarization, myocardial cells undergo repolarization to
return to electrical state at rest.
13. Electrical Events of the Cardiac
Cycle
•Sinoatrial (SA) node is the normal pacemaker of
heart and is located in right atrium.
•Depolarization spreads from SA node across
atria and results in the P wave.
•Three tracts within atria conduct depolarization
to atrioventricular (AV) node.
• Conduction slows in AV node to allow atria to empty blood into ventricles
before vent. systole.
•Bundle of His connects AV to bundle branches.
•Purkinje fibers are terminal bundle branches.
14.
15. ECG Time & Voltage
• ECG machines can run at 50 or 25 mm/sec.
• Major grid lines are 5 mm apart; at standard 25 mm/s, 5 mm
corresponds to .20 seconds.
• Minor lines are 1 mm apart; at standard 25 mm/s, 1 mm
corresponds to 0.04 seconds.
• Voltage is measured on vertical axis.
• Standard calibration is 0.1 mV per mm of deflection.
16.
17. Electrocardiogram
•Normal P wave has
amplitude of ≤ 0.25 mV
•Q wave is first downward
deflection after P wave;
signals start of ventricular
depolarization
•R wave is positive
deflection after Q wave
•S wave is negative
deflection preceded by Q
or R waves
•T wave follows QRS
23. 12-Lead ECG
•Limb lead II shows large R
amplitude because left
ventricle current vector
lies parallel with electrode
placement.
•Chest lead V1 has large S
wave because left ventricle
current vector is directed
away from electrode.
24. Interpretation of ECG:
Rate
First measurement to calculate is heart rate. PQRST waves represent one
complete cardiac cycle.
1. At standard paper speed, divide 1500 by distance between R to R
waves.
2. Find R wave on heavy line. Count off 300, 150, 100, 75, 60 for each
following line. Where next R lands is quick estimate.
3. Multiply number of cycles in 6 second marks by 10.