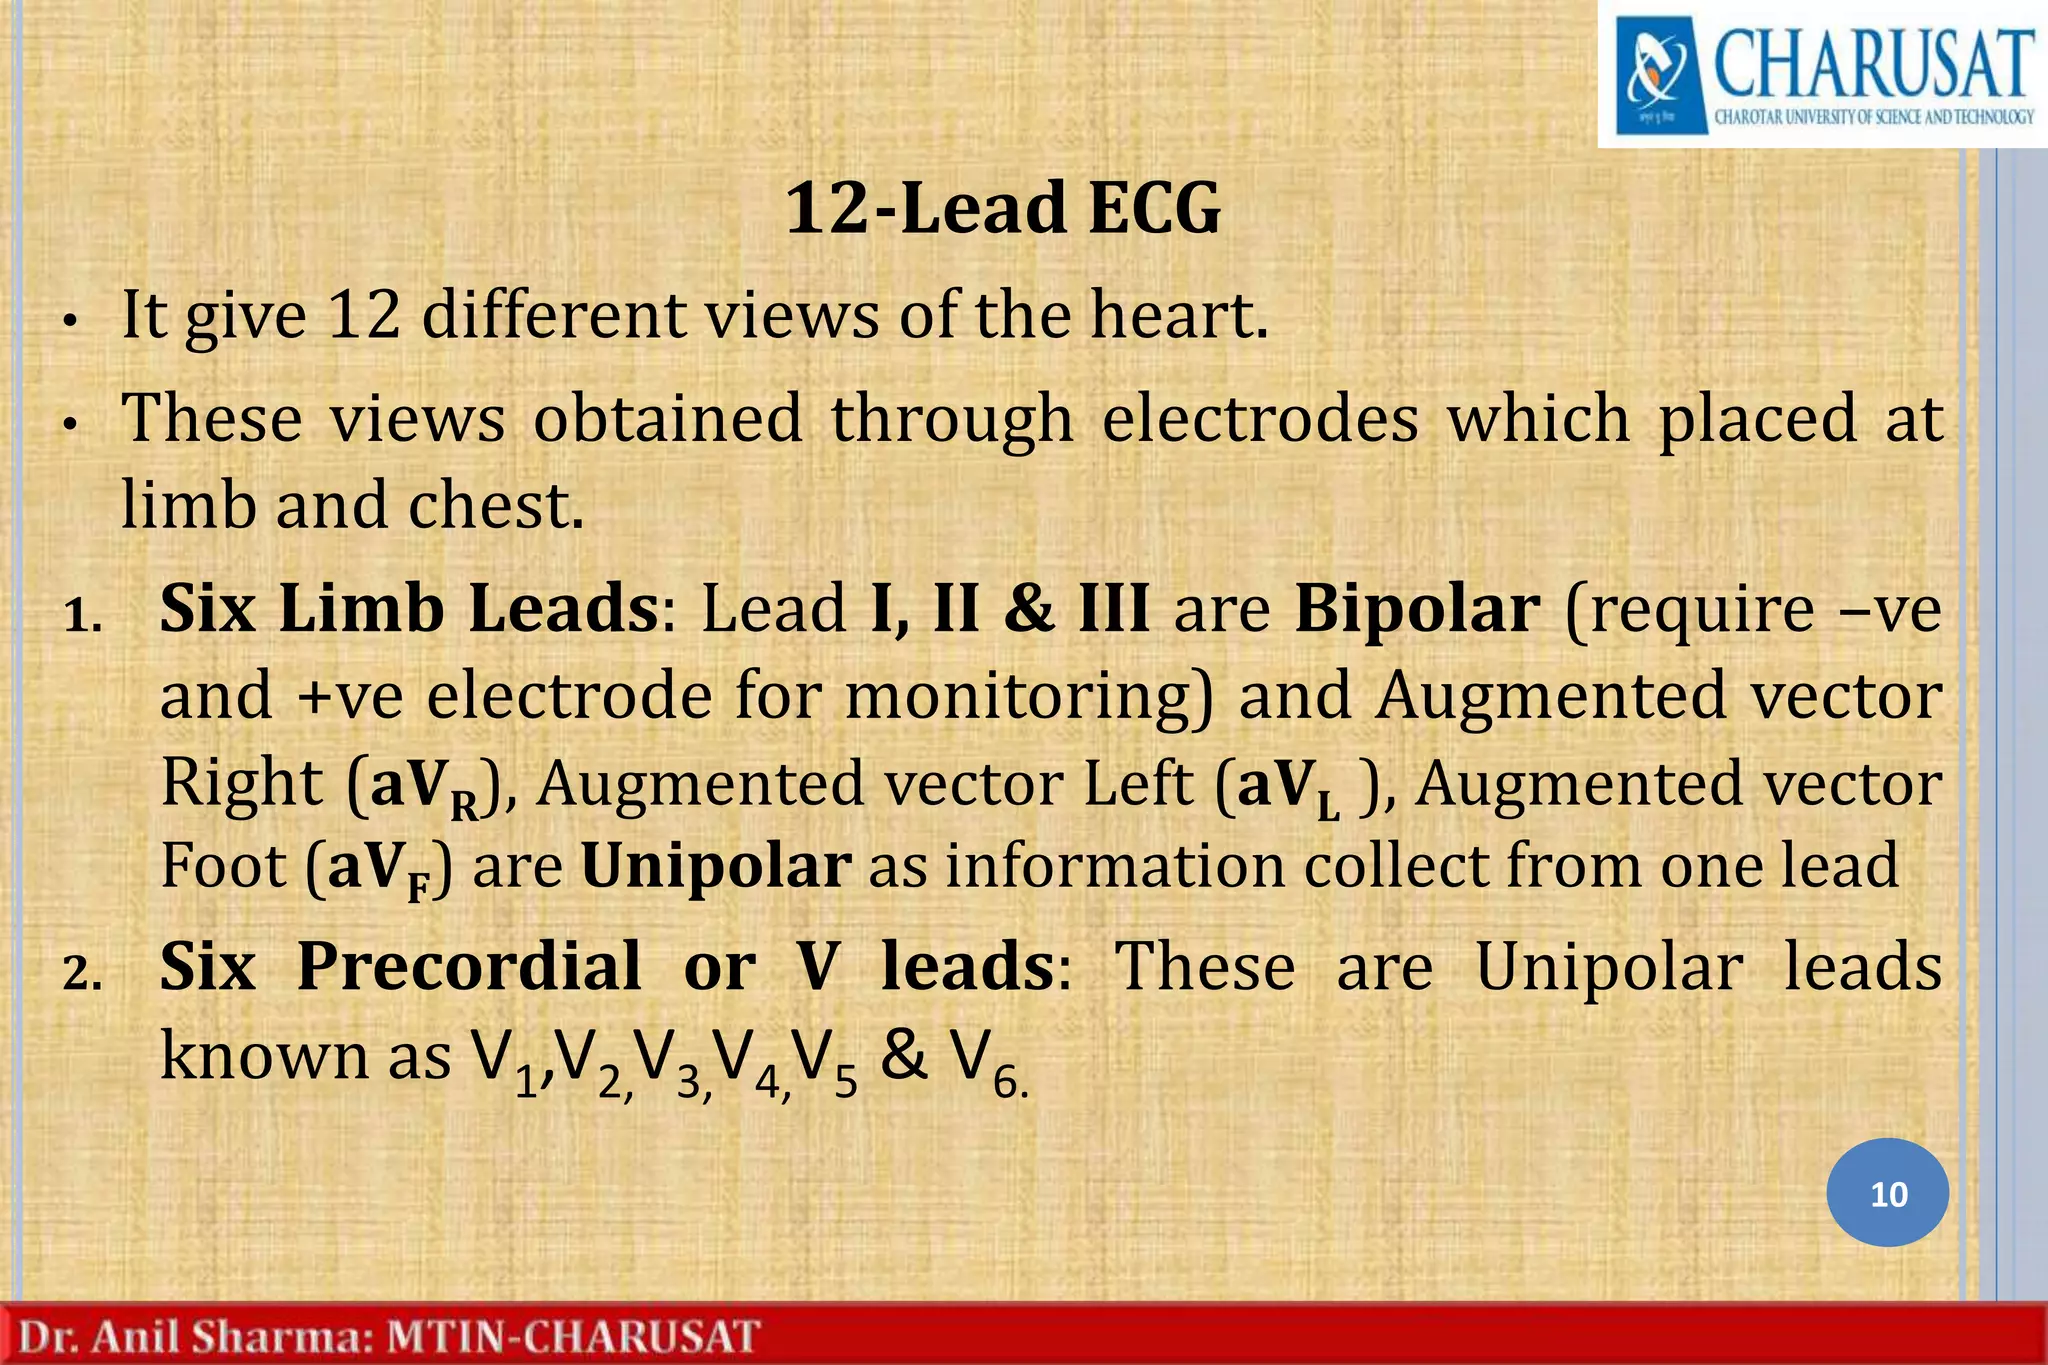
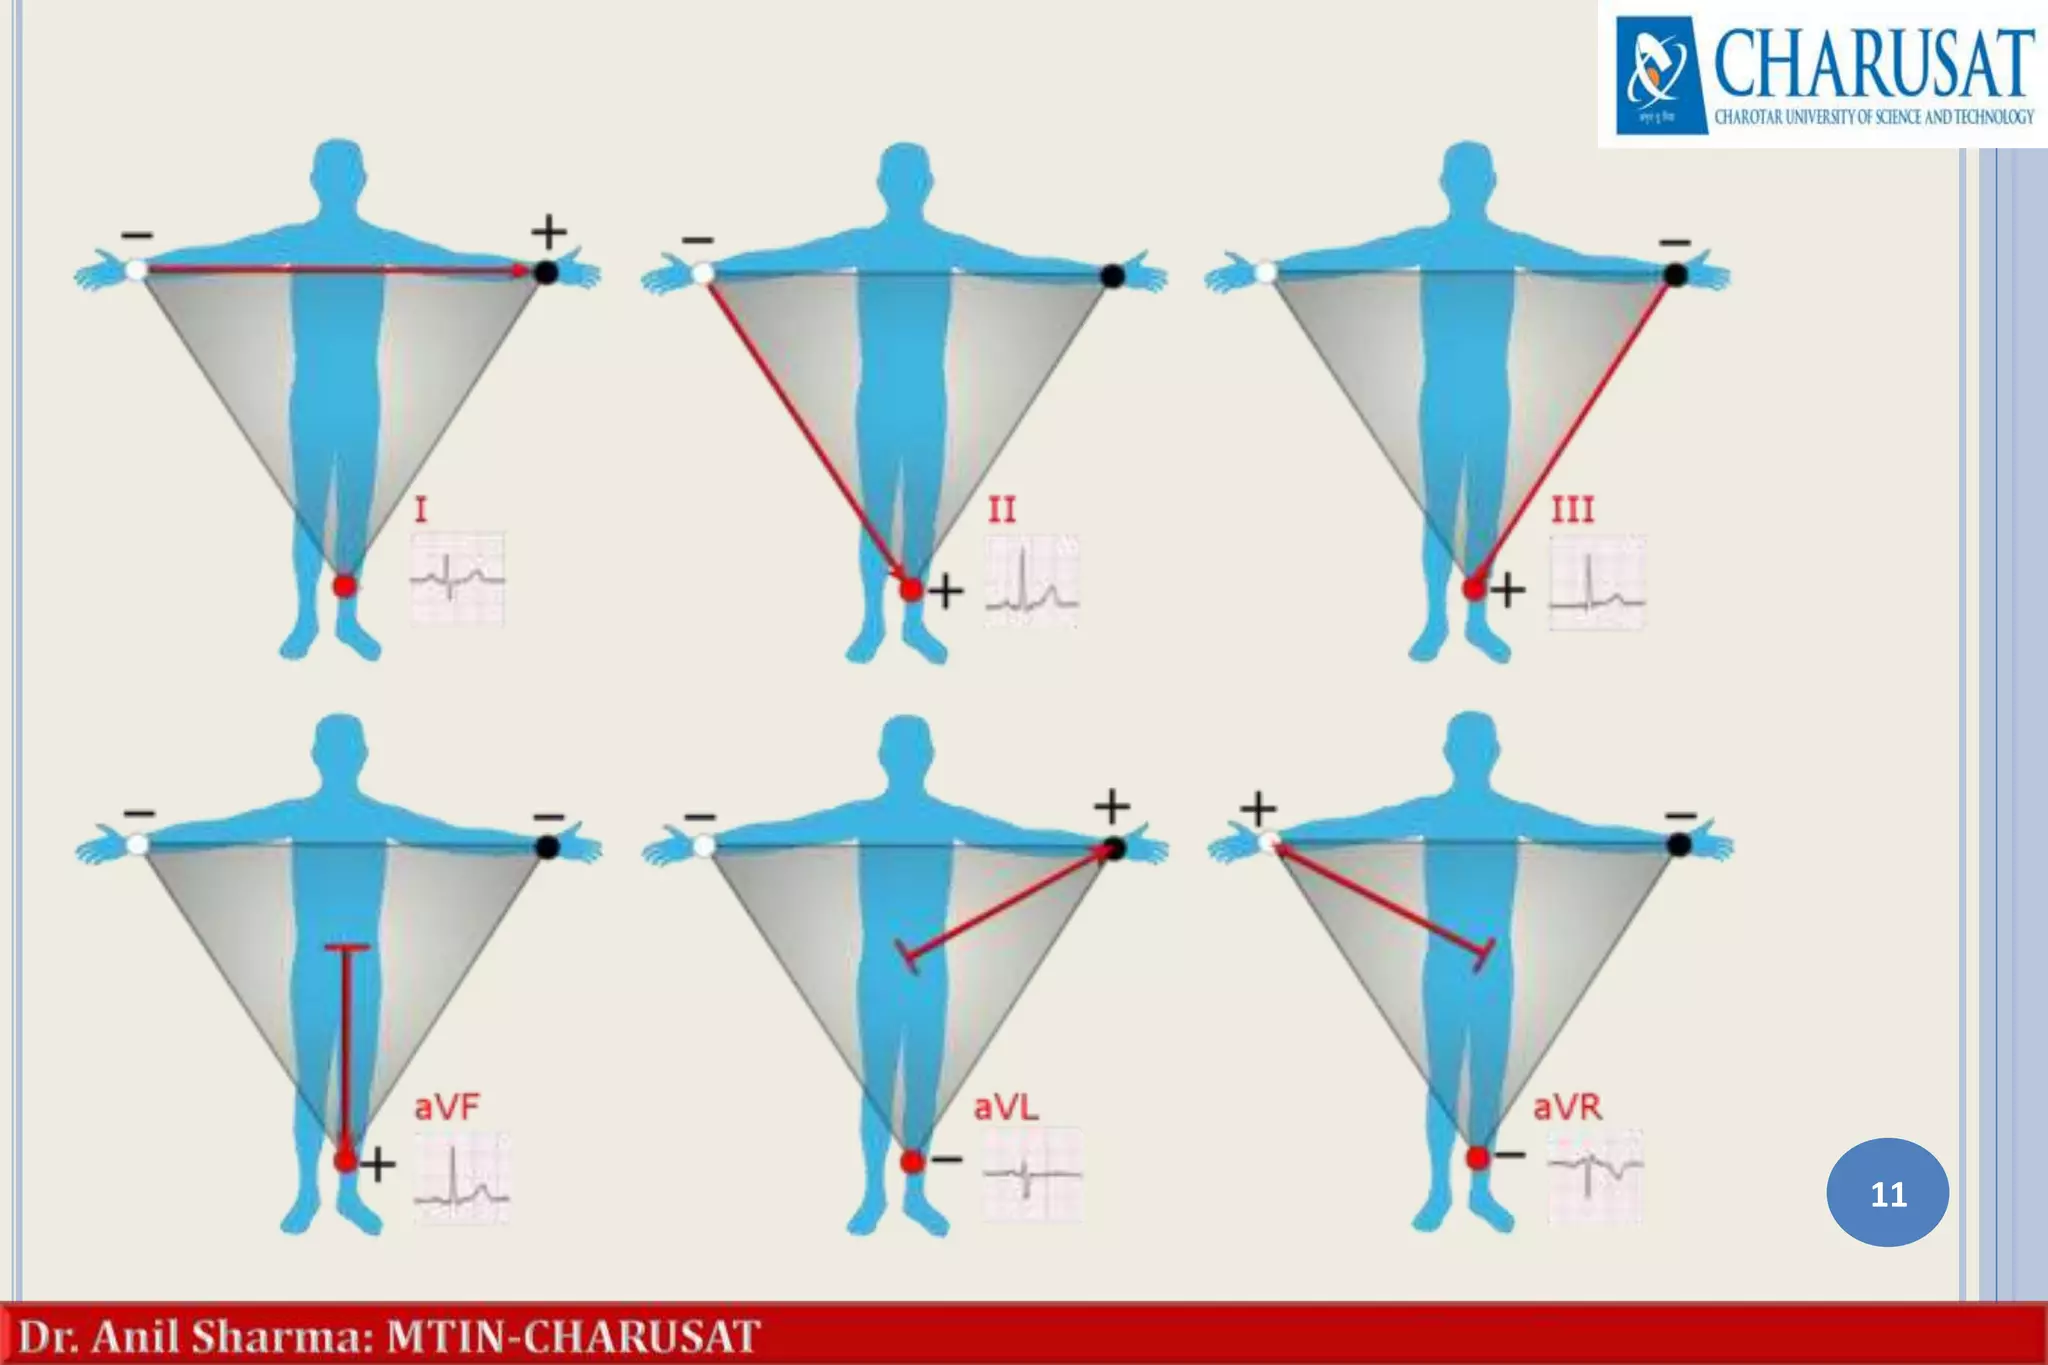
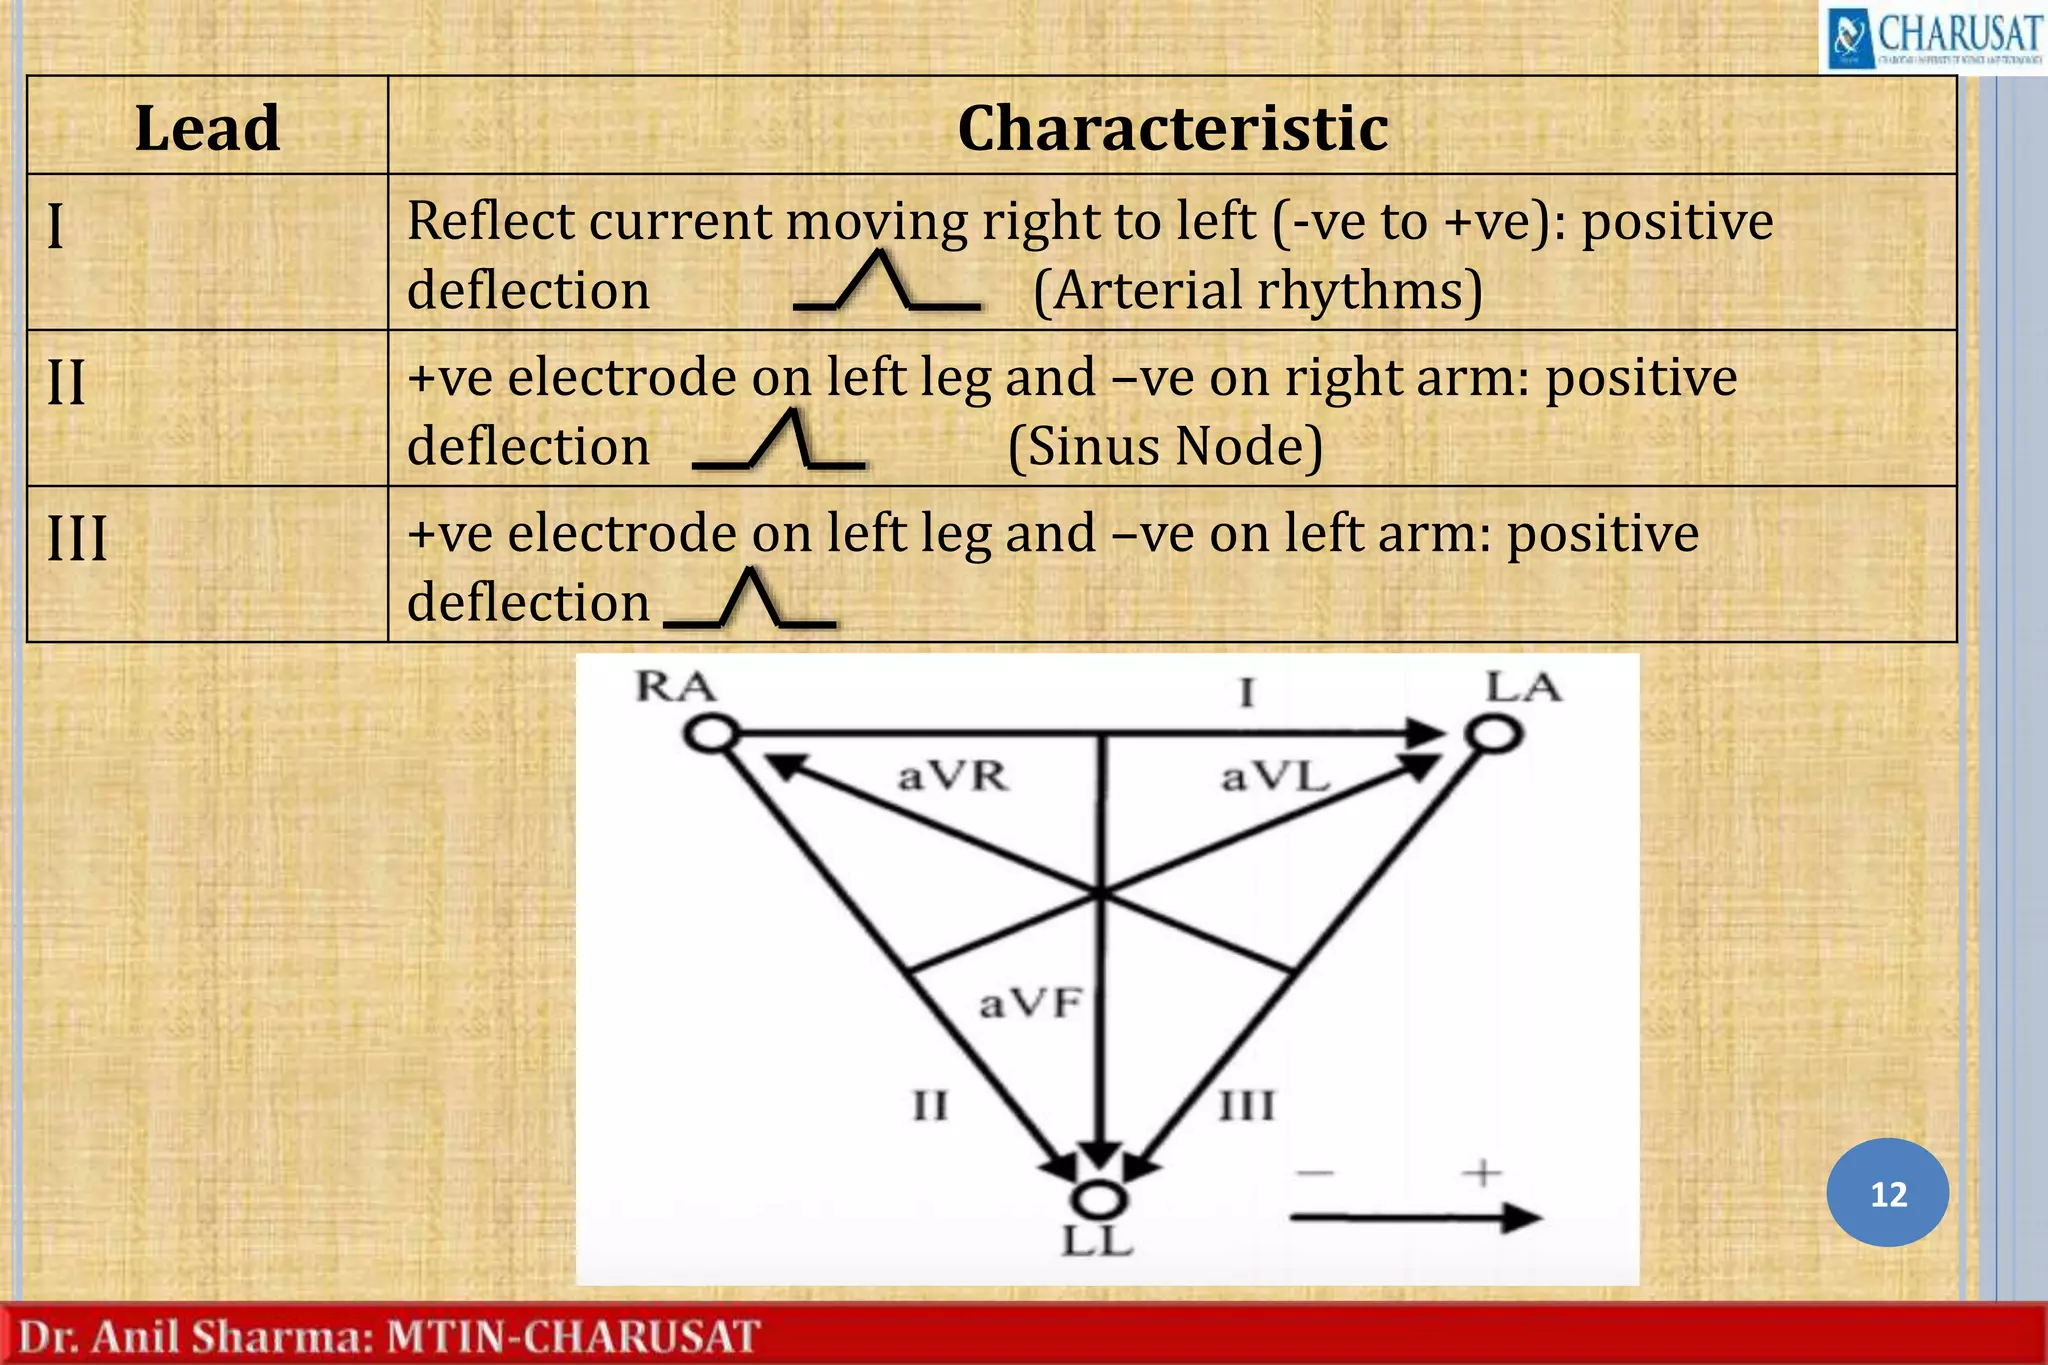
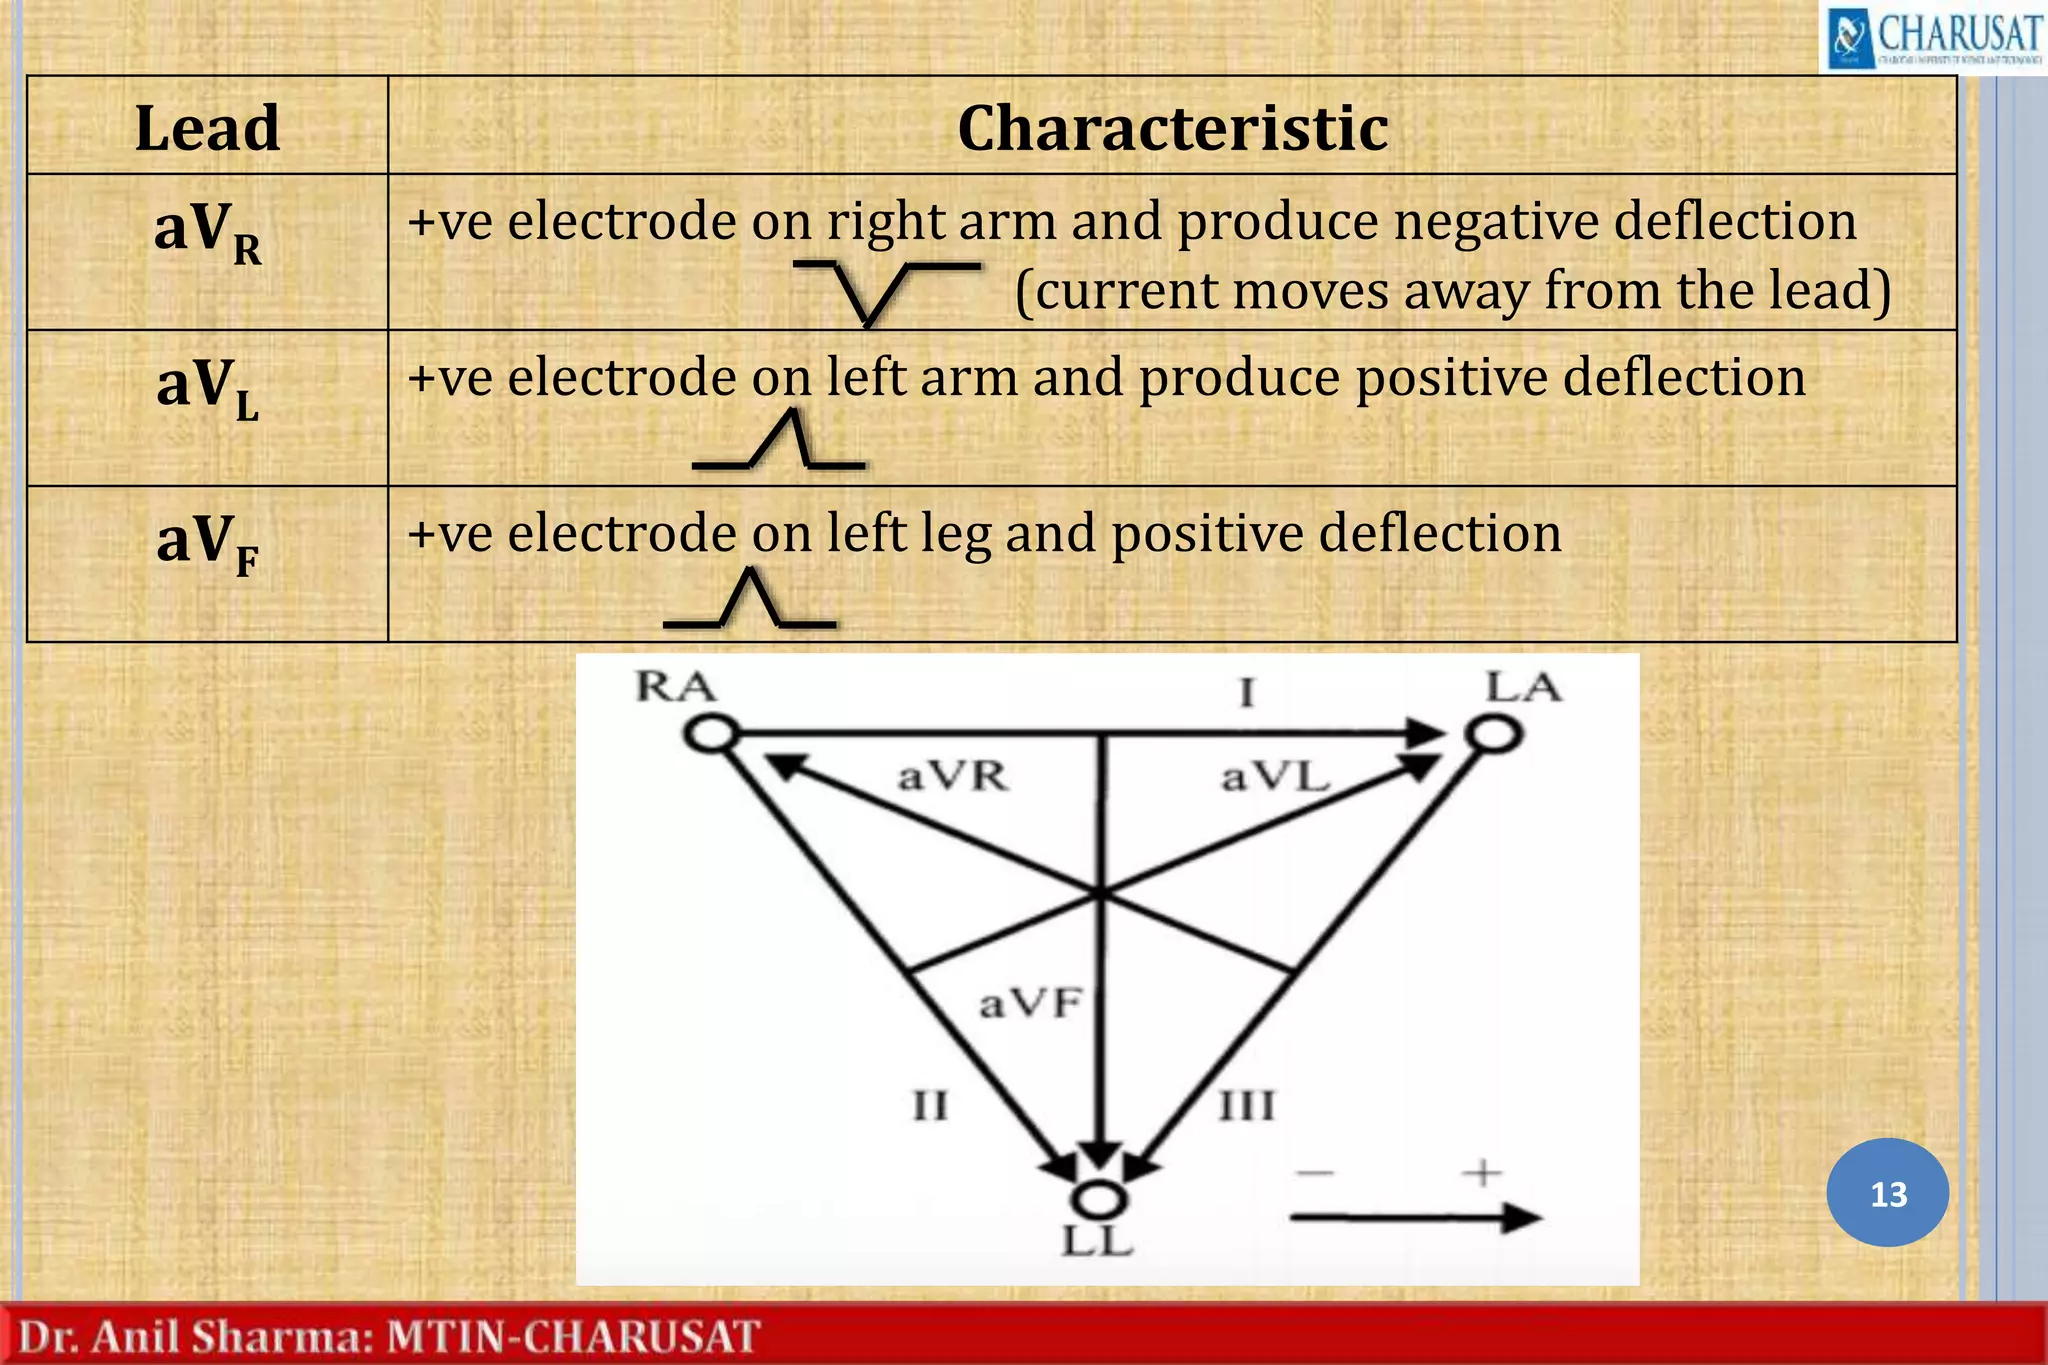
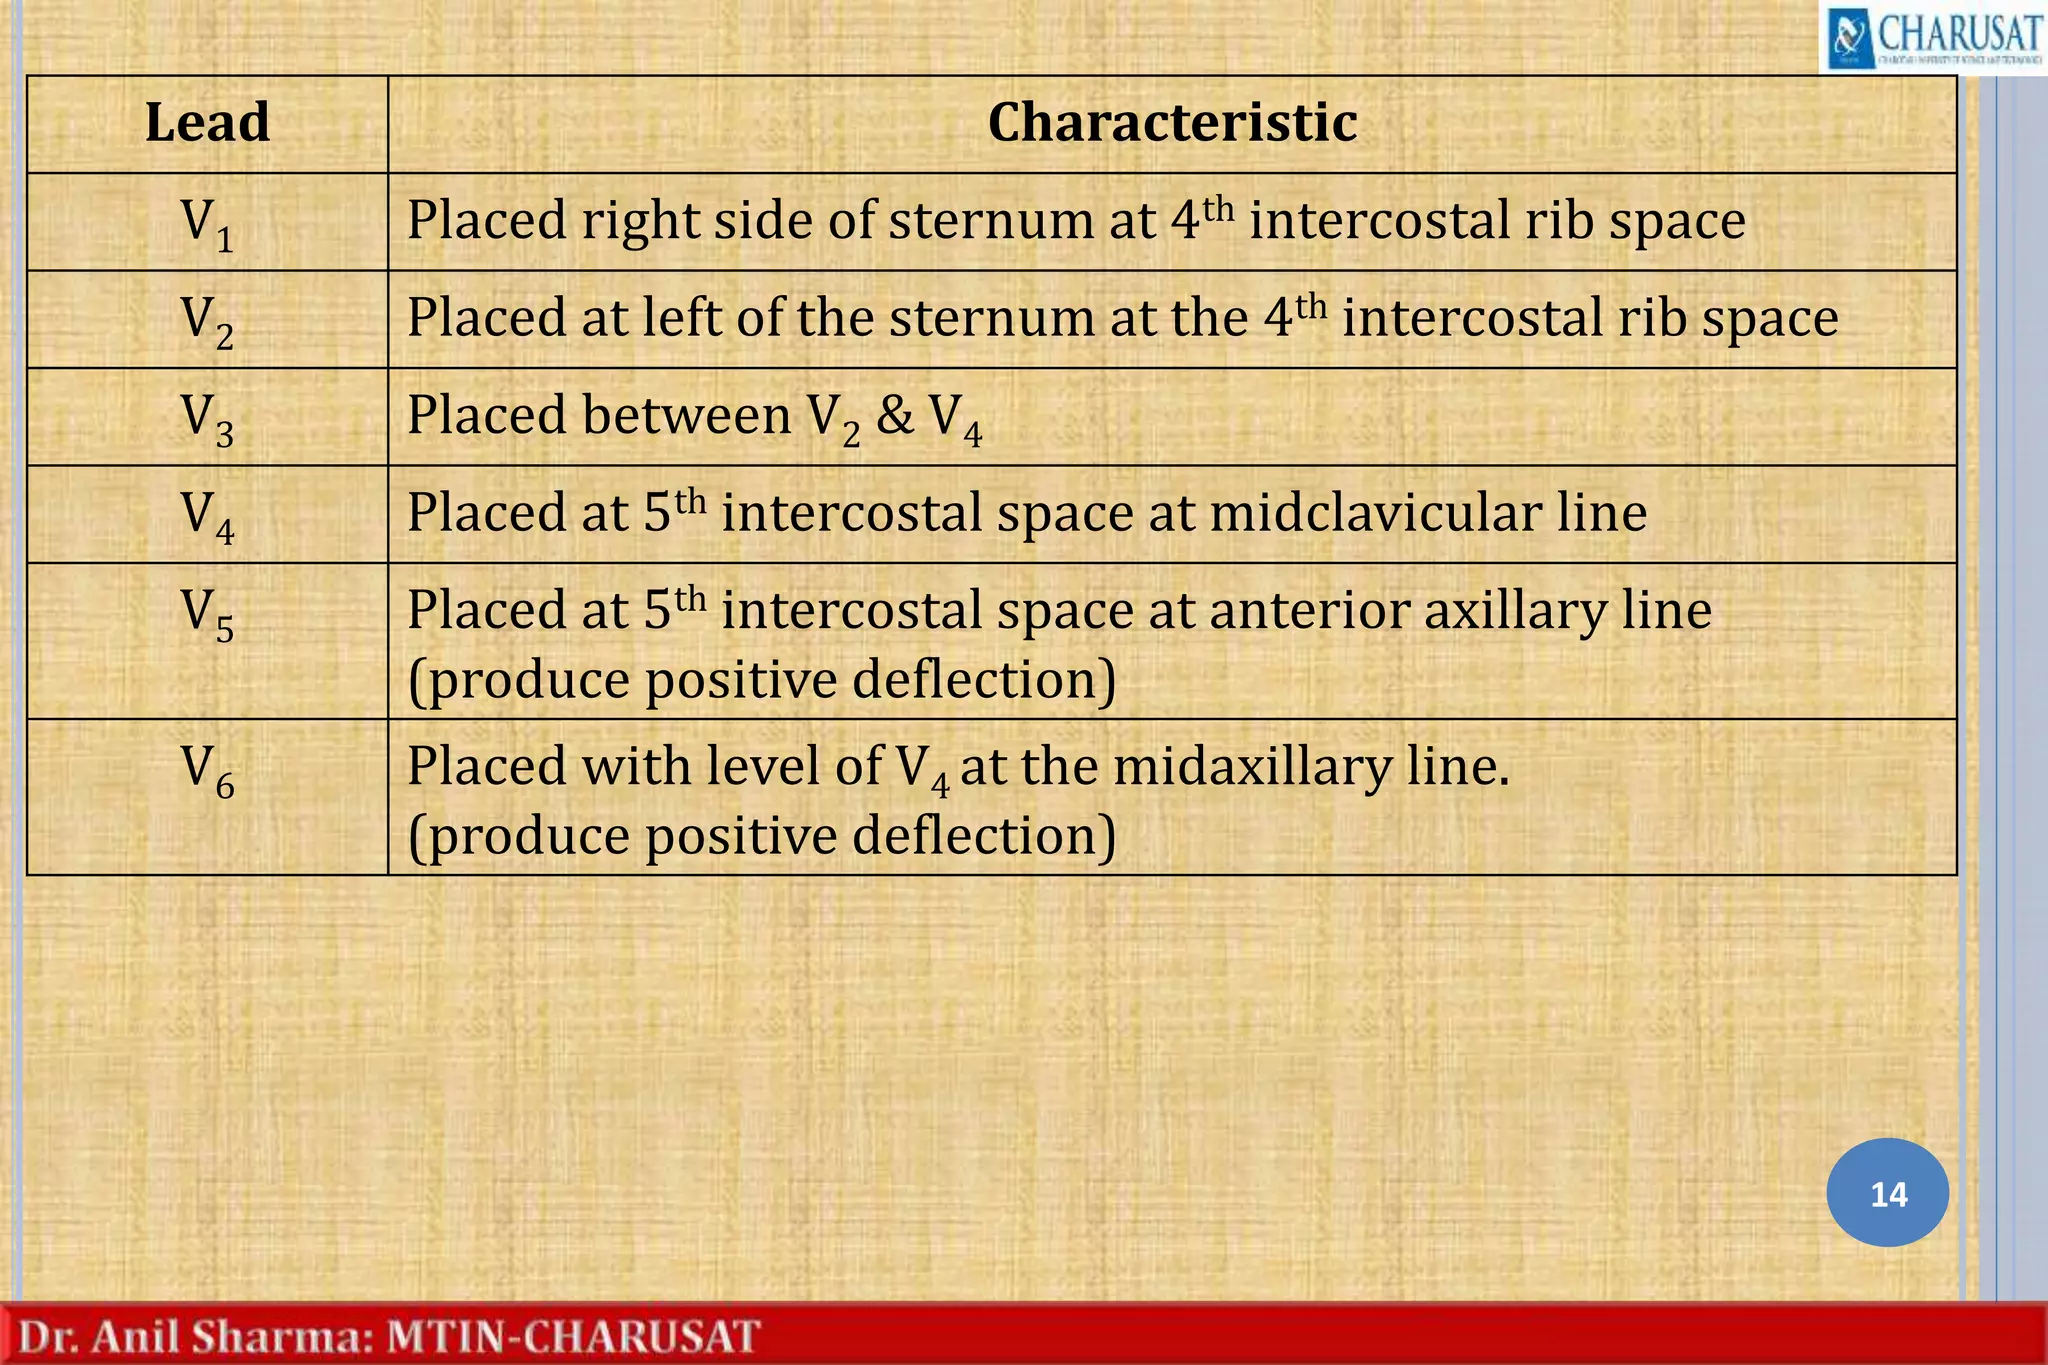
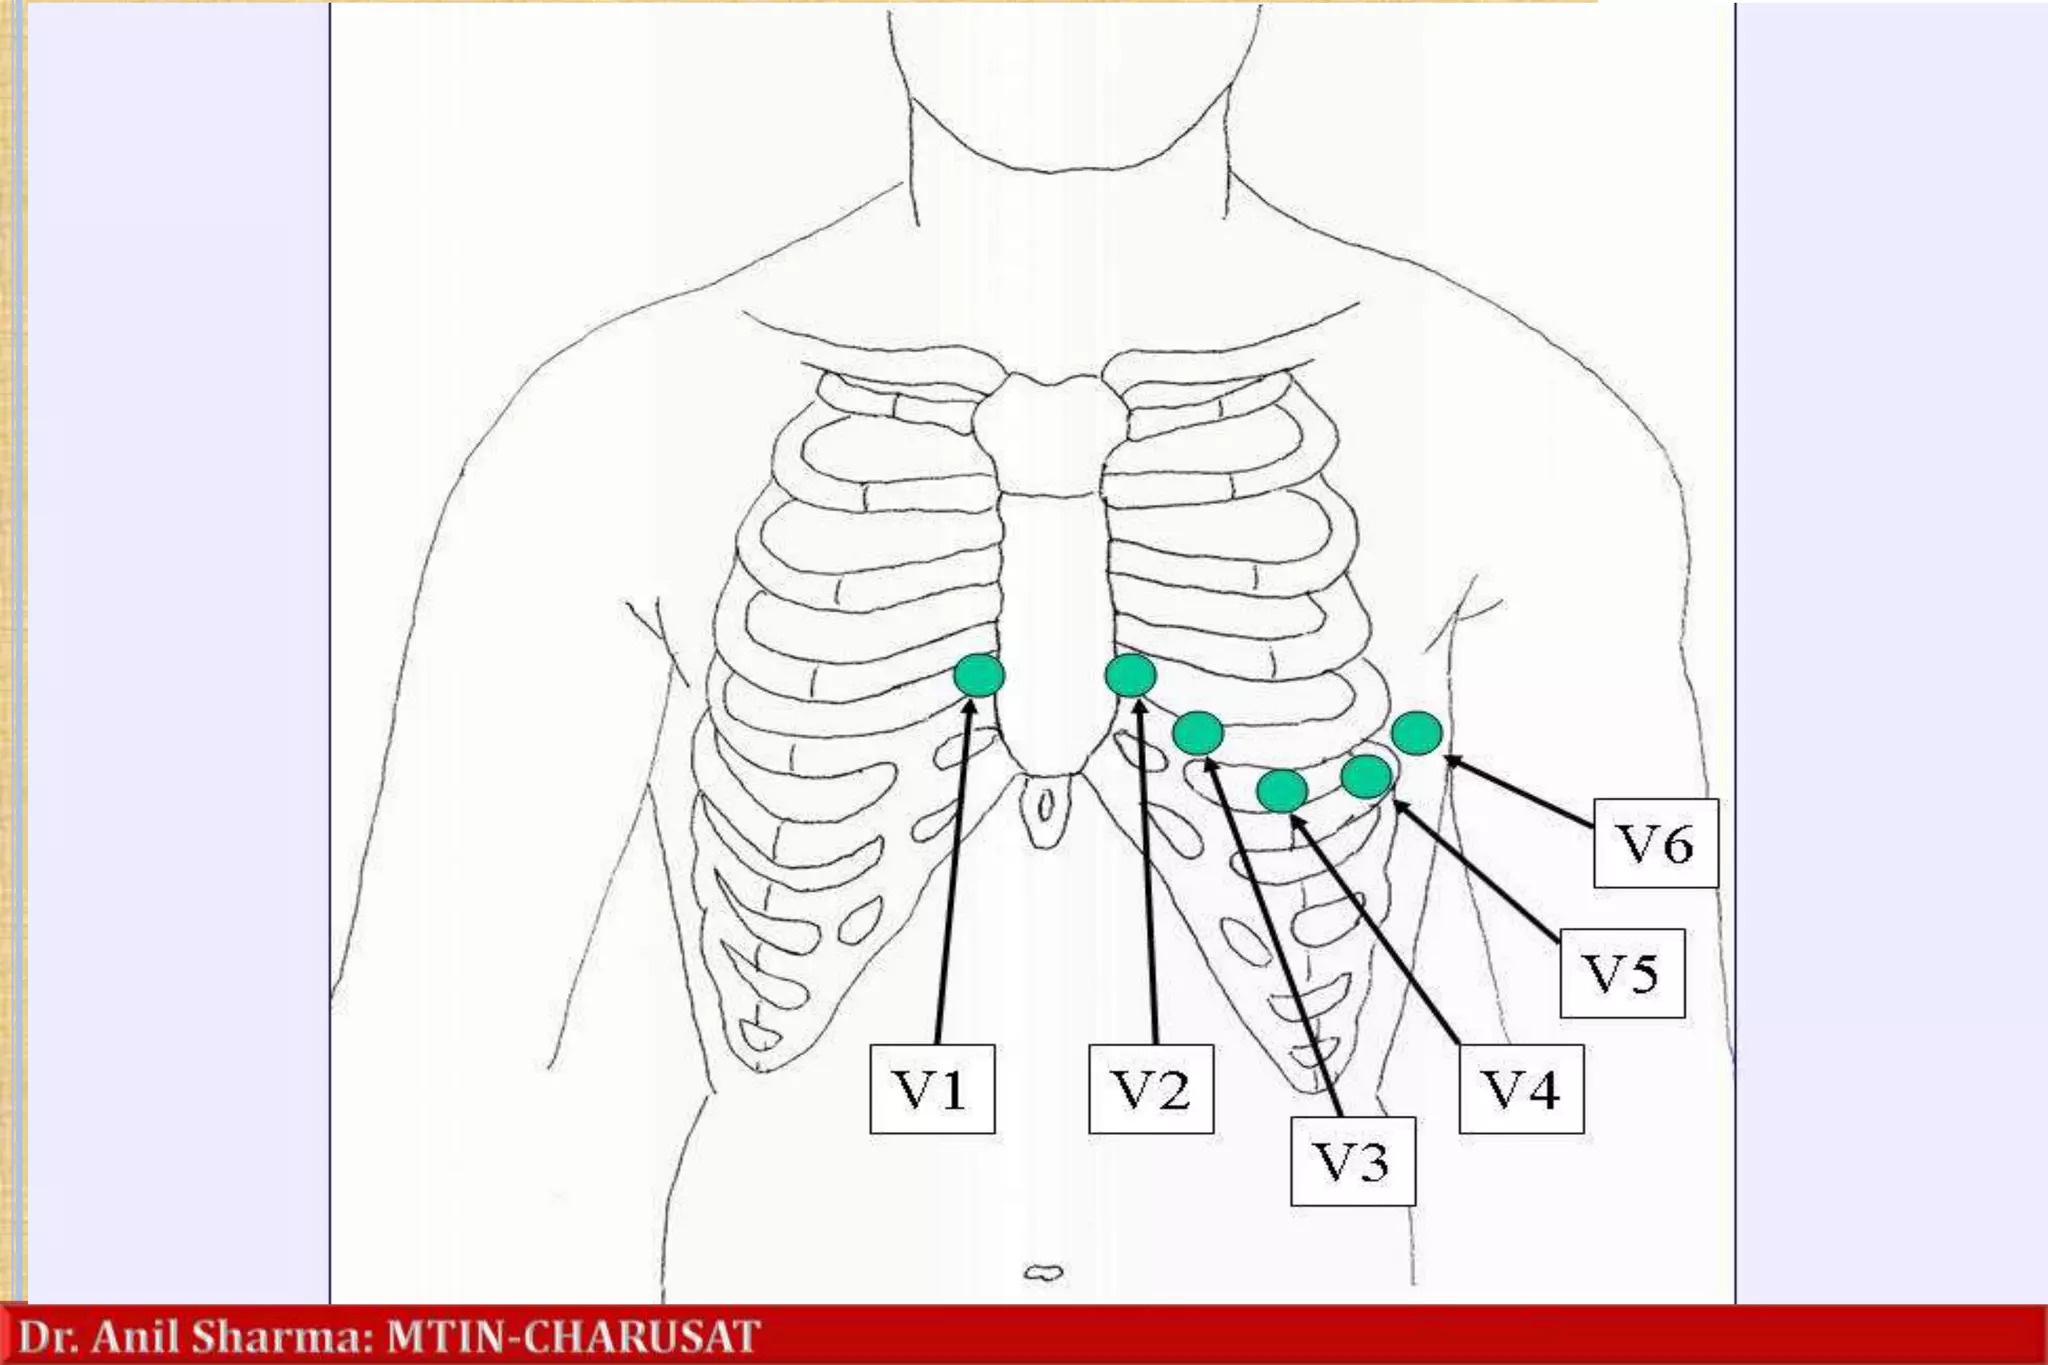
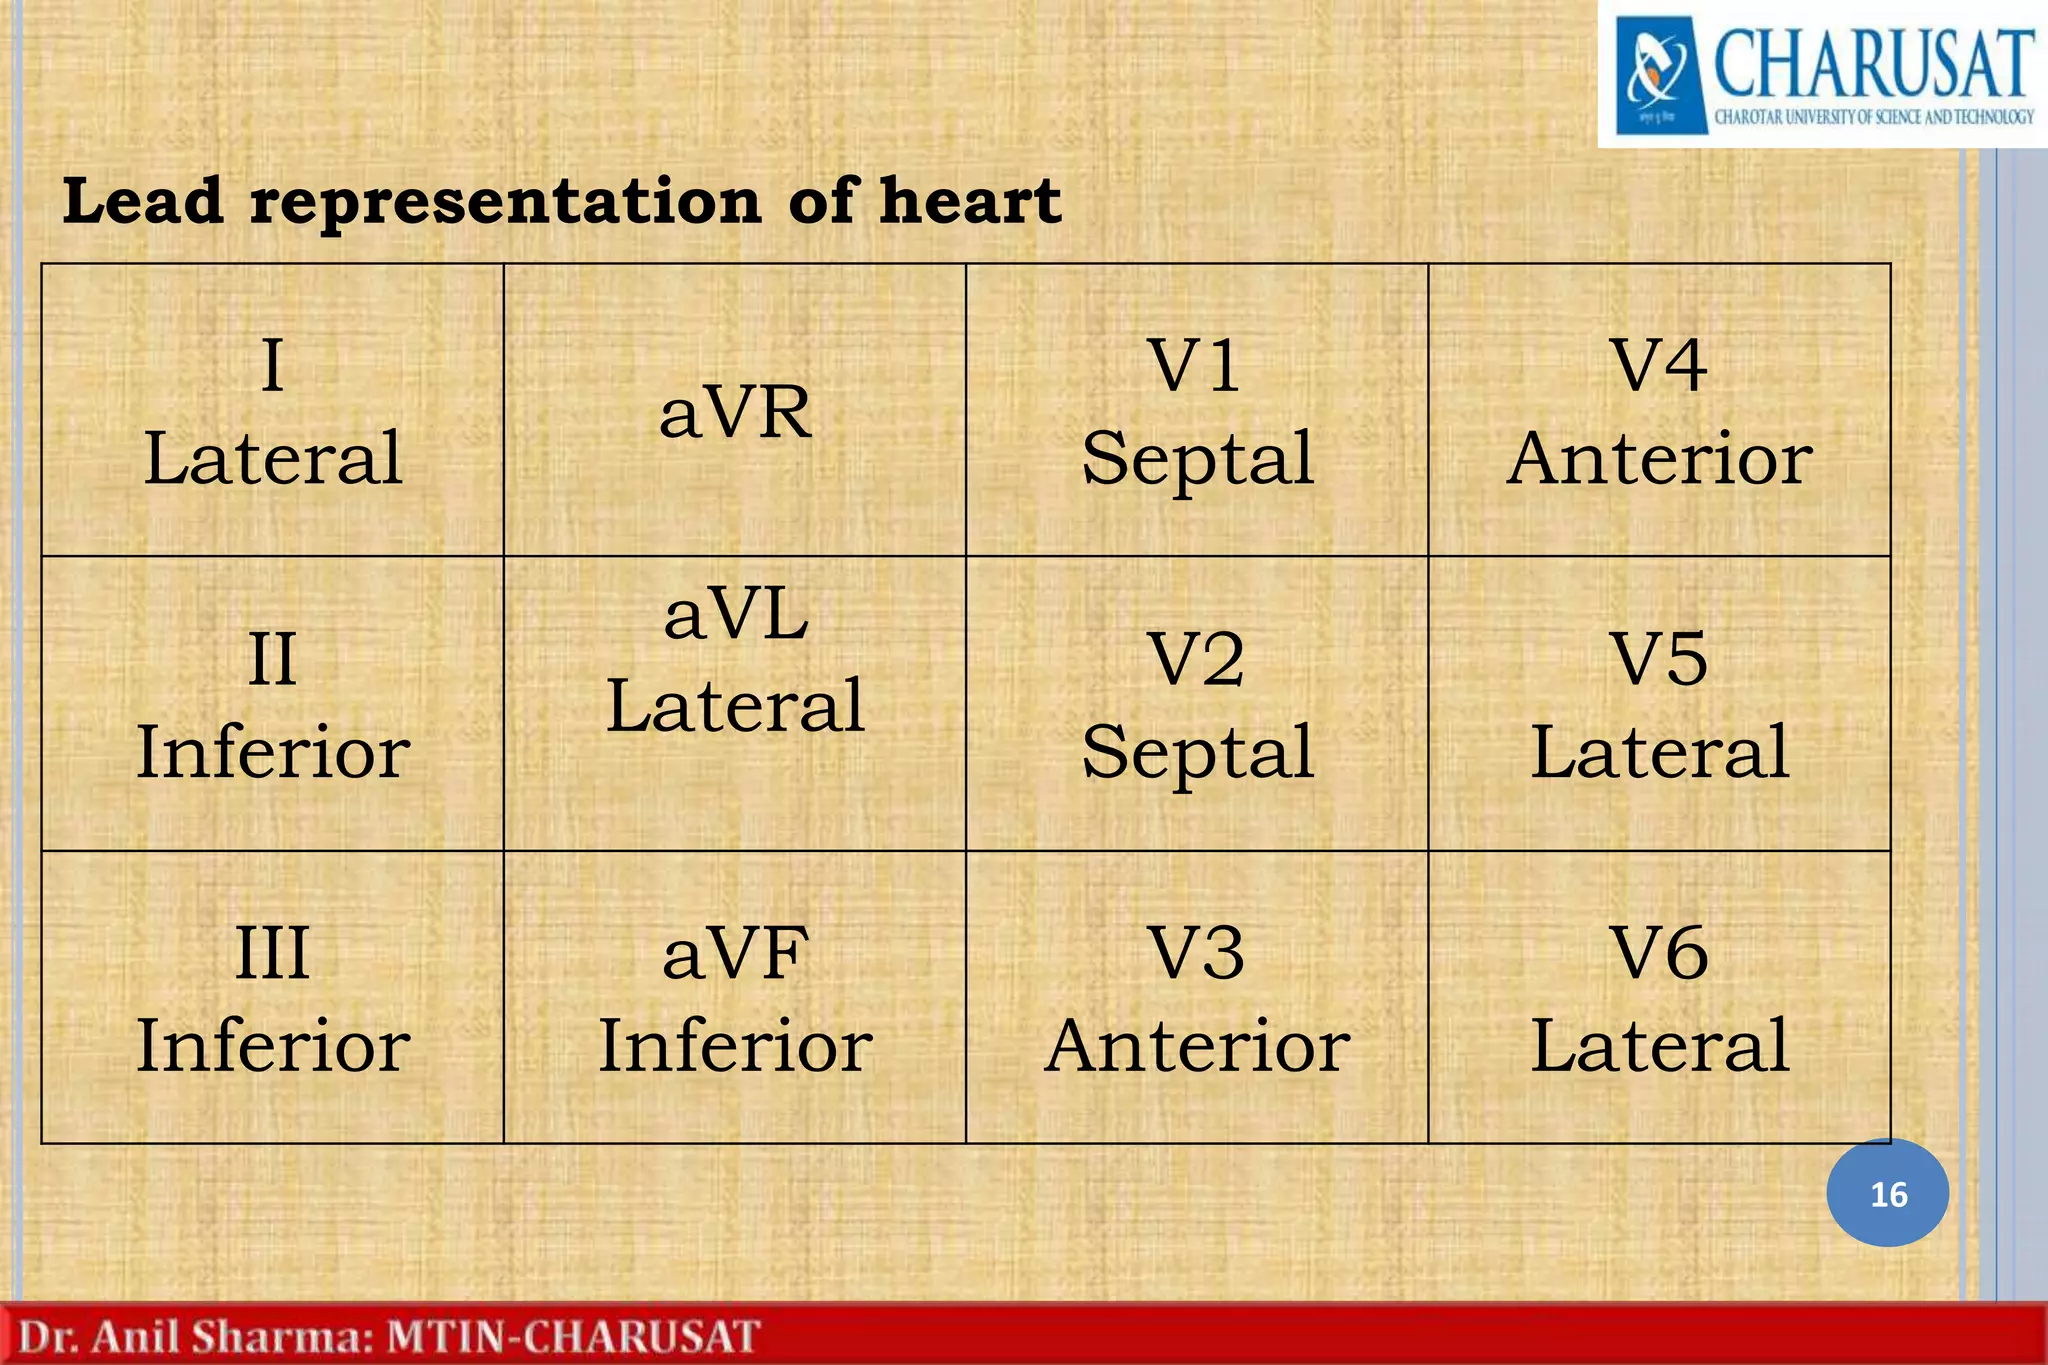
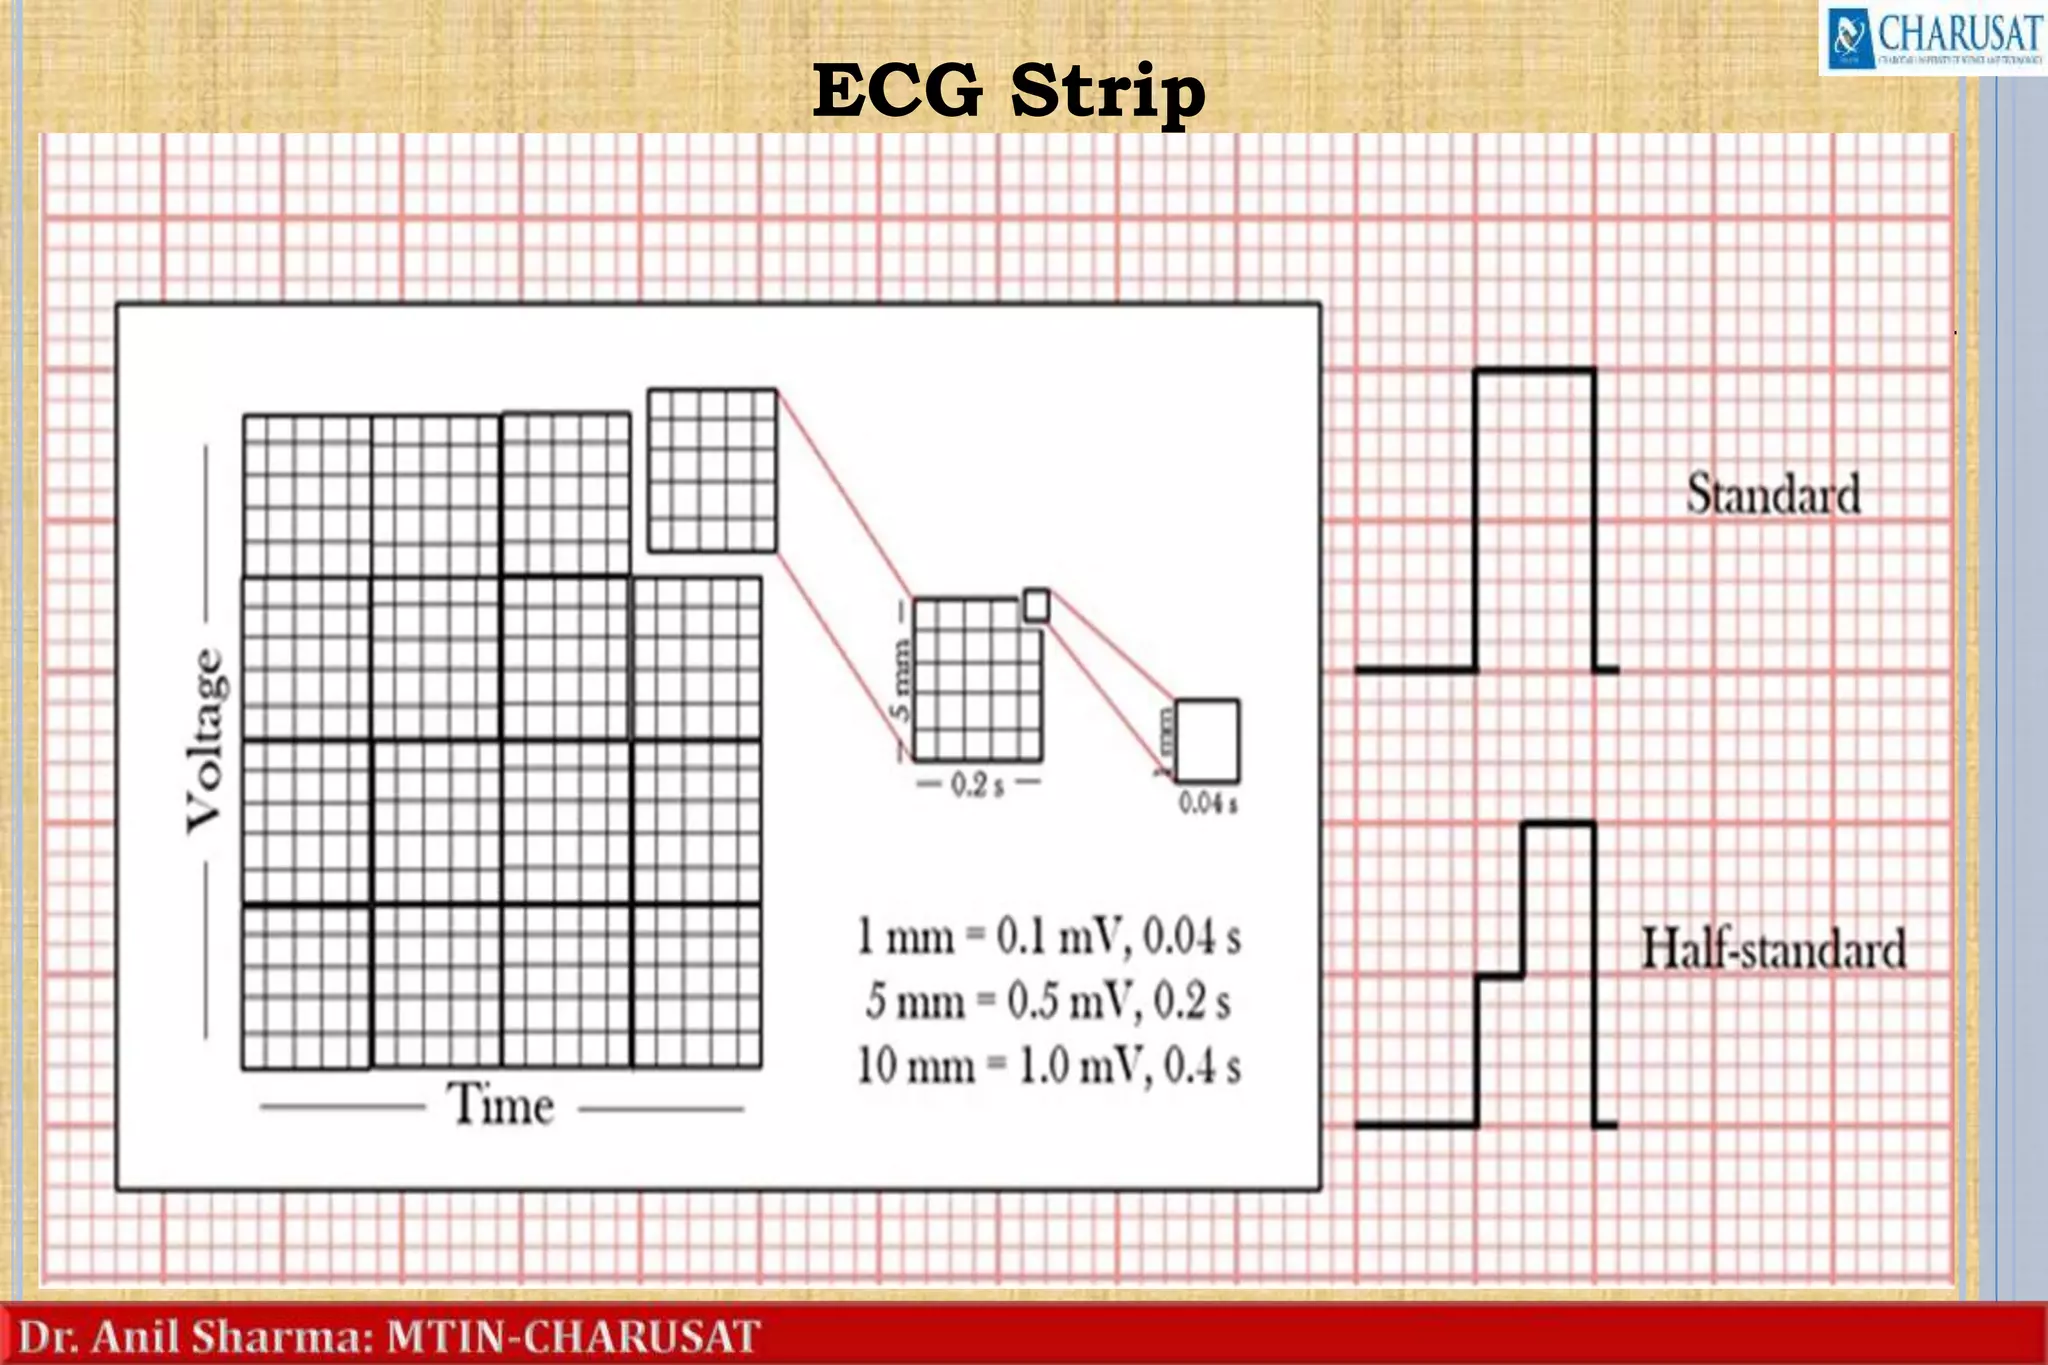
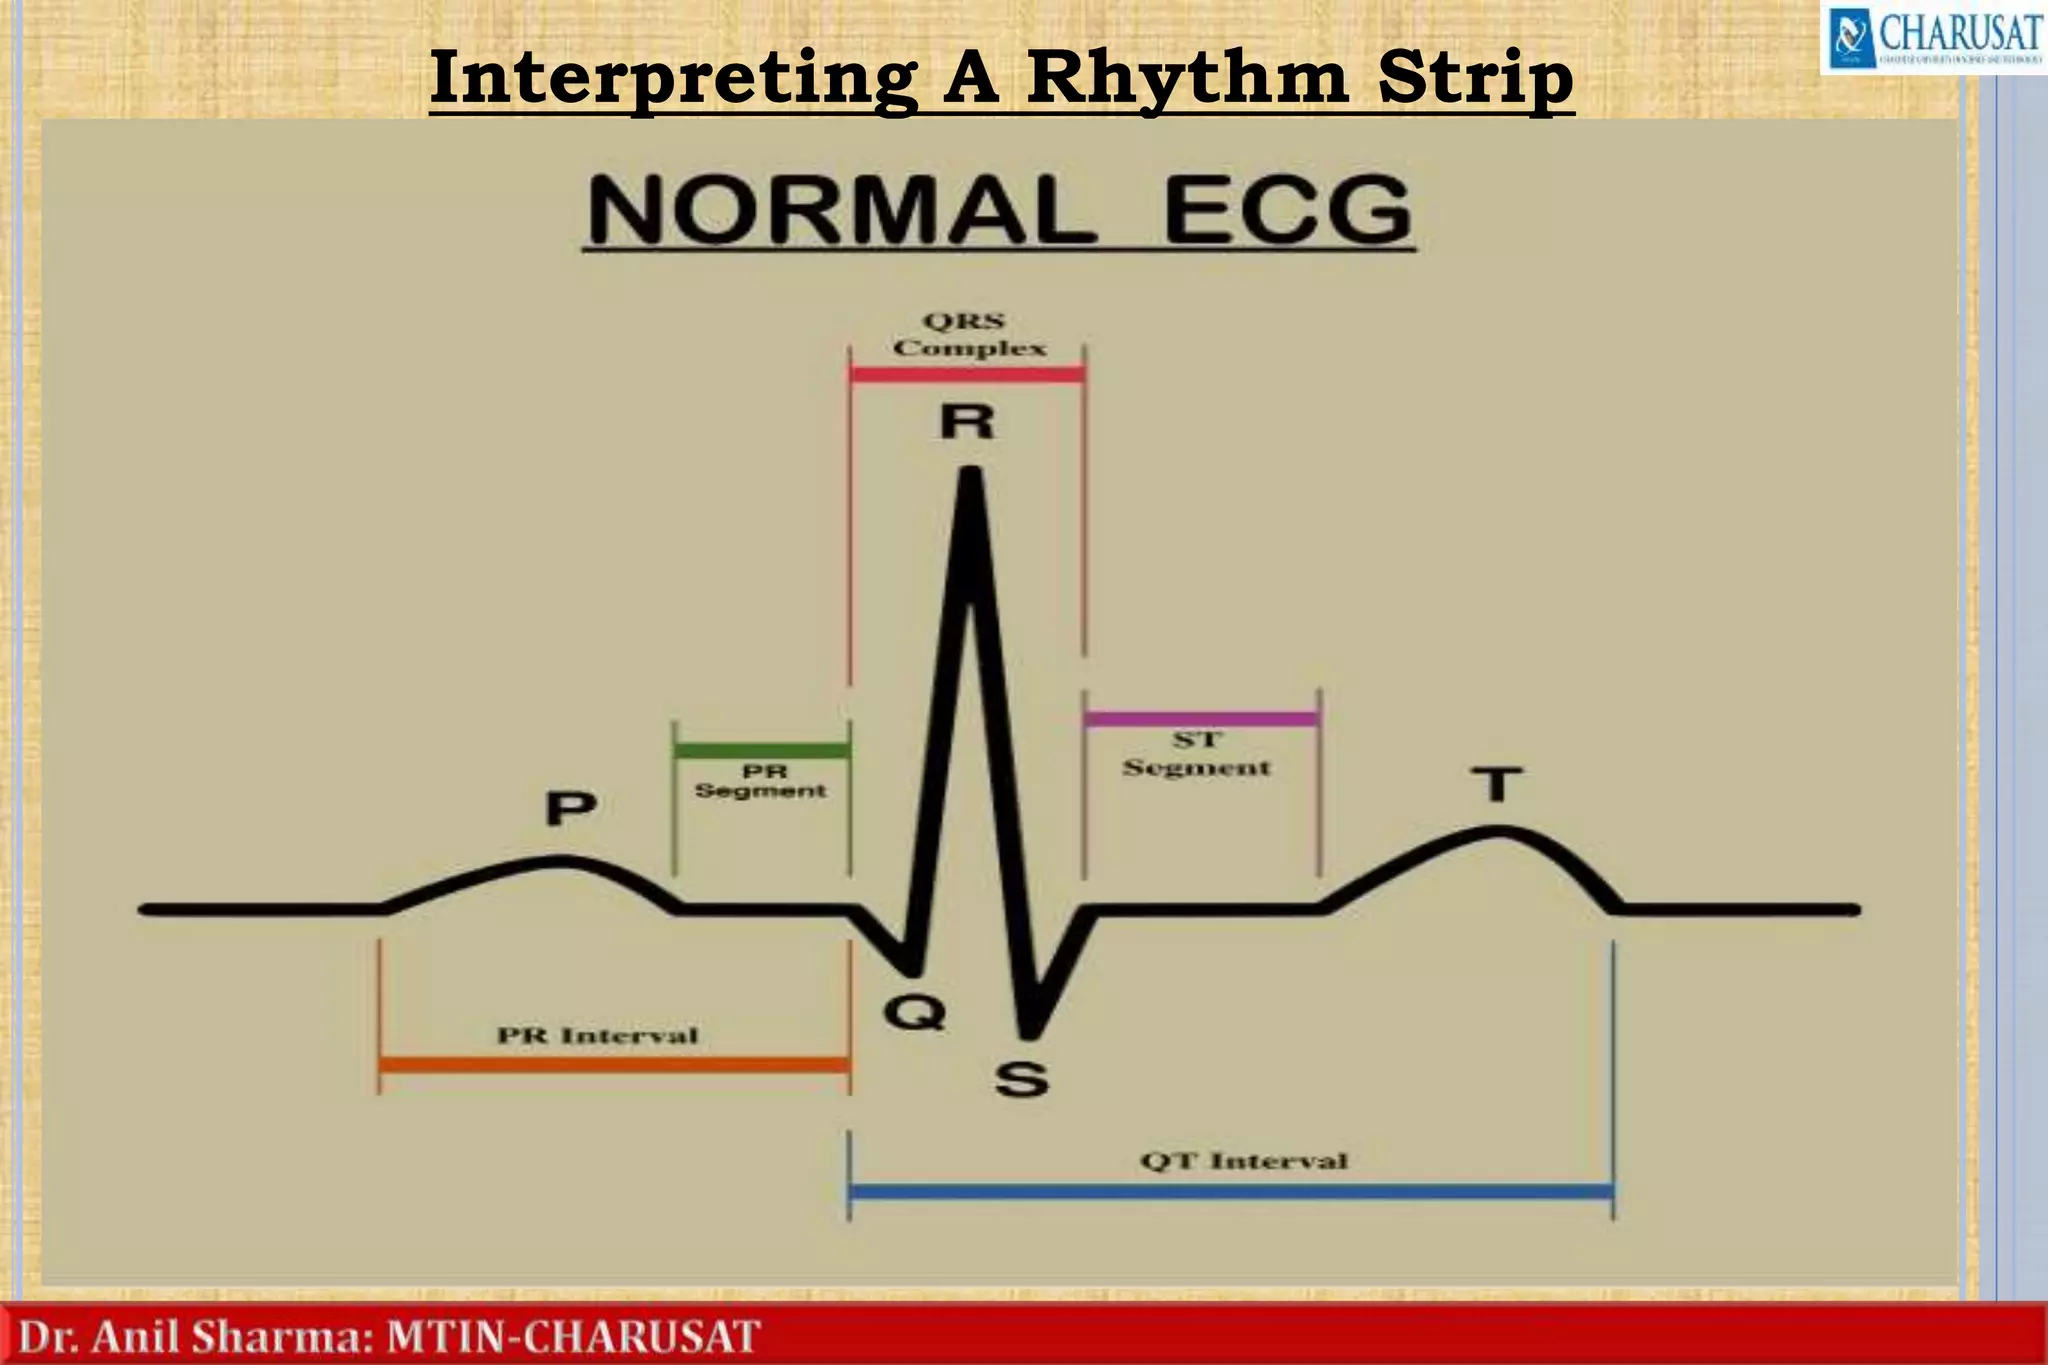
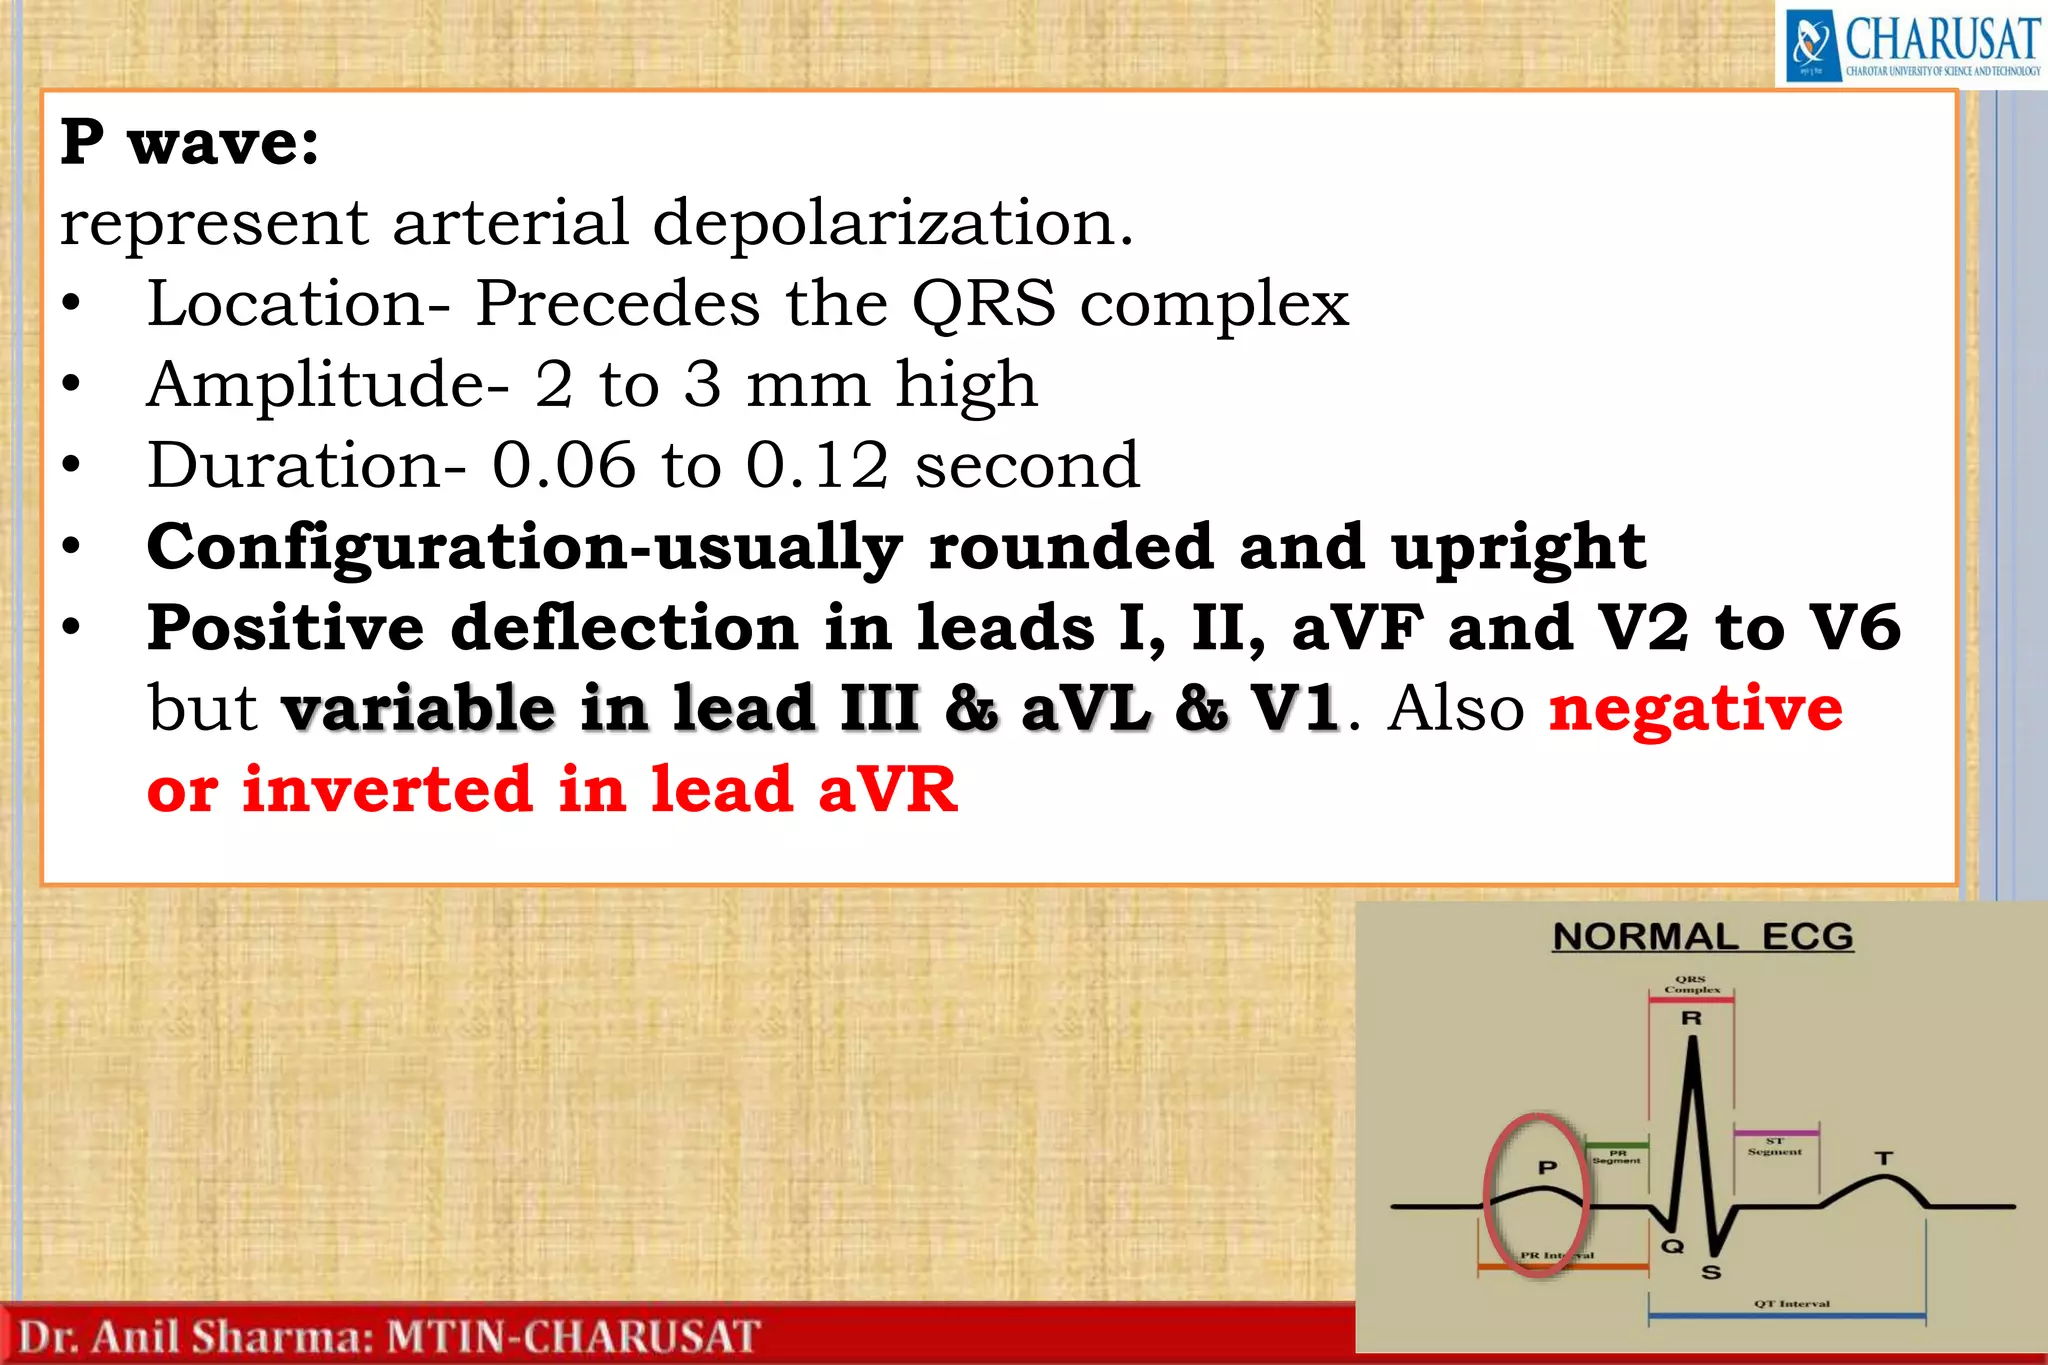
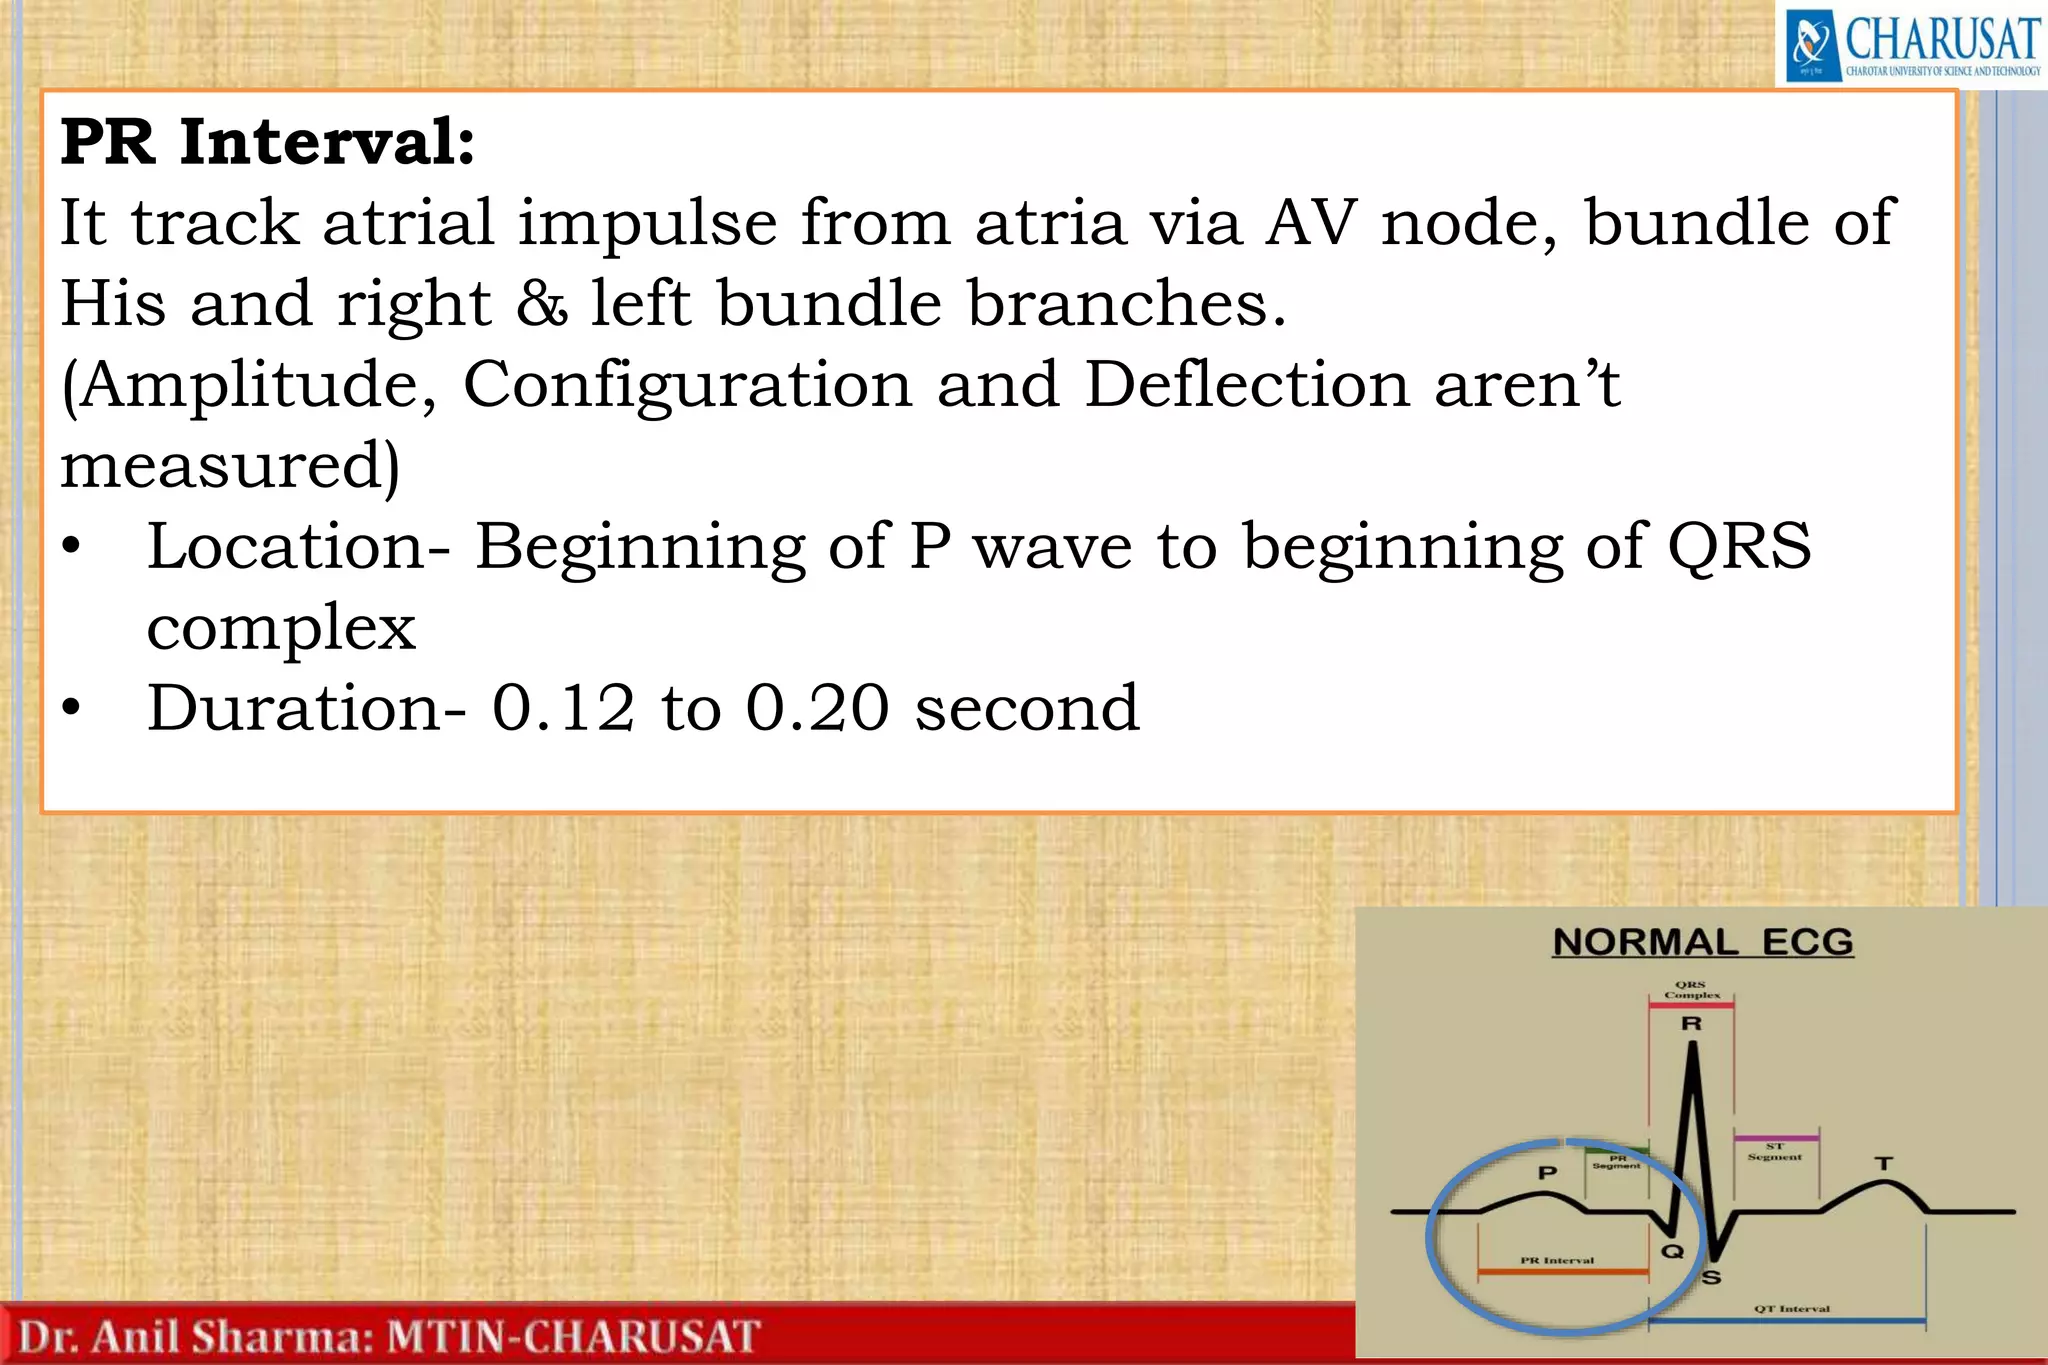
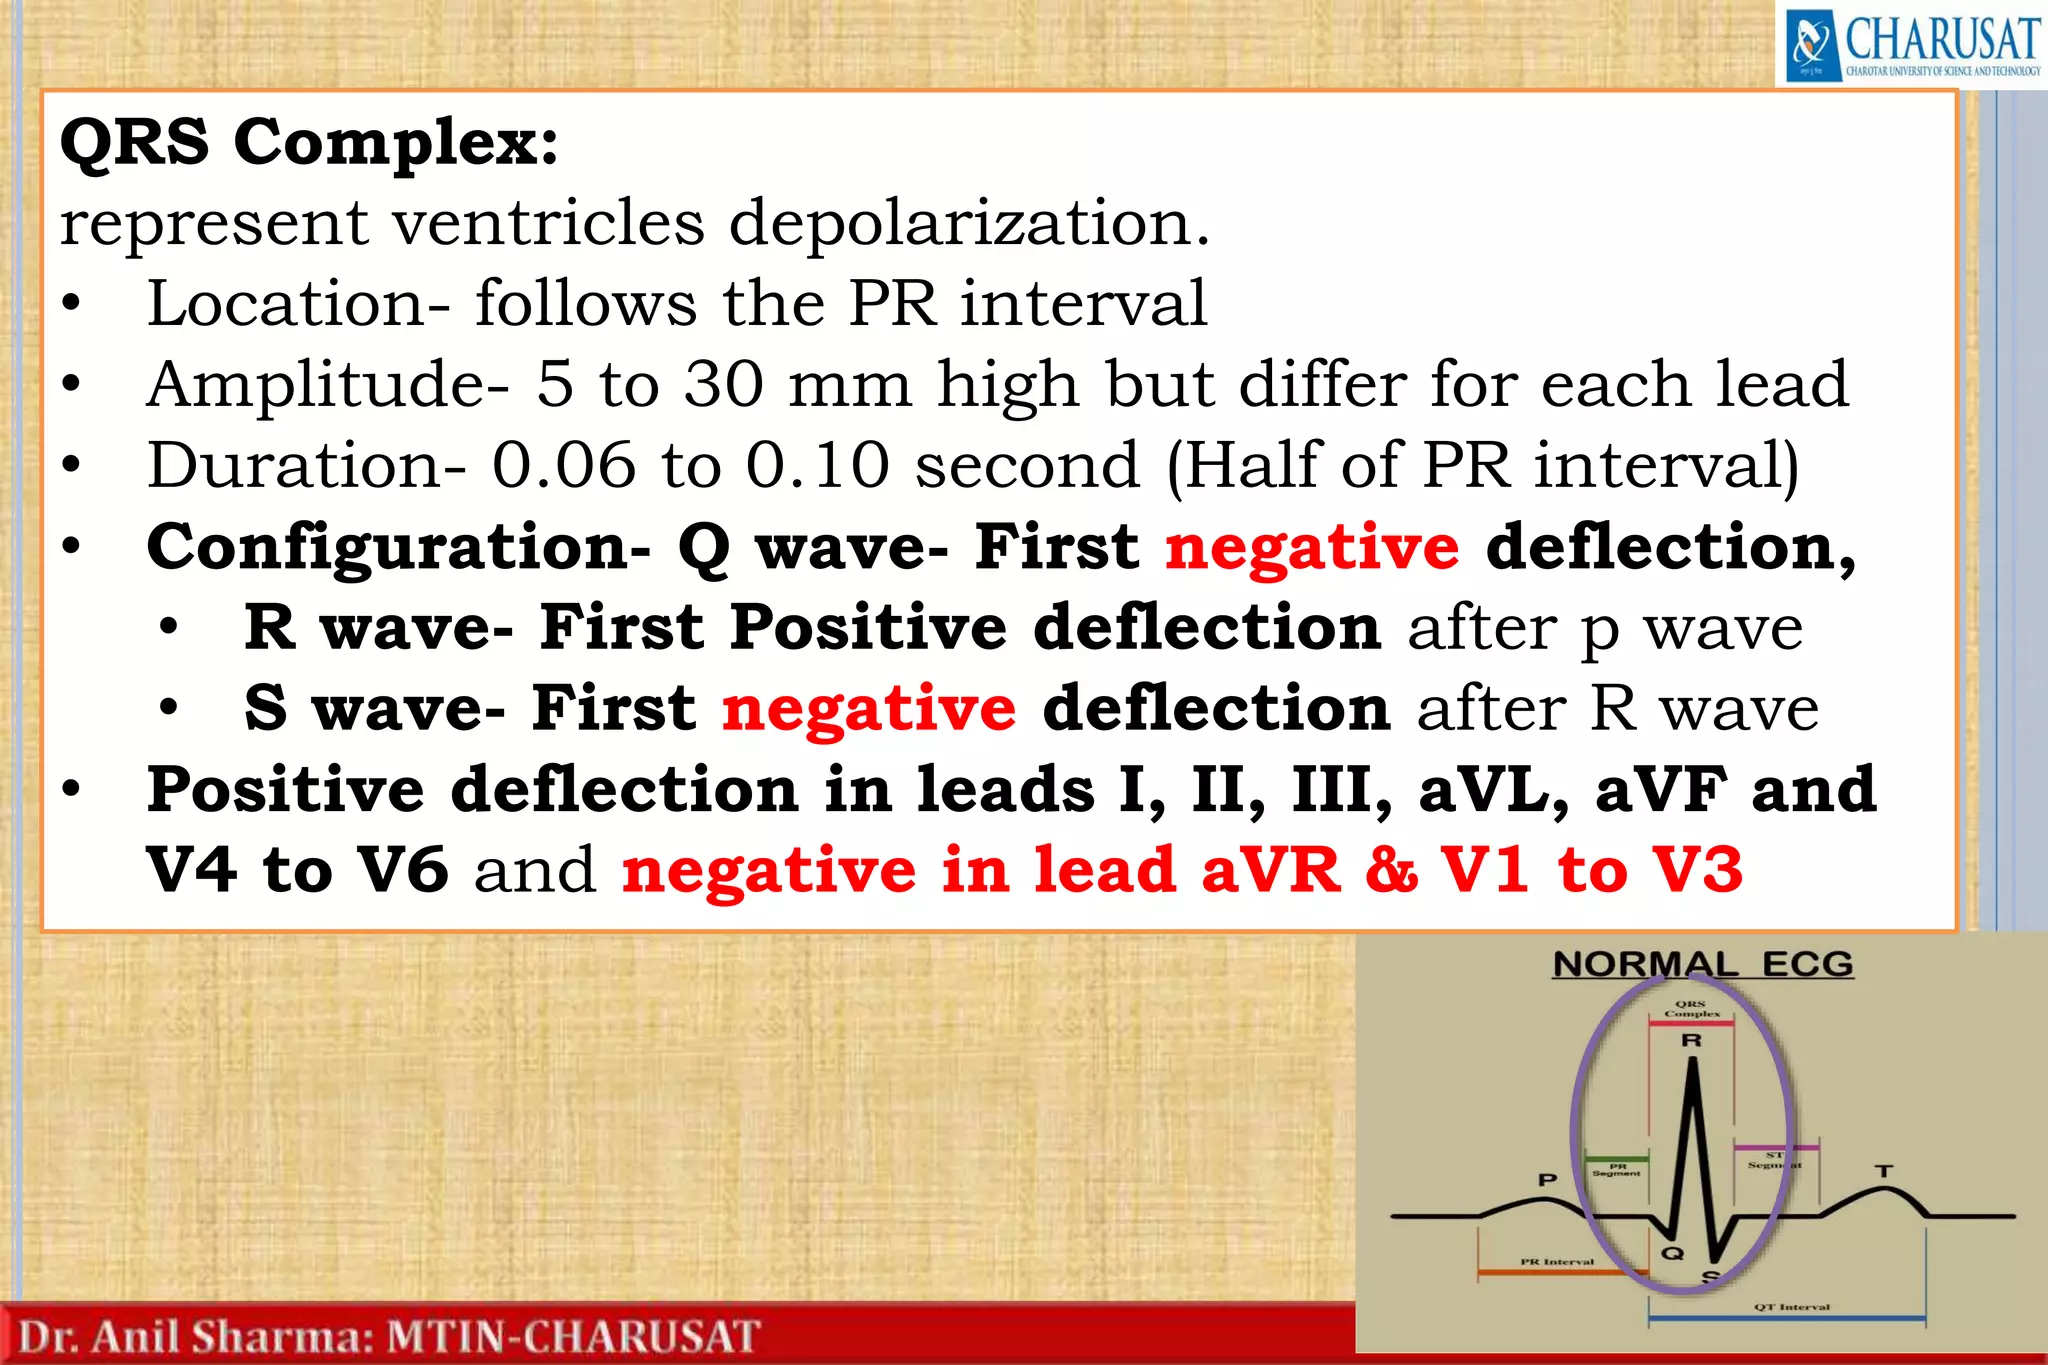
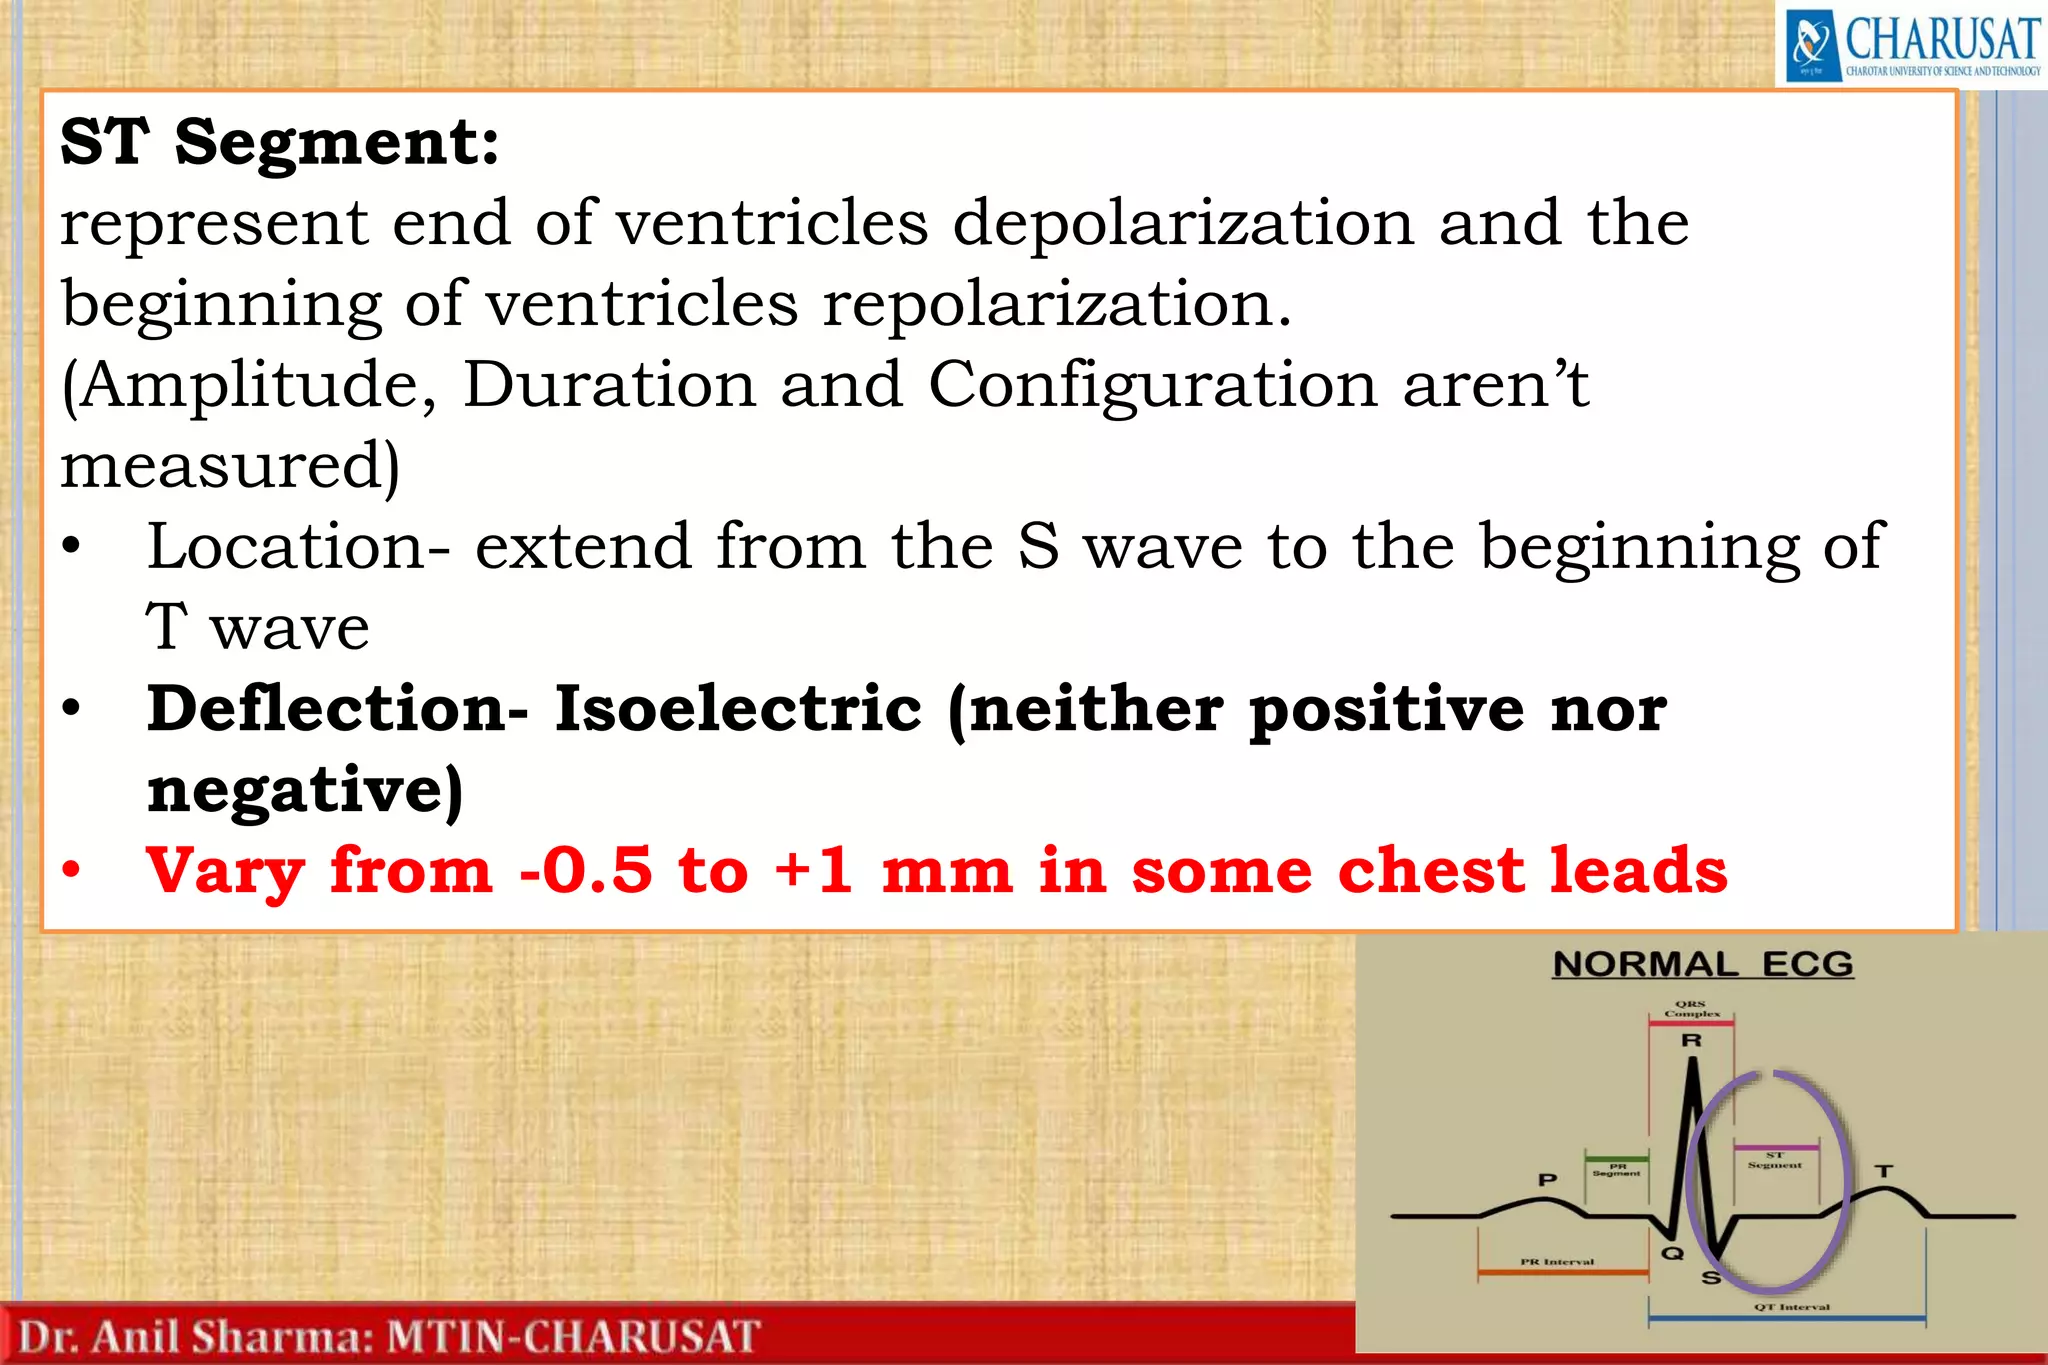
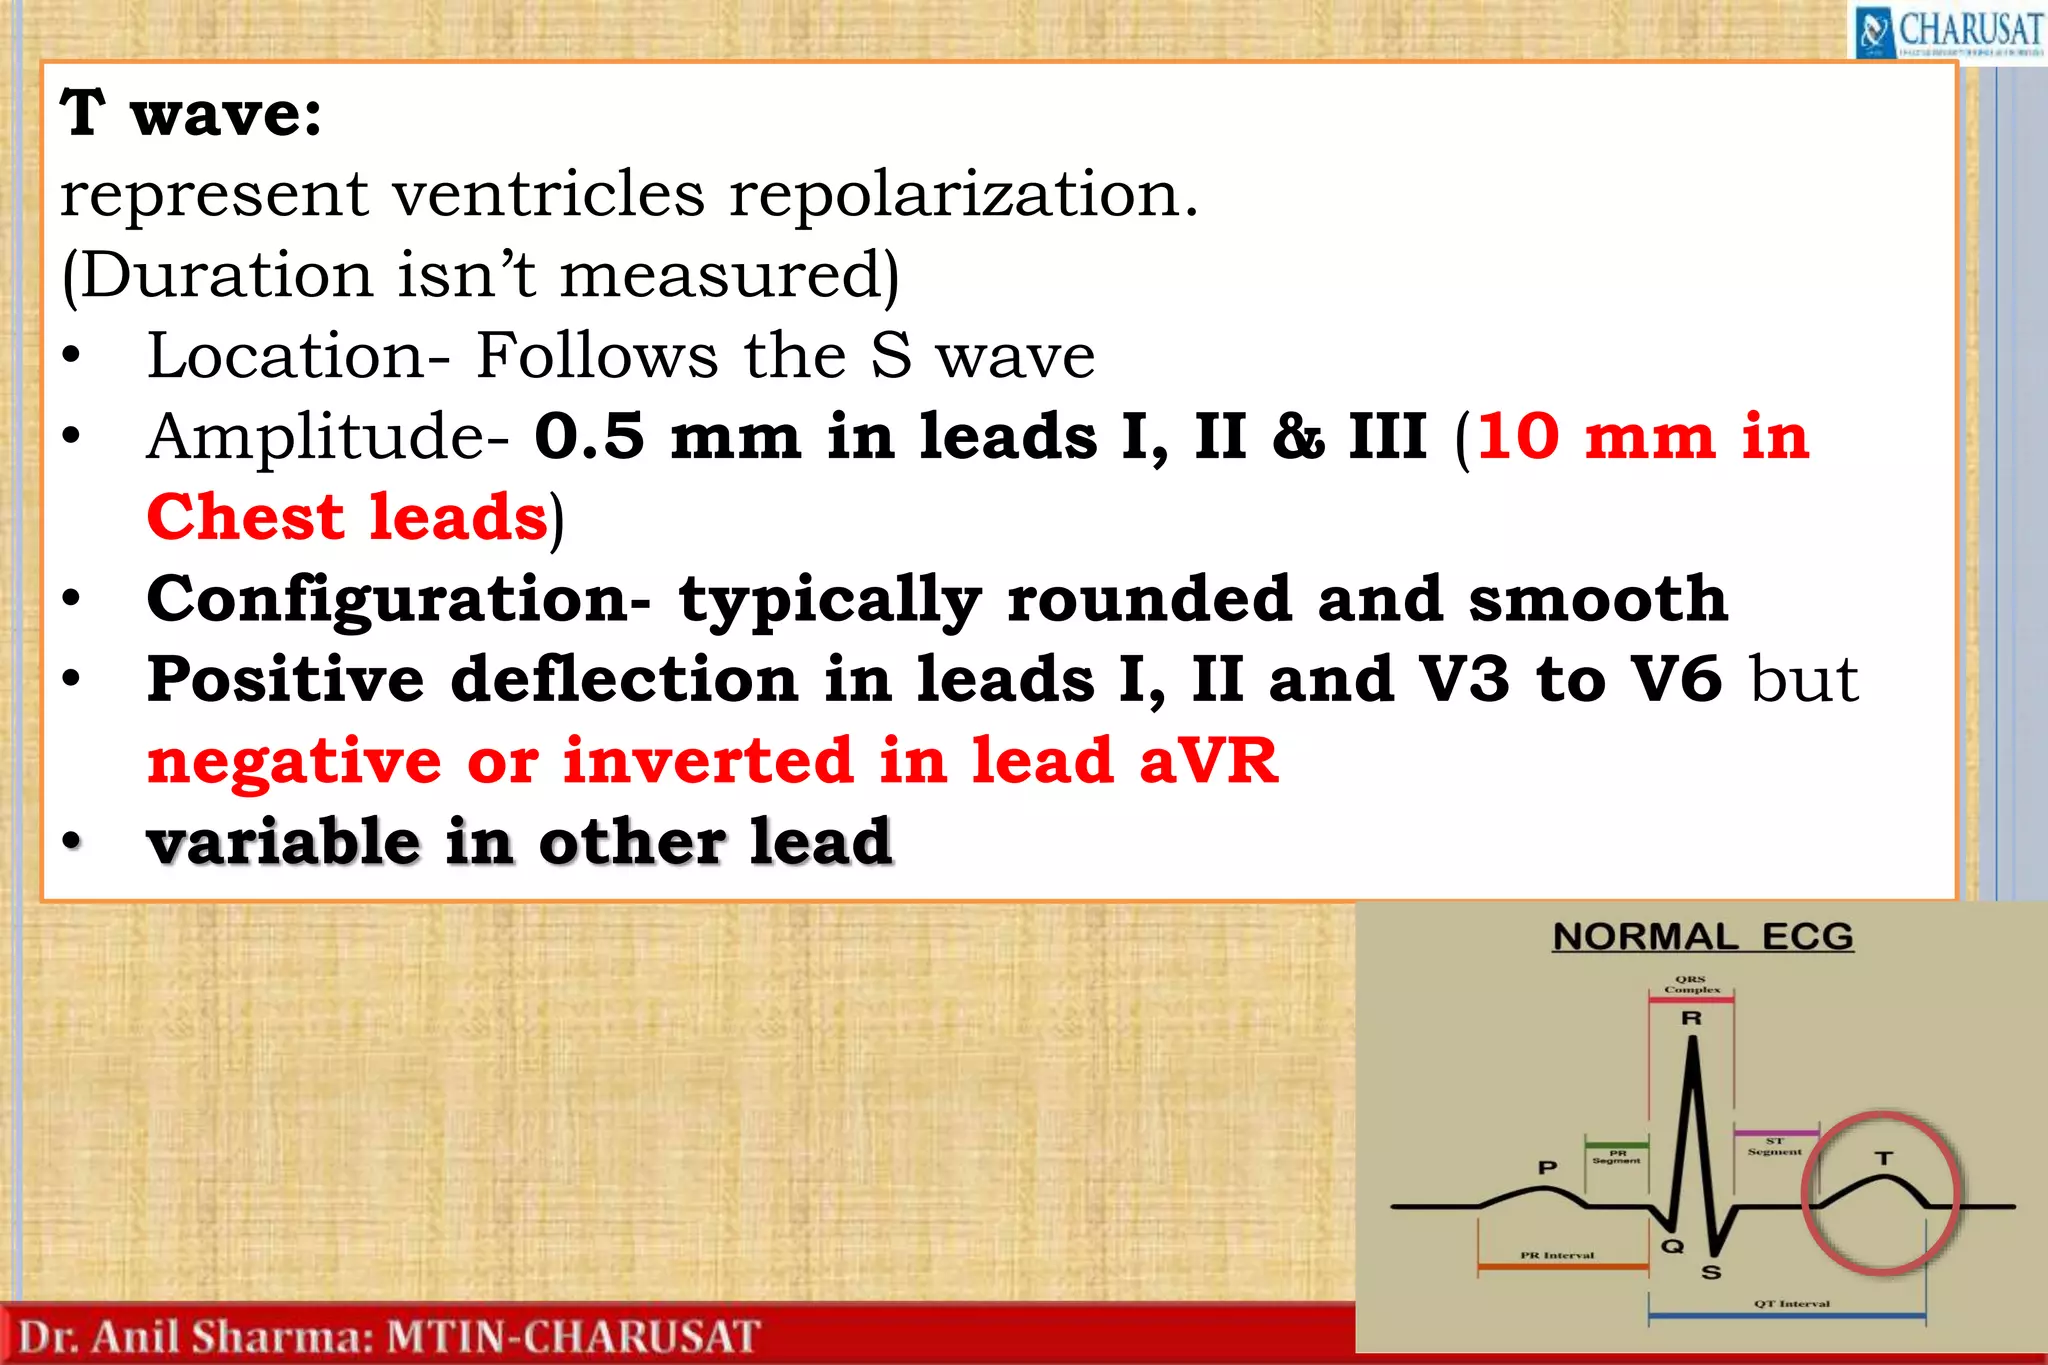
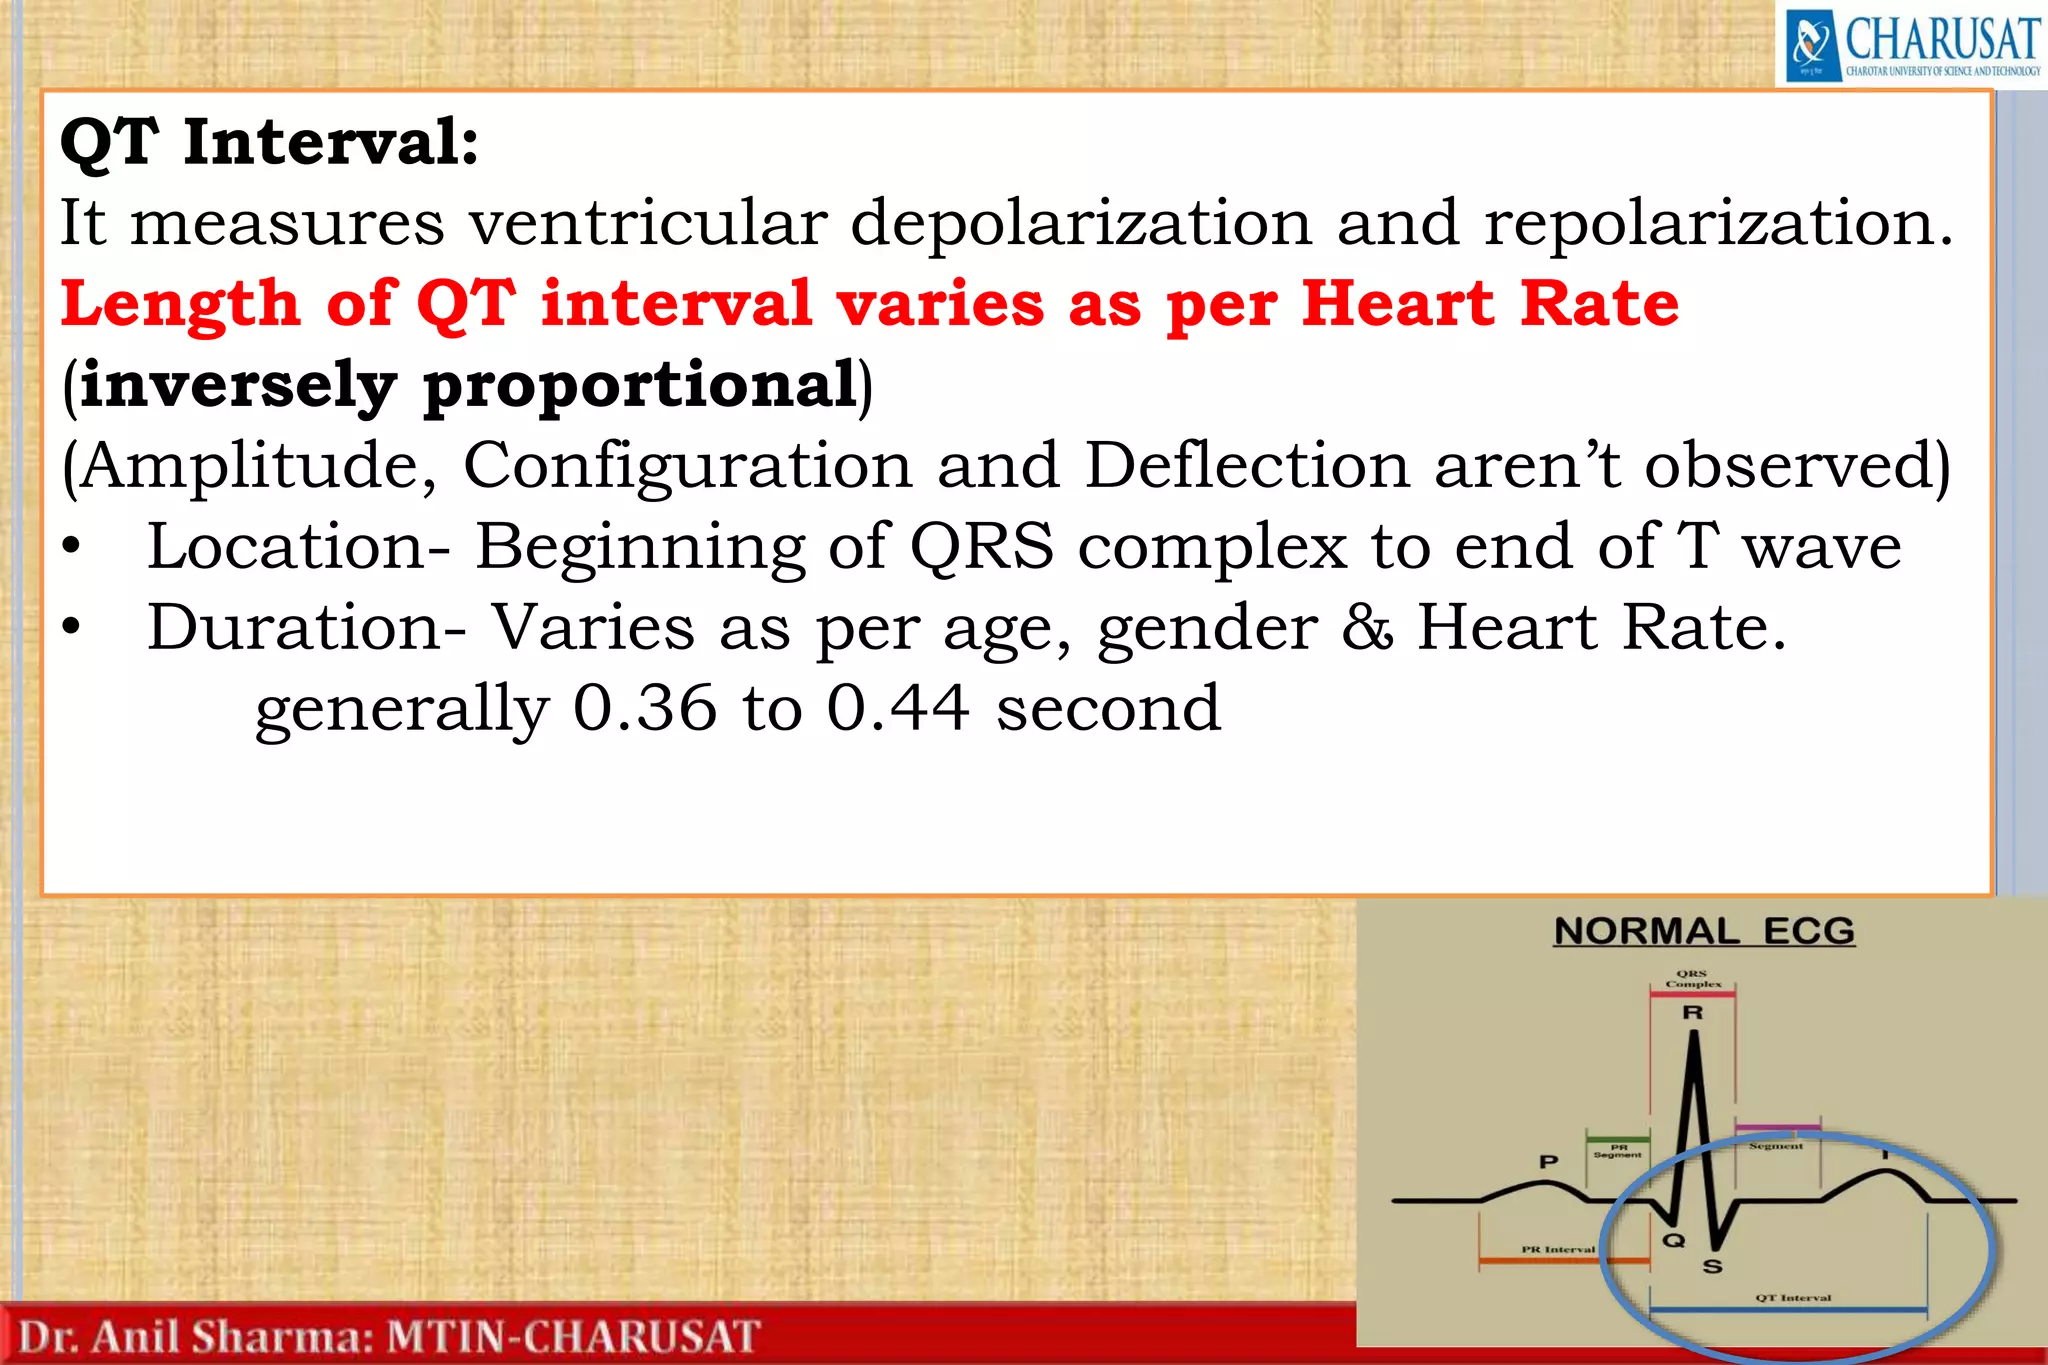
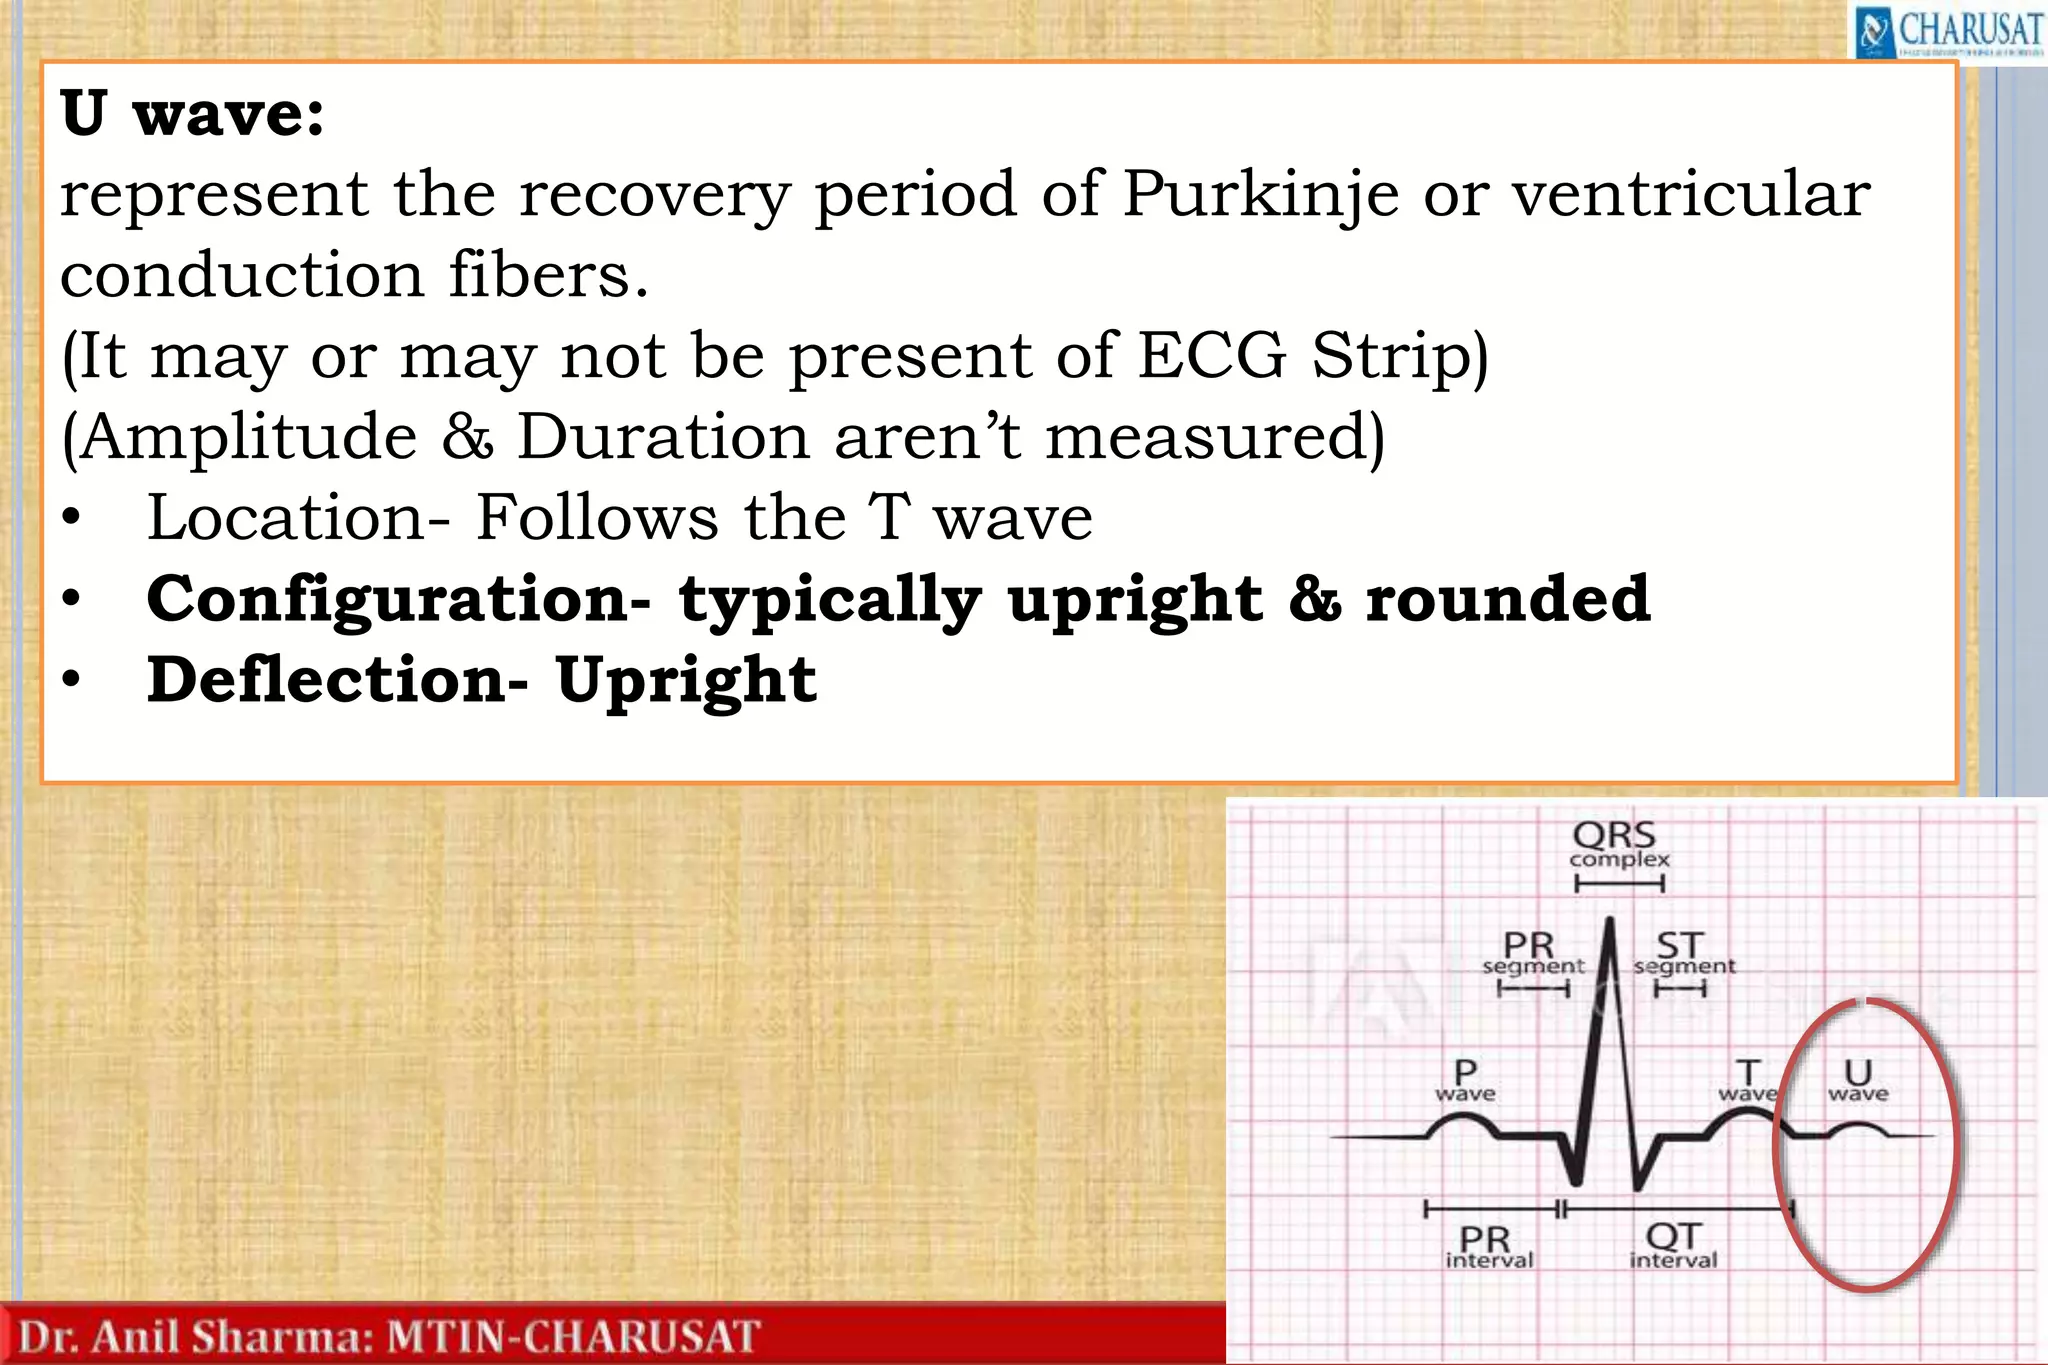
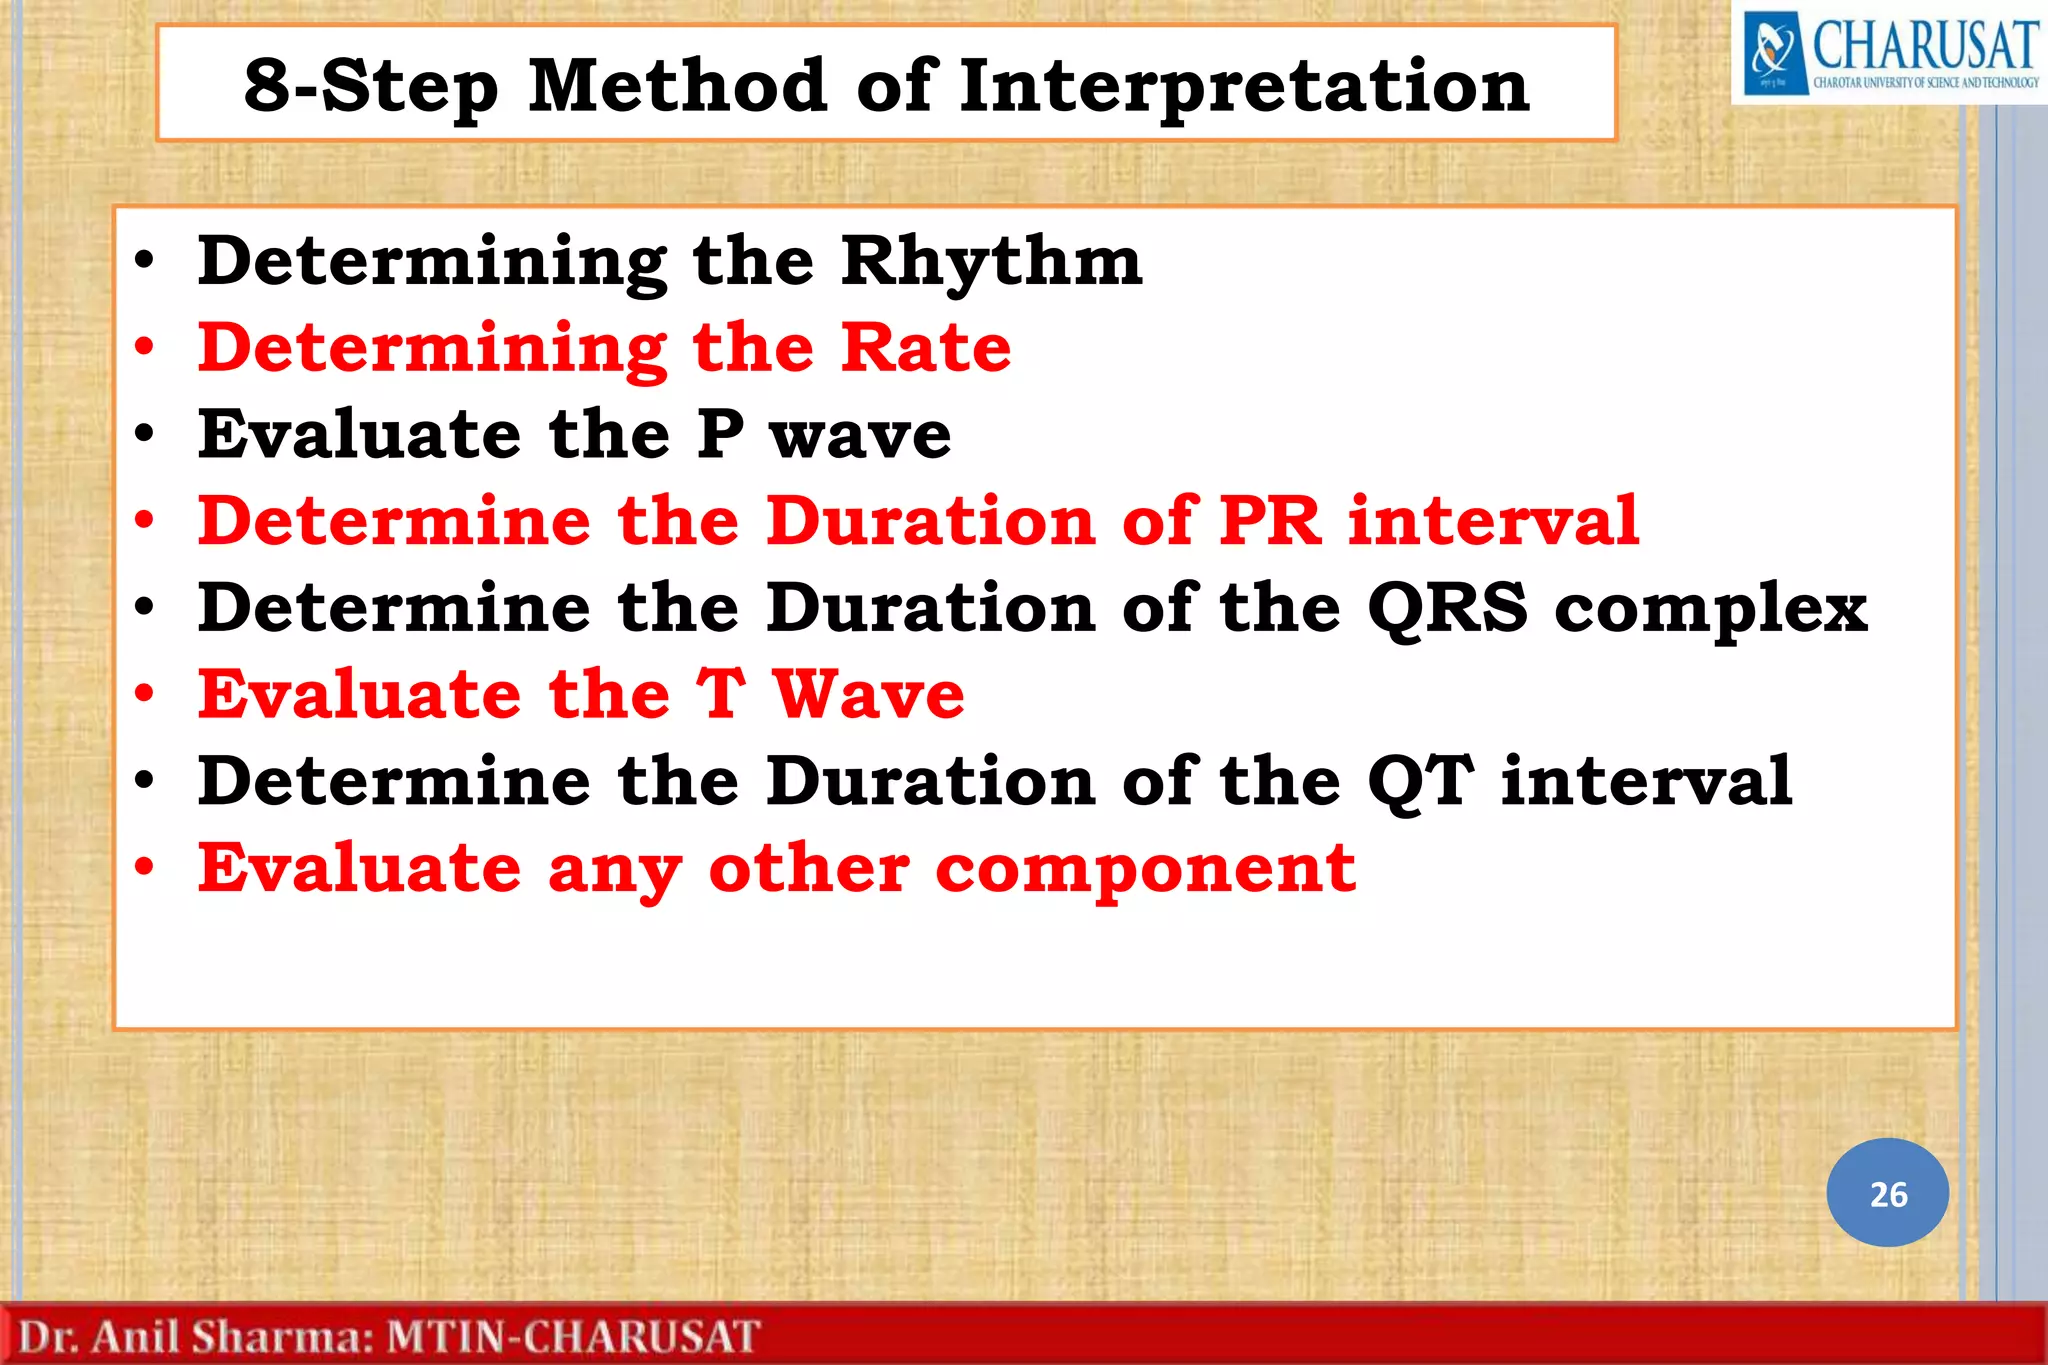
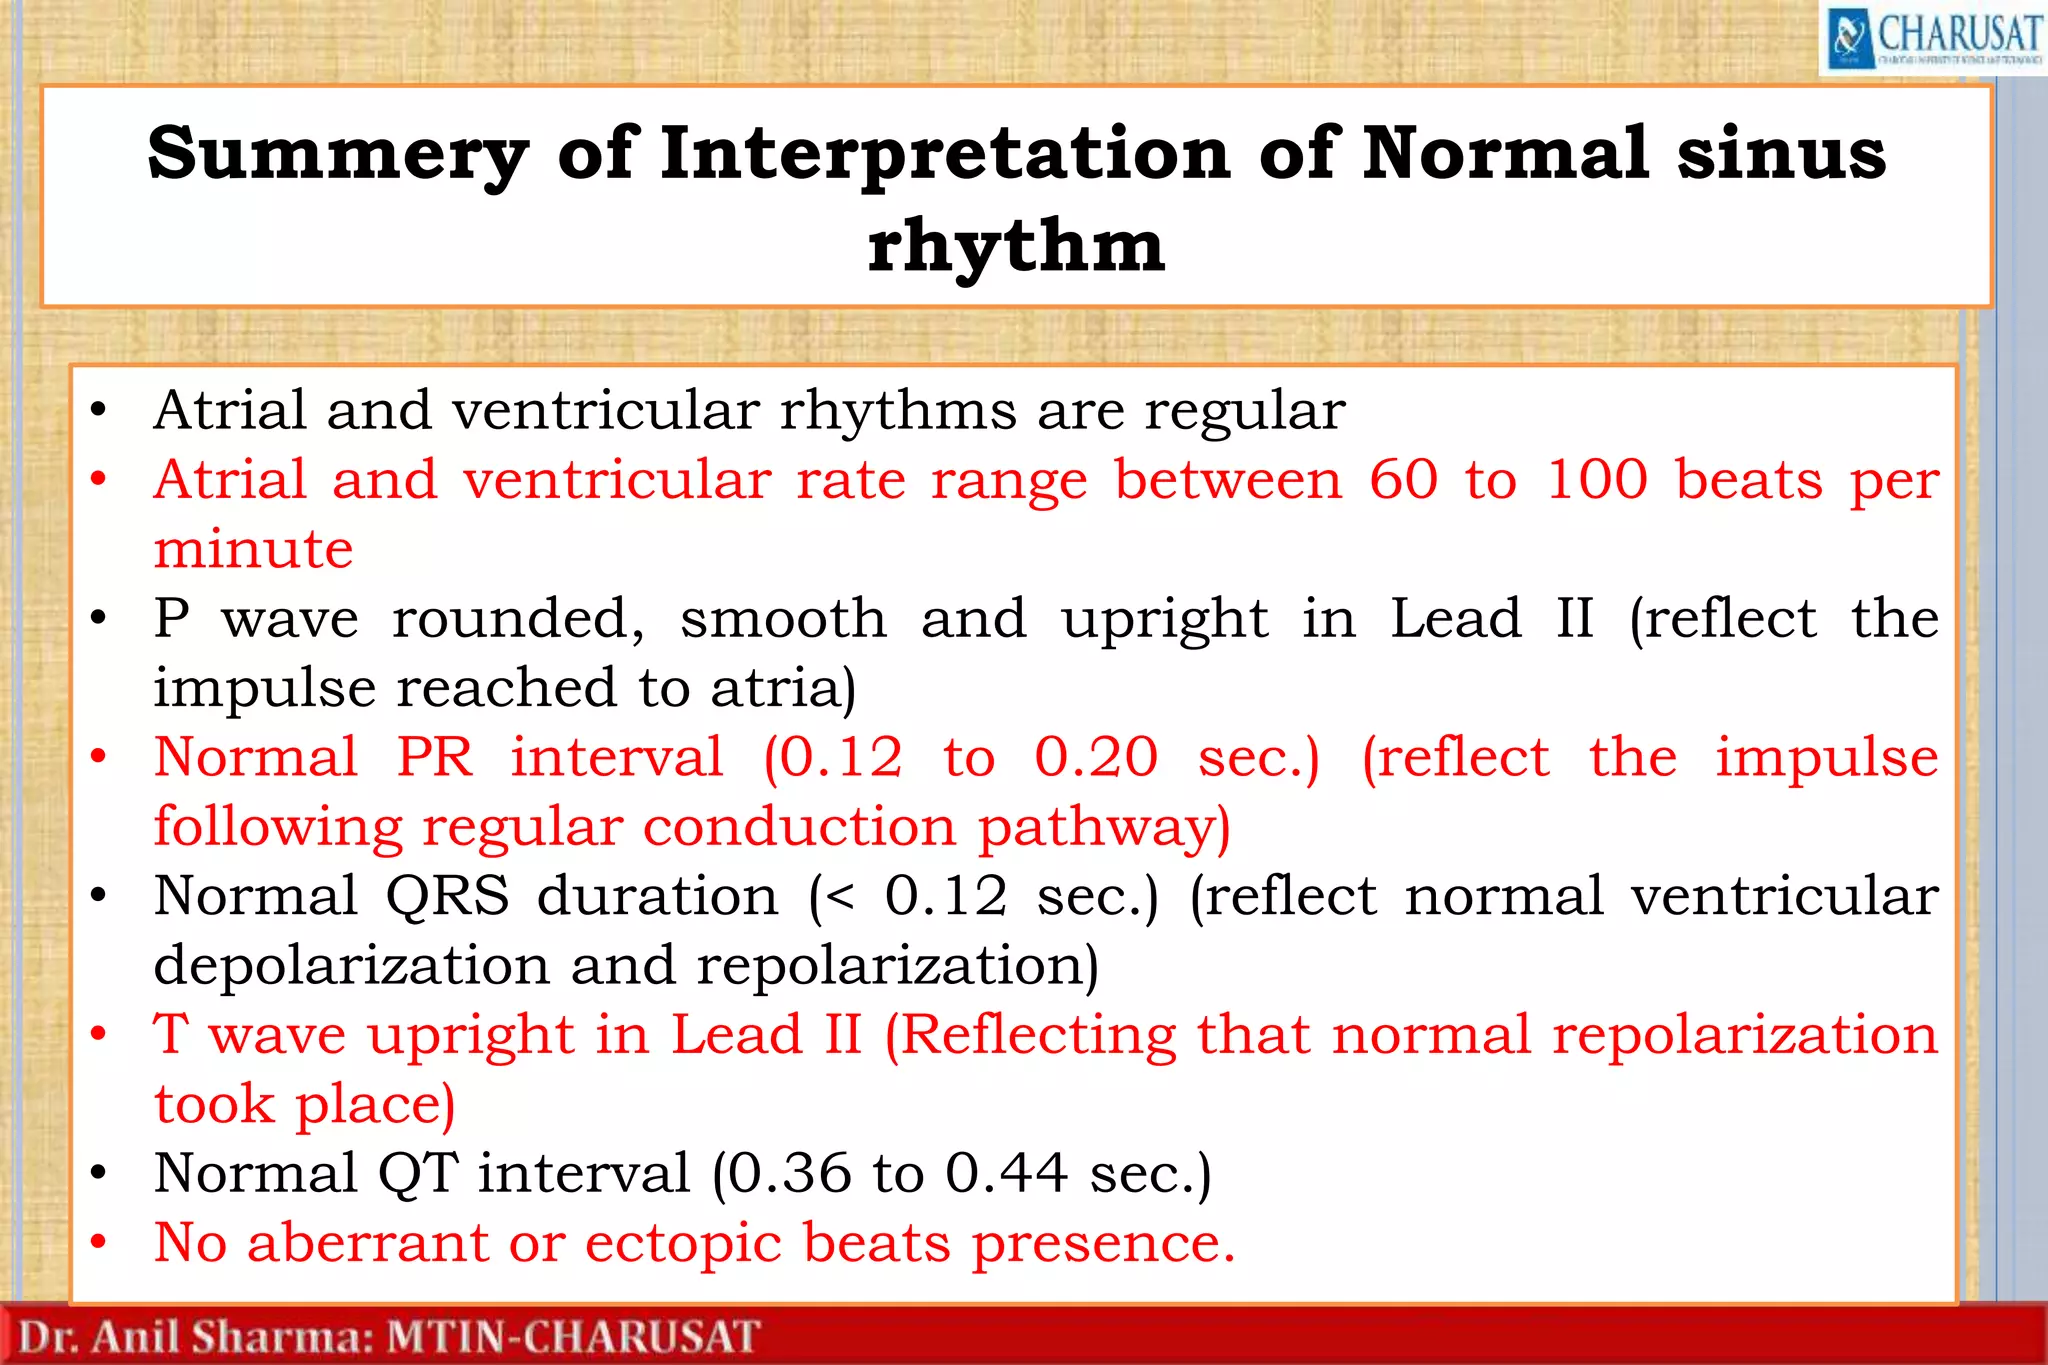
THE BASICS OF ECG INTERPRETATION
Dr. Anil Sharma, PhD(N)
Principal, Manikaka
Topawala Institute of
Nursing-CHARUSAT,
Changa
Accredited Grade “A” with
NAAC
1
Flow of Presentation
 Quick Recapping of Cardiac Anatomy &
Physiology.
 Learning 12 Lead ECG and understanding
rhythm strips
 Understanding interpretation of ECG in
terms of:
 Significance and variation
 Calculating rate and rhythm
 Step-by-step approach for interpretation
2
• Heart Chambers
• Heart valves
• Blood flow
• Cardiac cycle dynamics (cardiac output, stroke
volume, preload, afterload, contractility)
• Conduction system (SA, AV node, bundle of His,
bundle branches, Purkinje fibers)
• Innervation of the Heart (ANS-Sympathetic &
Parasympathetic)
3
Cardiac Anatomy & Physiology
ECG (ElectroCardioGram/ElectroCardioGraphy):
Graphical record of electrical potentials produced
during heartbeat.
Or
Graphical representation of heart’s electrical activity
in waveforms
Process:
Heart electrical activity Produce Currents
Radiate to skin via surrounding tissues
The electrodes sense these current and transmit as
ECG 4
• Current then transformed into waveform &
represent the heart’s depolarization and
repolarization cycle.
• ECG shows precise sequence of electrical
events occurring in each cardiac cycle.
5
Pre-requisite to interpret ECG:
• Leads & Planes: During ECG recording the
waveforms which carries information of current
from different perspectives, that known as leads
and Plans.
6
• Lead: it provide a view of the heart’s electrical
activity between one positive and one negative
pole.
• Between the two poles a imaginary line
represent the lead axis (Direction of the
current movement)
7
8
Plane: It reflect cross-sectional perspective of the
heart’s electrical activity.
 Frontal Plane:
 Horizontal plane:
• Frontal Plane: Six limb leads (I, II, III, aVR, aVL, and
aVF)
• Horizontal plane: Six Chest leads (V1 to V6) 9
12-Lead ECG
• It give 12 different views of the heart.
• These views obtained through electrodes which placed at
limb and chest.
1. Six Limb Leads: Lead I, II & III are Bipolar (require –ve
and +ve electrode for monitoring) and Augmented vector
Right (aVR), Augmented vector Left (aVL ), Augmented vector
Foot (aVF) are Unipolar as information collect from one lead
2. Six Precordial or V leads: These are Unipolar leads
known as V1,V2,V3,V4,V5 & V6.
10
11
12
Lead Characteristic
I Reflect current moving right to left (-ve to +ve): positive
deflection (Arterial rhythms)
II +ve electrode on left leg and –ve on right arm: positive
deflection (Sinus Node)
III +ve electrode on left leg and –ve on left arm: positive
deflection
13
Lead Characteristic
aVR
+ve electrode on right arm and produce negative deflection
(current moves away from the lead)
aVL
+ve electrode on left arm and produce positive deflection
aVF
+ve electrode on left leg and positive deflection
14
Lead Characteristic
V1 Placed right side of sternum at 4th intercostal rib space
V2 Placed at left of the sternum at the 4th intercostal rib space
V3 Placed between V2 & V4
V4 Placed at 5th intercostal space at midclavicular line
V5 Placed at 5th intercostal space at anterior axillary line
(produce positive deflection)
V6 Placed with level of V4 at the midaxillary line.
(produce positive deflection)
15
Lead representation of heart
16
I
Lateral
aVR
V1
Septal
V4
Anterior
II
Inferior
aVL
Lateral
V2
Septal
V5
Lateral
III
Inferior
aVF
Inferior
V3
Anterior
V6
Lateral
ECG Strip
• It is a piece of paper used to record ECG.
• ECG paper consist of horizontal and vertical
lines forming a grid.
• Horizontal axis represent time.
• Small block-0.04 second
• 5 small block create one large block-.2 second
• 5 large block- 1 second
• Vertical axis represent amplitude in millimeters
(mm) or electrical voltage in millivolts (mV).
• Small block-1 mm or 0.1 mV
• Large block- 5 mm or 0.5 mV
17
Interpreting A Rhythm Strip
18
19
P wave:
represent arterial depolarization.
• Location- Precedes the QRS complex
• Amplitude- 2 to 3 mm high
• Duration- 0.06 to 0.12 second
• Configuration-usually rounded and upright
• Positive deflection in leads I, II, aVF and V2 to V6
but variable in lead III & aVL & V1. Also negative
or inverted in lead aVR
20
PR Interval:
It track atrial impulse from atria via AV node, bundle of
His and right & left bundle branches.
(Amplitude, Configuration and Deflection aren’t
measured)
• Location- Beginning of P wave to beginning of QRS
complex
• Duration- 0.12 to 0.20 second
21
QRS Complex:
represent ventricles depolarization.
• Location- follows the PR interval
• Amplitude- 5 to 30 mm high but differ for each lead
• Duration- 0.06 to 0.10 second (Half of PR interval)
• Configuration- Q wave- First negative deflection,
• R wave- First Positive deflection after p wave
• S wave- First negative deflection after R wave
• Positive deflection in leads I, II, III, aVL, aVF and
V4 to V6 and negative in lead aVR & V1 to V3
22
ST Segment:
represent end of ventricles depolarization and the
beginning of ventricles repolarization.
(Amplitude, Duration and Configuration aren’t
measured)
• Location- extend from the S wave to the beginning of
T wave
• Deflection- Isoelectric (neither positive nor
negative)
• Vary from -0.5 to +1 mm in some chest leads
23
T wave:
represent ventricles repolarization.
(Duration isn’t measured)
• Location- Follows the S wave
• Amplitude- 0.5 mm in leads I, II & III (10 mm in
Chest leads)
• Configuration- typically rounded and smooth
• Positive deflection in leads I, II and V3 to V6 but
negative or inverted in lead aVR
• variable in other lead
24
QT Interval:
It measures ventricular depolarization and repolarization.
Length of QT interval varies as per Heart Rate
(inversely proportional)
(Amplitude, Configuration and Deflection aren’t observed)
• Location- Beginning of QRS complex to end of T wave
• Duration- Varies as per age, gender & Heart Rate.
generally 0.36 to 0.44 second
25
U wave:
represent the recovery period of Purkinje or ventricular
conduction fibers.
(It may or may not be present of ECG Strip)
(Amplitude & Duration aren’t measured)
• Location- Follows the T wave
• Configuration- typically upright & rounded
• Deflection- Upright
26
8-Step Method of Interpretation
• Determining the Rhythm
• Determining the Rate
• Evaluate the P wave
• Determine the Duration of PR interval
• Determine the Duration of the QRS complex
• Evaluate the T Wave
• Determine the Duration of the QT interval
• Evaluate any other component
27
Step-1: Determining the Rhythm
• Use paper pencil method
• For atrial rhythm measure P-P interval (If regular
then interpret it as regular atrial rhythm)
• For ventricular rhythm measure R-R interval (If
regular then interpret it as regular ventricular
rhythm)
28
Step-2: Determining the Rate
• 10-times method – consider as easiest method
(Especially when rhythm is irregular)
• To obtain Ventricular rate- count the number of R
waves that appear within 10 second period and
multiply by 6.
• Ten 6-second strip will represent one minute
• Atrial rate can be identified by using P wave
29
Step-3: Evaluate the P wave
Can we interpret by answering following points:
• Presence of P wave.
• Match it with normal configuration.
• Do all have similar size and shape?
• Is these each QRS complex has one P wave or not?
30
Step-4: Determine the Duration of PR interval
First Measure it by counting small squares between
the start of P wave and start of QRS complex and
then multiply the number of squares by 0.04 seconds
Example: 5 small squares fall then multiply it with
0.04 (5×.04= .20 second)
Can we interpret by answering following points:
• Is the duration of it is 0.12 to 0.20 Second ?
• Is it constant ?
31
Step-5: Determine the Duration of the QRS complex
First Measure it by counting small squares between
Beginning and end of QRS complex and multiply the
number of squares by 0.04 seconds
Example: 3 small squares fall then multiply it with
0.04 (3×.04= .12 second)
Can we interpret by answering following points:
• Is the duration is normal 0.06 to 0.10 Second ?
• Are all QRS complexes the same size and shape ?
• Does it appear after every P wave ?
32
Step-6: Evaluate the T Wave
Can we interpret by answering following points:
• Presence of T wave
• Do all T wave are in normal shape?
• Do they all have normal and same amplitude?
33
Step-7: Determine the Duration of the QT interval
First Measure it by counting small squares between
Beginning of QRS complex and the end of T wave and
multiply the number of squares by 0.04 seconds
Example: 10 small squares fall then multiply it with
0.04 (10×.04= .40 second)
Can we interpret by answering following points:
• Is the duration is normal 0.36 to 0.44 Second ?
• Are all QRS complexes the same size and shape ?
• Does it appear after every P wave ?
34
Step-8: Evaluate any other component
we can evaluate other parameters by noting ECG strip,
such as:
• Presence of U wave
• Origin of the rhythm
• Rate characteristic
• Rhythm abnormalities
35
Summery of Interpretation of Normal sinus
rhythm
• Atrial and ventricular rhythms are regular
• Atrial and ventricular rate range between 60 to 100 beats per
minute
• P wave rounded, smooth and upright in Lead II (reflect the
impulse reached to atria)
• Normal PR interval (0.12 to 0.20 sec.) (reflect the impulse
following regular conduction pathway)
• Normal QRS duration (< 0.12 sec.) (reflect normal ventricular
depolarization and repolarization)
• T wave upright in Lead II (Reflecting that normal repolarization
took place)
• Normal QT interval (0.36 to 0.44 sec.)
• No aberrant or ectopic beats presence.
36
37
Selected References:
• Coviello, Jessica Shank (2016). ECG Interpretation Made Incredibly Easy
(6rd Ed.). Lippincott Williams & Wilkins
• Patricia A. Potter, A. Stockert et al (2014). Fundamentals of nursing (2nd
ed.). South Asian edition. Elsevier.
• Janice L.N., & Kerry H.C. (2014). Textbook of Medical-surgical nursing
volume-1 (13th ed.). South Asian Edition: Wolters Kluwer Health
• Weber J. & Kelley,J. (2010) health assessment in nursing (4th ed.).
Lippincott Williams & Wilkins
Thank You
38

Basic of ecg interpretation

  • 1.
    THE BASICS OFECG INTERPRETATION Dr. Anil Sharma, PhD(N) Principal, Manikaka Topawala Institute of Nursing-CHARUSAT, Changa Accredited Grade “A” with NAAC 1
  • 2.
    Flow of Presentation Quick Recapping of Cardiac Anatomy & Physiology.  Learning 12 Lead ECG and understanding rhythm strips  Understanding interpretation of ECG in terms of:  Significance and variation  Calculating rate and rhythm  Step-by-step approach for interpretation 2
  • 3.
    • Heart Chambers •Heart valves • Blood flow • Cardiac cycle dynamics (cardiac output, stroke volume, preload, afterload, contractility) • Conduction system (SA, AV node, bundle of His, bundle branches, Purkinje fibers) • Innervation of the Heart (ANS-Sympathetic & Parasympathetic) 3 Cardiac Anatomy & Physiology
  • 4.
    ECG (ElectroCardioGram/ElectroCardioGraphy): Graphical recordof electrical potentials produced during heartbeat. Or Graphical representation of heart’s electrical activity in waveforms Process: Heart electrical activity Produce Currents Radiate to skin via surrounding tissues The electrodes sense these current and transmit as ECG 4
  • 5.
    • Current thentransformed into waveform & represent the heart’s depolarization and repolarization cycle. • ECG shows precise sequence of electrical events occurring in each cardiac cycle. 5
  • 6.
    Pre-requisite to interpretECG: • Leads & Planes: During ECG recording the waveforms which carries information of current from different perspectives, that known as leads and Plans. 6
  • 7.
    • Lead: itprovide a view of the heart’s electrical activity between one positive and one negative pole. • Between the two poles a imaginary line represent the lead axis (Direction of the current movement) 7
  • 8.
  • 9.
    Plane: It reflectcross-sectional perspective of the heart’s electrical activity.  Frontal Plane:  Horizontal plane: • Frontal Plane: Six limb leads (I, II, III, aVR, aVL, and aVF) • Horizontal plane: Six Chest leads (V1 to V6) 9
  • 10.
    12-Lead ECG • Itgive 12 different views of the heart. • These views obtained through electrodes which placed at limb and chest. 1. Six Limb Leads: Lead I, II & III are Bipolar (require –ve and +ve electrode for monitoring) and Augmented vector Right (aVR), Augmented vector Left (aVL ), Augmented vector Foot (aVF) are Unipolar as information collect from one lead 2. Six Precordial or V leads: These are Unipolar leads known as V1,V2,V3,V4,V5 & V6. 10
  • 11.
  • 12.
    12 Lead Characteristic I Reflectcurrent moving right to left (-ve to +ve): positive deflection (Arterial rhythms) II +ve electrode on left leg and –ve on right arm: positive deflection (Sinus Node) III +ve electrode on left leg and –ve on left arm: positive deflection
  • 13.
    13 Lead Characteristic aVR +ve electrodeon right arm and produce negative deflection (current moves away from the lead) aVL +ve electrode on left arm and produce positive deflection aVF +ve electrode on left leg and positive deflection
  • 14.
    14 Lead Characteristic V1 Placedright side of sternum at 4th intercostal rib space V2 Placed at left of the sternum at the 4th intercostal rib space V3 Placed between V2 & V4 V4 Placed at 5th intercostal space at midclavicular line V5 Placed at 5th intercostal space at anterior axillary line (produce positive deflection) V6 Placed with level of V4 at the midaxillary line. (produce positive deflection)
  • 15.
  • 16.
    Lead representation ofheart 16 I Lateral aVR V1 Septal V4 Anterior II Inferior aVL Lateral V2 Septal V5 Lateral III Inferior aVF Inferior V3 Anterior V6 Lateral
  • 17.
    ECG Strip • Itis a piece of paper used to record ECG. • ECG paper consist of horizontal and vertical lines forming a grid. • Horizontal axis represent time. • Small block-0.04 second • 5 small block create one large block-.2 second • 5 large block- 1 second • Vertical axis represent amplitude in millimeters (mm) or electrical voltage in millivolts (mV). • Small block-1 mm or 0.1 mV • Large block- 5 mm or 0.5 mV 17
  • 18.
  • 19.
    19 P wave: represent arterialdepolarization. • Location- Precedes the QRS complex • Amplitude- 2 to 3 mm high • Duration- 0.06 to 0.12 second • Configuration-usually rounded and upright • Positive deflection in leads I, II, aVF and V2 to V6 but variable in lead III & aVL & V1. Also negative or inverted in lead aVR
  • 20.
    20 PR Interval: It trackatrial impulse from atria via AV node, bundle of His and right & left bundle branches. (Amplitude, Configuration and Deflection aren’t measured) • Location- Beginning of P wave to beginning of QRS complex • Duration- 0.12 to 0.20 second
  • 21.
    21 QRS Complex: represent ventriclesdepolarization. • Location- follows the PR interval • Amplitude- 5 to 30 mm high but differ for each lead • Duration- 0.06 to 0.10 second (Half of PR interval) • Configuration- Q wave- First negative deflection, • R wave- First Positive deflection after p wave • S wave- First negative deflection after R wave • Positive deflection in leads I, II, III, aVL, aVF and V4 to V6 and negative in lead aVR & V1 to V3
  • 22.
    22 ST Segment: represent endof ventricles depolarization and the beginning of ventricles repolarization. (Amplitude, Duration and Configuration aren’t measured) • Location- extend from the S wave to the beginning of T wave • Deflection- Isoelectric (neither positive nor negative) • Vary from -0.5 to +1 mm in some chest leads
  • 23.
    23 T wave: represent ventriclesrepolarization. (Duration isn’t measured) • Location- Follows the S wave • Amplitude- 0.5 mm in leads I, II & III (10 mm in Chest leads) • Configuration- typically rounded and smooth • Positive deflection in leads I, II and V3 to V6 but negative or inverted in lead aVR • variable in other lead
  • 24.
    24 QT Interval: It measuresventricular depolarization and repolarization. Length of QT interval varies as per Heart Rate (inversely proportional) (Amplitude, Configuration and Deflection aren’t observed) • Location- Beginning of QRS complex to end of T wave • Duration- Varies as per age, gender & Heart Rate. generally 0.36 to 0.44 second
  • 25.
    25 U wave: represent therecovery period of Purkinje or ventricular conduction fibers. (It may or may not be present of ECG Strip) (Amplitude & Duration aren’t measured) • Location- Follows the T wave • Configuration- typically upright & rounded • Deflection- Upright
  • 26.
    26 8-Step Method ofInterpretation • Determining the Rhythm • Determining the Rate • Evaluate the P wave • Determine the Duration of PR interval • Determine the Duration of the QRS complex • Evaluate the T Wave • Determine the Duration of the QT interval • Evaluate any other component
  • 27.
    27 Step-1: Determining theRhythm • Use paper pencil method • For atrial rhythm measure P-P interval (If regular then interpret it as regular atrial rhythm) • For ventricular rhythm measure R-R interval (If regular then interpret it as regular ventricular rhythm)
  • 28.
    28 Step-2: Determining theRate • 10-times method – consider as easiest method (Especially when rhythm is irregular) • To obtain Ventricular rate- count the number of R waves that appear within 10 second period and multiply by 6. • Ten 6-second strip will represent one minute • Atrial rate can be identified by using P wave
  • 29.
    29 Step-3: Evaluate theP wave Can we interpret by answering following points: • Presence of P wave. • Match it with normal configuration. • Do all have similar size and shape? • Is these each QRS complex has one P wave or not?
  • 30.
    30 Step-4: Determine theDuration of PR interval First Measure it by counting small squares between the start of P wave and start of QRS complex and then multiply the number of squares by 0.04 seconds Example: 5 small squares fall then multiply it with 0.04 (5×.04= .20 second) Can we interpret by answering following points: • Is the duration of it is 0.12 to 0.20 Second ? • Is it constant ?
  • 31.
    31 Step-5: Determine theDuration of the QRS complex First Measure it by counting small squares between Beginning and end of QRS complex and multiply the number of squares by 0.04 seconds Example: 3 small squares fall then multiply it with 0.04 (3×.04= .12 second) Can we interpret by answering following points: • Is the duration is normal 0.06 to 0.10 Second ? • Are all QRS complexes the same size and shape ? • Does it appear after every P wave ?
  • 32.
    32 Step-6: Evaluate theT Wave Can we interpret by answering following points: • Presence of T wave • Do all T wave are in normal shape? • Do they all have normal and same amplitude?
  • 33.
    33 Step-7: Determine theDuration of the QT interval First Measure it by counting small squares between Beginning of QRS complex and the end of T wave and multiply the number of squares by 0.04 seconds Example: 10 small squares fall then multiply it with 0.04 (10×.04= .40 second) Can we interpret by answering following points: • Is the duration is normal 0.36 to 0.44 Second ? • Are all QRS complexes the same size and shape ? • Does it appear after every P wave ?
  • 34.
    34 Step-8: Evaluate anyother component we can evaluate other parameters by noting ECG strip, such as: • Presence of U wave • Origin of the rhythm • Rate characteristic • Rhythm abnormalities
  • 35.
    35 Summery of Interpretationof Normal sinus rhythm • Atrial and ventricular rhythms are regular • Atrial and ventricular rate range between 60 to 100 beats per minute • P wave rounded, smooth and upright in Lead II (reflect the impulse reached to atria) • Normal PR interval (0.12 to 0.20 sec.) (reflect the impulse following regular conduction pathway) • Normal QRS duration (< 0.12 sec.) (reflect normal ventricular depolarization and repolarization) • T wave upright in Lead II (Reflecting that normal repolarization took place) • Normal QT interval (0.36 to 0.44 sec.) • No aberrant or ectopic beats presence.
  • 36.
  • 37.
    37 Selected References: • Coviello,Jessica Shank (2016). ECG Interpretation Made Incredibly Easy (6rd Ed.). Lippincott Williams & Wilkins • Patricia A. Potter, A. Stockert et al (2014). Fundamentals of nursing (2nd ed.). South Asian edition. Elsevier. • Janice L.N., & Kerry H.C. (2014). Textbook of Medical-surgical nursing volume-1 (13th ed.). South Asian Edition: Wolters Kluwer Health • Weber J. & Kelley,J. (2010) health assessment in nursing (4th ed.). Lippincott Williams & Wilkins
  • 38.