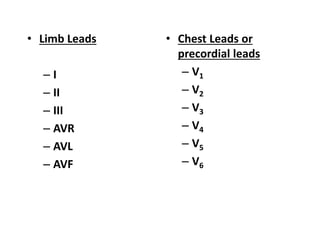
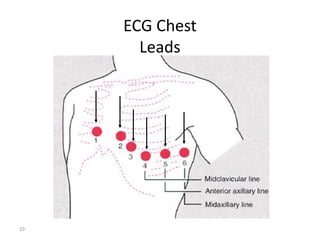
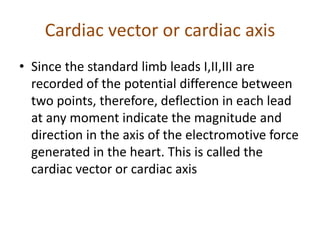
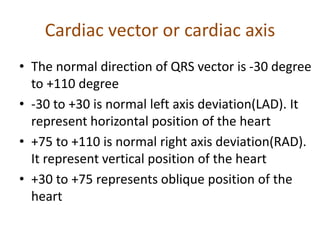
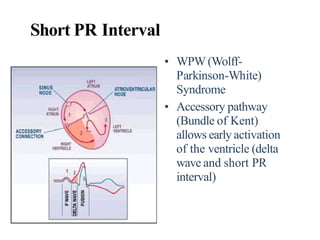
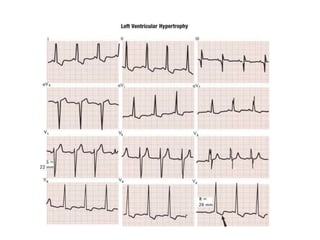
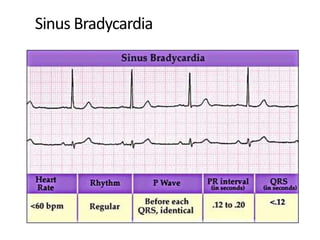
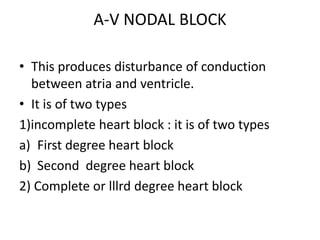
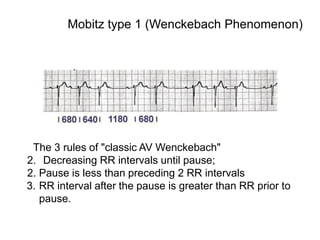
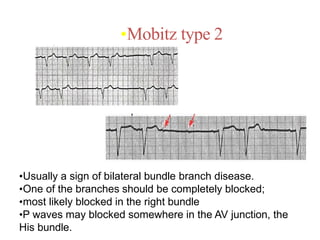
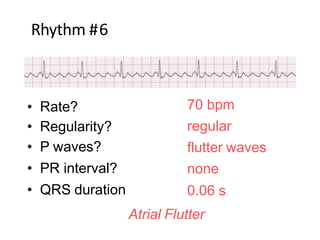
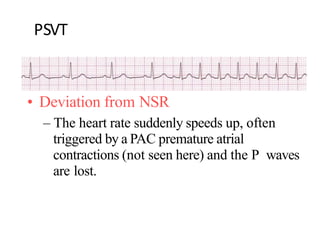
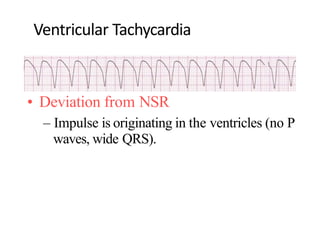
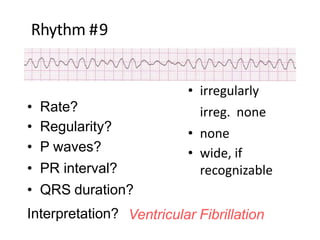
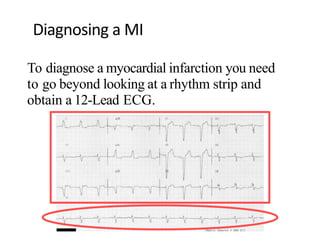
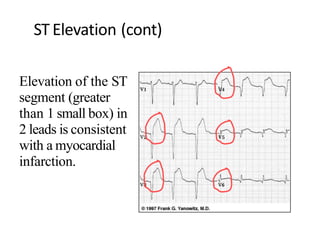
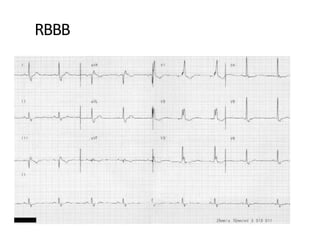
E.C. G.- 2
DR. MANISHA GUPTA
PROF. & HOD
PHYSIOLOGY
2
Let us Identify the
waves
1
2
3
4
5
6
7
8
• Standard ECG is recorded in 12 leads
• Six Limb leads – L1, L2, L3, aVR, aVL, aVF
• L1, L2 and L3 are called bipolar leads
• L1 between LA and RA
• L2 between LF and RA
• L3 between LF and LA
• aVR, aVL, aVF are called unipolar leads
• aVR – from Right Arm Positive
• aVL – from Left Arm Positive
• aVF – from Left Foot Positive
• Six Chest Leads – V1 V2 V3 V4 V5 and V6
ECG Bipolar Limb Leads
• Limb Leads
– I
– II
– III
– AVR
– AVL
– AVF
• Chest Leads or
precordial leads
– V1
– V2
– V3
– V4
– V5
– V6
+
+ +
- - -
ECG Bipolar Limb Leads
R L
F
R
F
L
Einthoven's triangle
• Einthoven's triangle is an imaginary formation
of three limb leads in a triangle used in
electrocardiography, formed by the two
shoulders and the pubis. The shape forms an
inverted equilateral triangle with the heart at
the center with current source that produces
zero potential at the end points of an
equilateral triangle when the voltages are
summed.
Einthoven's law
• The sum of potentials in lead I and lead
III equals to the potential in lead II
II  = I + III.
ECG Augmented Limb Leads
10
ECG Chest
Leads
Precardial (chest) Lead Position
• V1 Fourth ICS, right sternal border
• V2 Fourth ICS, left sternal border
• V3 Equidistant between V2 and V4
• V4 Fifth ICS, left Mid clavicular
Line
• V5 Fifth ICS Left anterior axillary
line
• V6 Fifth ICS Left mid axillary line
ECG Chest
Leads
Precordial Leads
Precordial Leads
ECG Precordial Leads
Cardiac vector or cardiac axis
• Since the standard limb leads I,II,III are
recorded of the potential difference between
two points, therefore, deflection in each lead
at any moment indicate the magnitude and
direction in the axis of the electromotive force
generated in the heart. This is called the
cardiac vector or cardiac axis
Cardiac vector or cardiac axis
• The electrical axis of the heart is plotted
using the average QRS deflection in any
two classical limb leads. This is called
mean QRS vector
• the average QRS deflection is the
distance equal to the height of ‘R’ wave
minus the height of the largest negative
deflection in the QRS complex
Determining the Axis
Predominantly
Positive
Predominantly
Negative
Equiphasic
Cardiac vector or cardiac axis
• The normal direction of QRS vector is -30 degree
to +110 degree
• -30 to +30 is normal left axis deviation(LAD). It
represent horizontal position of the heart
• +75 to +110 is normal right axis deviation(RAD).
It represent vertical position of the heart
• +30 to +75 represents oblique position of the
heart
Cardiac vector or cardiac axis
• If the calculated axis falls to the left of -30 or to
the right of +110, then it is considered to left or
right axis deviation.
• The following conditions in which cardiac axis
becomes abnormal are:
Abnormal RAD:
Right bundle branch block
Right ventricular hypertrophy
Posterior or inferior myocardial infarction (MI)
Cardiac vector or cardiac axis
Abnormal LAD:
Left bundle branch block
Left ventricular hypertrophy
Anterio- lateral MI
Mean QRS Axis Calculation
Lead II
Short PR Interval
• WPW (Wolff-
Parkinson-White)
Syndrome
• Accessory pathway
(Bundle of Kent)
allows early activation
of the ventricle (delta
wave and short PR
interval)
Long PR Interval
• First degree Heart Block
QRS in LVH & RVH
Conditions with Tall R in V1
Left Ventricular Hypertrophy
• Sokolow &Lyon Criteria
• Sin V1+ R in V5 or V6 > 35 mm
• An R wave of 11 to 13 mm (1.1 to 1.3 mV)
or more in lead aVL is another sign of
LVH
ST Segment
• ST Segment is flat (isoelectric)
• Elevation or depression of ST segment by 1
mm or more
• “J” (Junction) point is the point between
QRS and ST segment
Variable Shapes Of ST Segment
Elevations in AMI
Goldberger AL. Goldberger: Clinical Electrocardiography:ASimplifiedApproach. 7th
ed: Mosby Elsevier; 2006.
QT interval
1. Total duration of Depolarization and
Repolarization
2. QT interval decreases when heart rate increases
3. For HR = 70 bpm, QT<0.40 sec.
4. QT interval should be 0.35 0.45 s,
5. Should not be more than half of the interval
between adjacent R waves (RR interval).
QT Interval
U wave
• U wave related to afterdepolarizations which
follow repolarization
• U waves are small, round, symmetrical and
positive in lead II, with amplitude < 2 mm
• U wave direction is the same as T wave
• More prominent at slow heart rates
Classification
• Sinus Bradycardia
• Junctional Rhythm
• SinoAtrial Block
• Atrioventricular block
Sinus Bradycardia
Junctional Rhythm
SinoAtrial Block
• Initially whole heart beat is lost after an
interval of approx. two cardiac cycle, the heart
resumes its normal action as some new pace
maker other than SAN takes over
A-V NODAL BLOCK
• This produces disturbance of conduction
between atria and ventricle.
• It is of two types
1)incomplete heart block : it is of two types
a) First degree heart block
b) Second degree heart block
2) Complete or lllrd degree heart block
Complete or lllrd degree heart block
• It is due to complete interruption of
conduction between atria and ventricles.
Therefore ventricles beat with a slower rate
(45beats) and independent of rhythm of SAN
called as idio-ventricular rhythm.
Stokes adam syndrome
First Degree AV Block
• Delay in the conduction through the conducting
system
• Prolong P-R interval
• All P waves are followed by QRS
• Associated with :AC Rheumati Carditis, Digitalis,
Beta Blocker, excessive vagal tone, ischemia,
intrinsic disease in the AVjunction or bundle
branch system.
Second Degree AV Block
• Intermittent failure of AV conduction
• Impulse blocked byAV node
• Types:
• Mobitz type 1 (Wenckebach Phenomenon)
• Mobitz type 2
The 3 rules of "classic AV Wenckebach"
2. Decreasing RR intervals until pause;
2. Pause is less than preceding 2 RR intervals
3. RR interval after the pause is greater than RR prior to
pause.
Mobitz type 1 (Wenckebach Phenomenon)
Mobitz type 1 (Wenckebach
Phenomenon)
•Mobitz type 2
•Usually a sign of bilateral bundle branch disease.
•One of the branches should be completely blocked;
•most likely blocked in the right bundle
•P waves may blocked somewhere in the AV junction, the
His bundle.
Third Degree Heart Block
•CHB evidenced by the AV dissociation
•A junctional escape rhythm at 45 bpm.
•The PP intervals vary because of ventriculophasic sinus arrhythmia;
Third Degree Heart Block
3rd degree AV block with a left ventricular escape
rhythm, 'B' the right ventricular pacemaker rhythm is
shown.
Rhythm #6
70 bpm
regular
flutter waves
none
0.06 s
• Rate?
• Regularity?
• P waves?
• PR interval?
• QRS duration?
Interpretation? Atrial Flutter
PSVT
• Deviation from NSR
– The heart rate suddenly speeds up, often
triggered by a PAC premature atrial
contractions (not seen here) and the P waves
are lost.
Ventricular Arrhythmias
• Ventricular Tachycardia
• Ventricular Fibrillation
Rhythm #8
160 bpm
regular
none
none
wide (> 0.12 sec)
• Rate?
• Regularity?
• P waves?
• PR interval?
• QRS duration?
Interpretation? Ventricular Tachycardia
Ventricular Tachycardia
• Deviation from NSR
– Impulse is originating in the ventricles (no P
waves, wide QRS).
Rhythm #9
• none
• irregularly
irreg. none
• none
• wide, if
recognizable
• Rate?
• Regularity?
• P waves?
• PR interval?
• QRS duration?
Interpretation? Ventricular Fibrillation
Ventricular Fibrillation
• Deviation from NSR
– Completely abnormal.
Diagnosing a MI
To diagnose a myocardial infarction you need
to go beyond looking at a rhythm strip and
obtain a 12-Lead ECG.
Rhythm
Strip
12-Lead
ECG
ST Elevation
One wayto
diagnose an
acute MI is to
look for
elevation of the
ST segment.
STElevation (cont)
Elevation of the ST
segment (greater
than 1 small box) in
2 leads is consistent
with a myocardial
infarction.
Bundle Branch Blocks
Normal Impulse Conduction
Sinoatrial node
AV node
Bundle of His
Bundle Branches
Purkinje fibers
Bundle Branch Blocks
So, conduction in the
Bundle Branches and
Purkinje fibers are seen
as the QRS complex on
the ECG.
Therefore, a conduction
block of the Bundle
Branches would be
reflected as a change in
the QRS complex.
Right
BBB
Bundle Branch Blocks
With Bundle Branch Blocks you will see two changes
on the ECG.
– QRS complex widens (> 0.12sec).
– QRS morphology changes (varies depending on ECG lead,
and if it is a right vs. left bundle branch block).
Right Bundle Branch Blocks
What QRS morphology is characteristic?
For RBBB the wide QRS complex assumes a
unique, virtually diagnostic shape in those
leads overlying the right ventricle (V1 and V2).
V1
“Rabbit Ears”
RBBB
Left Bundle Branch Blocks
What QRS morphology is characteristic?
For LBBB the wide QRS complex assumes a
characteristic change in shape in those leads
opposite the left ventricle (right ventricular
leads - V1 and V2).
Broad,
deep S
waves
Normal
THANKYOU

ECG-2 RAMA.pptx

  • 1.
    E.C. G.- 2 DR.MANISHA GUPTA PROF. & HOD PHYSIOLOGY
  • 2.
    2 Let us Identifythe waves 1 2 3 4 5 6 7 8
  • 3.
    • Standard ECGis recorded in 12 leads • Six Limb leads – L1, L2, L3, aVR, aVL, aVF • L1, L2 and L3 are called bipolar leads • L1 between LA and RA • L2 between LF and RA • L3 between LF and LA • aVR, aVL, aVF are called unipolar leads • aVR – from Right Arm Positive • aVL – from Left Arm Positive • aVF – from Left Foot Positive • Six Chest Leads – V1 V2 V3 V4 V5 and V6 ECG Bipolar Limb Leads
  • 4.
    • Limb Leads –I – II – III – AVR – AVL – AVF • Chest Leads or precordial leads – V1 – V2 – V3 – V4 – V5 – V6
  • 5.
    + + + - -- ECG Bipolar Limb Leads R L F R F L
  • 6.
    Einthoven's triangle • Einthoven'striangle is an imaginary formation of three limb leads in a triangle used in electrocardiography, formed by the two shoulders and the pubis. The shape forms an inverted equilateral triangle with the heart at the center with current source that produces zero potential at the end points of an equilateral triangle when the voltages are summed.
  • 8.
    Einthoven's law • Thesum of potentials in lead I and lead III equals to the potential in lead II II  = I + III.
  • 9.
  • 10.
  • 11.
    Precardial (chest) LeadPosition • V1 Fourth ICS, right sternal border • V2 Fourth ICS, left sternal border • V3 Equidistant between V2 and V4 • V4 Fifth ICS, left Mid clavicular Line • V5 Fifth ICS Left anterior axillary line • V6 Fifth ICS Left mid axillary line ECG Chest Leads
  • 12.
  • 13.
  • 14.
  • 16.
    Cardiac vector orcardiac axis • Since the standard limb leads I,II,III are recorded of the potential difference between two points, therefore, deflection in each lead at any moment indicate the magnitude and direction in the axis of the electromotive force generated in the heart. This is called the cardiac vector or cardiac axis
  • 18.
    Cardiac vector orcardiac axis • The electrical axis of the heart is plotted using the average QRS deflection in any two classical limb leads. This is called mean QRS vector • the average QRS deflection is the distance equal to the height of ‘R’ wave minus the height of the largest negative deflection in the QRS complex
  • 19.
  • 20.
    Cardiac vector orcardiac axis • The normal direction of QRS vector is -30 degree to +110 degree • -30 to +30 is normal left axis deviation(LAD). It represent horizontal position of the heart • +75 to +110 is normal right axis deviation(RAD). It represent vertical position of the heart • +30 to +75 represents oblique position of the heart
  • 21.
    Cardiac vector orcardiac axis • If the calculated axis falls to the left of -30 or to the right of +110, then it is considered to left or right axis deviation. • The following conditions in which cardiac axis becomes abnormal are: Abnormal RAD: Right bundle branch block Right ventricular hypertrophy Posterior or inferior myocardial infarction (MI)
  • 22.
    Cardiac vector orcardiac axis Abnormal LAD: Left bundle branch block Left ventricular hypertrophy Anterio- lateral MI
  • 23.
    Mean QRS AxisCalculation Lead II
  • 24.
    Short PR Interval •WPW (Wolff- Parkinson-White) Syndrome • Accessory pathway (Bundle of Kent) allows early activation of the ventricle (delta wave and short PR interval)
  • 25.
    Long PR Interval •First degree Heart Block
  • 26.
  • 27.
  • 28.
    Left Ventricular Hypertrophy •Sokolow &Lyon Criteria • Sin V1+ R in V5 or V6 > 35 mm • An R wave of 11 to 13 mm (1.1 to 1.3 mV) or more in lead aVL is another sign of LVH
  • 30.
    ST Segment • STSegment is flat (isoelectric) • Elevation or depression of ST segment by 1 mm or more • “J” (Junction) point is the point between QRS and ST segment
  • 31.
    Variable Shapes OfST Segment Elevations in AMI Goldberger AL. Goldberger: Clinical Electrocardiography:ASimplifiedApproach. 7th ed: Mosby Elsevier; 2006.
  • 32.
    QT interval 1. Totalduration of Depolarization and Repolarization 2. QT interval decreases when heart rate increases 3. For HR = 70 bpm, QT<0.40 sec. 4. QT interval should be 0.35 0.45 s, 5. Should not be more than half of the interval between adjacent R waves (RR interval).
  • 33.
  • 34.
    U wave • Uwave related to afterdepolarizations which follow repolarization • U waves are small, round, symmetrical and positive in lead II, with amplitude < 2 mm • U wave direction is the same as T wave • More prominent at slow heart rates
  • 35.
    Classification • Sinus Bradycardia •Junctional Rhythm • SinoAtrial Block • Atrioventricular block
  • 36.
  • 37.
  • 38.
    SinoAtrial Block • Initiallywhole heart beat is lost after an interval of approx. two cardiac cycle, the heart resumes its normal action as some new pace maker other than SAN takes over
  • 39.
    A-V NODAL BLOCK •This produces disturbance of conduction between atria and ventricle. • It is of two types 1)incomplete heart block : it is of two types a) First degree heart block b) Second degree heart block 2) Complete or lllrd degree heart block
  • 40.
    Complete or lllrddegree heart block • It is due to complete interruption of conduction between atria and ventricles. Therefore ventricles beat with a slower rate (45beats) and independent of rhythm of SAN called as idio-ventricular rhythm.
  • 41.
  • 42.
    First Degree AVBlock • Delay in the conduction through the conducting system • Prolong P-R interval • All P waves are followed by QRS • Associated with :AC Rheumati Carditis, Digitalis, Beta Blocker, excessive vagal tone, ischemia, intrinsic disease in the AVjunction or bundle branch system.
  • 43.
    Second Degree AVBlock • Intermittent failure of AV conduction • Impulse blocked byAV node • Types: • Mobitz type 1 (Wenckebach Phenomenon) • Mobitz type 2
  • 44.
    The 3 rulesof "classic AV Wenckebach" 2. Decreasing RR intervals until pause; 2. Pause is less than preceding 2 RR intervals 3. RR interval after the pause is greater than RR prior to pause. Mobitz type 1 (Wenckebach Phenomenon)
  • 45.
    Mobitz type 1(Wenckebach Phenomenon)
  • 46.
    •Mobitz type 2 •Usuallya sign of bilateral bundle branch disease. •One of the branches should be completely blocked; •most likely blocked in the right bundle •P waves may blocked somewhere in the AV junction, the His bundle.
  • 47.
    Third Degree HeartBlock •CHB evidenced by the AV dissociation •A junctional escape rhythm at 45 bpm. •The PP intervals vary because of ventriculophasic sinus arrhythmia;
  • 48.
    Third Degree HeartBlock 3rd degree AV block with a left ventricular escape rhythm, 'B' the right ventricular pacemaker rhythm is shown.
  • 49.
    Rhythm #6 70 bpm regular flutterwaves none 0.06 s • Rate? • Regularity? • P waves? • PR interval? • QRS duration? Interpretation? Atrial Flutter
  • 50.
    PSVT • Deviation fromNSR – The heart rate suddenly speeds up, often triggered by a PAC premature atrial contractions (not seen here) and the P waves are lost.
  • 51.
    Ventricular Arrhythmias • VentricularTachycardia • Ventricular Fibrillation
  • 52.
    Rhythm #8 160 bpm regular none none wide(> 0.12 sec) • Rate? • Regularity? • P waves? • PR interval? • QRS duration? Interpretation? Ventricular Tachycardia
  • 53.
    Ventricular Tachycardia • Deviationfrom NSR – Impulse is originating in the ventricles (no P waves, wide QRS).
  • 54.
    Rhythm #9 • none •irregularly irreg. none • none • wide, if recognizable • Rate? • Regularity? • P waves? • PR interval? • QRS duration? Interpretation? Ventricular Fibrillation
  • 55.
    Ventricular Fibrillation • Deviationfrom NSR – Completely abnormal.
  • 56.
    Diagnosing a MI Todiagnose a myocardial infarction you need to go beyond looking at a rhythm strip and obtain a 12-Lead ECG. Rhythm Strip 12-Lead ECG
  • 57.
    ST Elevation One wayto diagnosean acute MI is to look for elevation of the ST segment.
  • 58.
    STElevation (cont) Elevation ofthe ST segment (greater than 1 small box) in 2 leads is consistent with a myocardial infarction.
  • 59.
  • 60.
    Normal Impulse Conduction Sinoatrialnode AV node Bundle of His Bundle Branches Purkinje fibers
  • 61.
    Bundle Branch Blocks So,conduction in the Bundle Branches and Purkinje fibers are seen as the QRS complex on the ECG. Therefore, a conduction block of the Bundle Branches would be reflected as a change in the QRS complex. Right BBB
  • 62.
    Bundle Branch Blocks WithBundle Branch Blocks you will see two changes on the ECG. – QRS complex widens (> 0.12sec). – QRS morphology changes (varies depending on ECG lead, and if it is a right vs. left bundle branch block).
  • 63.
    Right Bundle BranchBlocks What QRS morphology is characteristic? For RBBB the wide QRS complex assumes a unique, virtually diagnostic shape in those leads overlying the right ventricle (V1 and V2). V1 “Rabbit Ears”
  • 64.
  • 65.
    Left Bundle BranchBlocks What QRS morphology is characteristic? For LBBB the wide QRS complex assumes a characteristic change in shape in those leads opposite the left ventricle (right ventricular leads - V1 and V2). Broad, deep S waves Normal
  • 68.