Downloaded 191 times


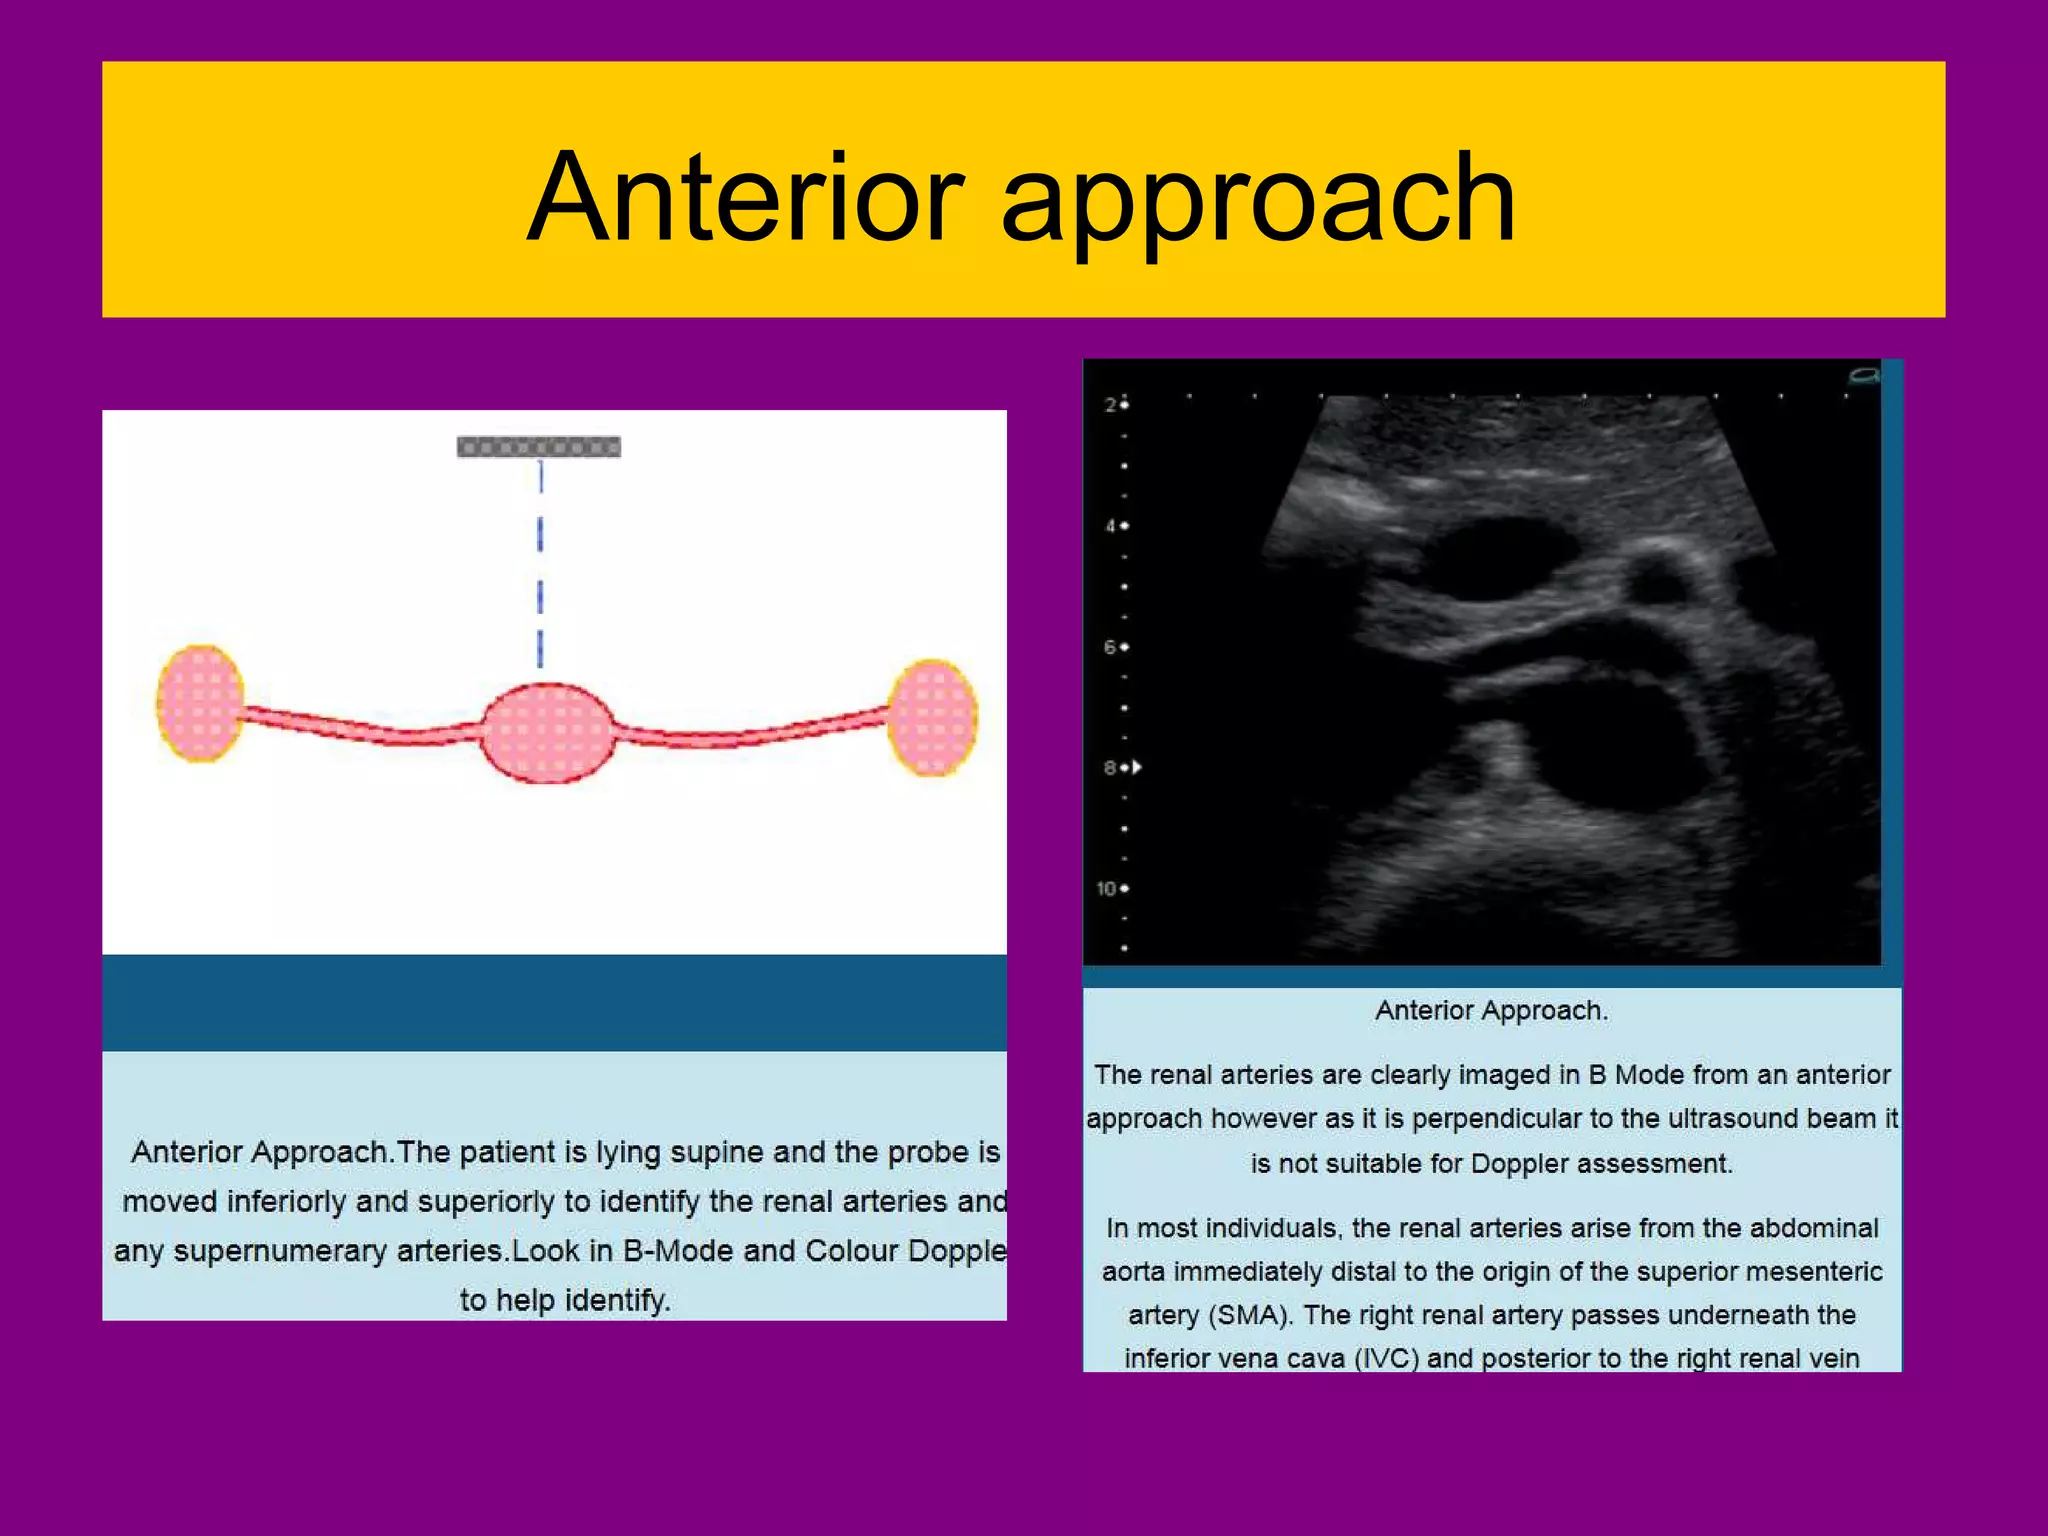


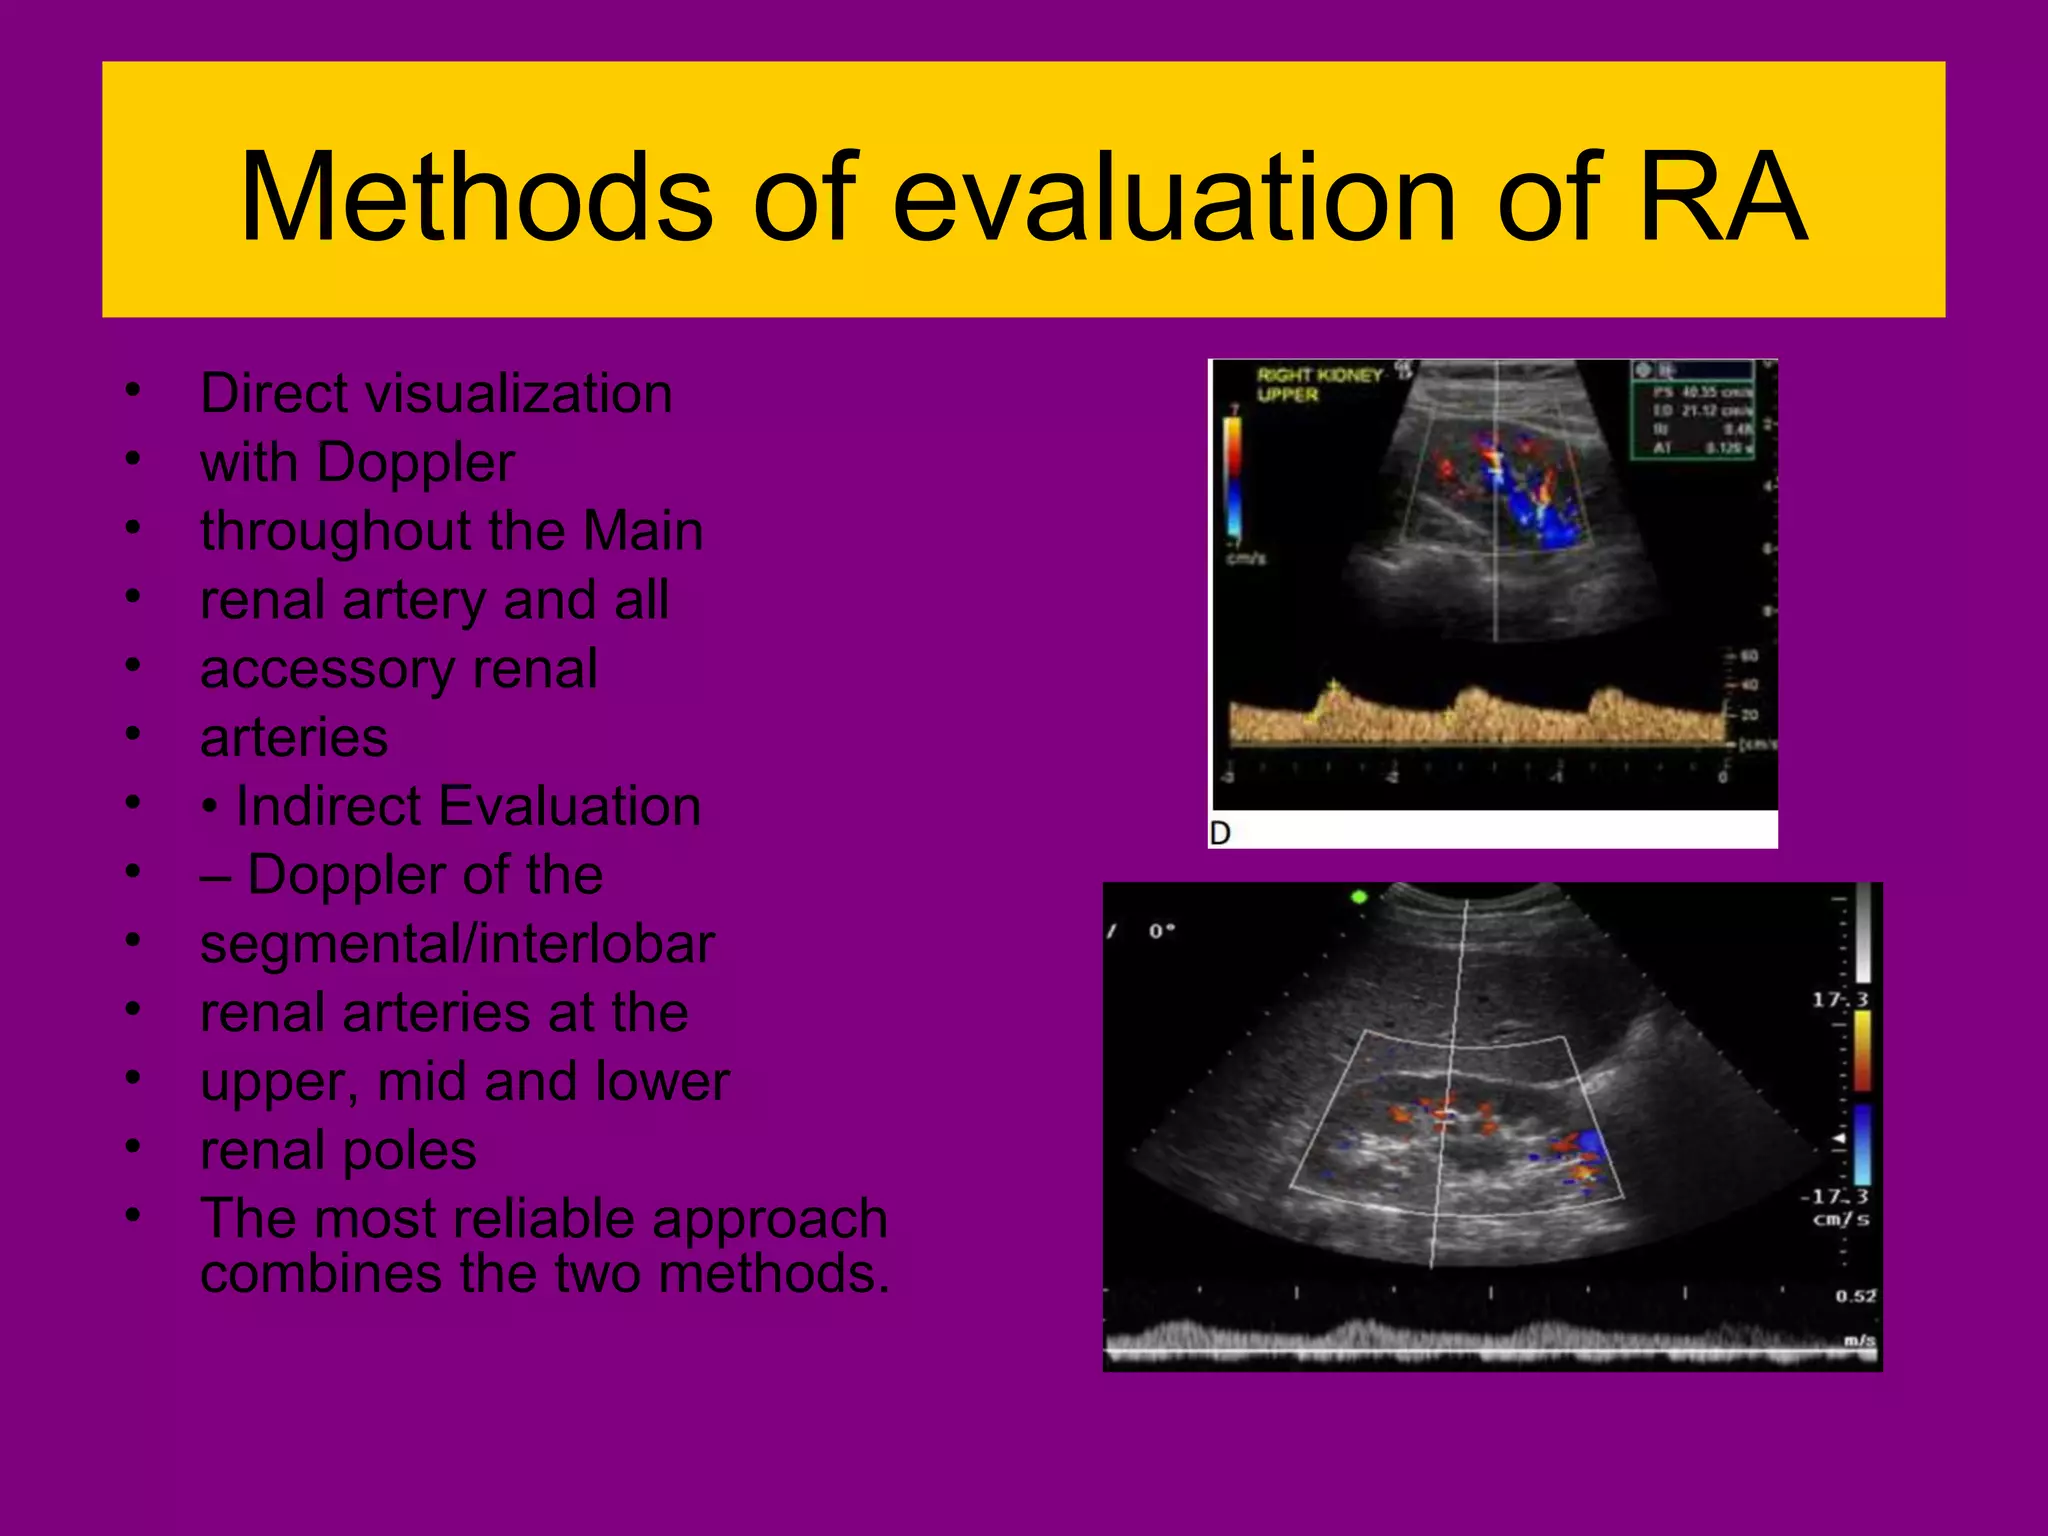


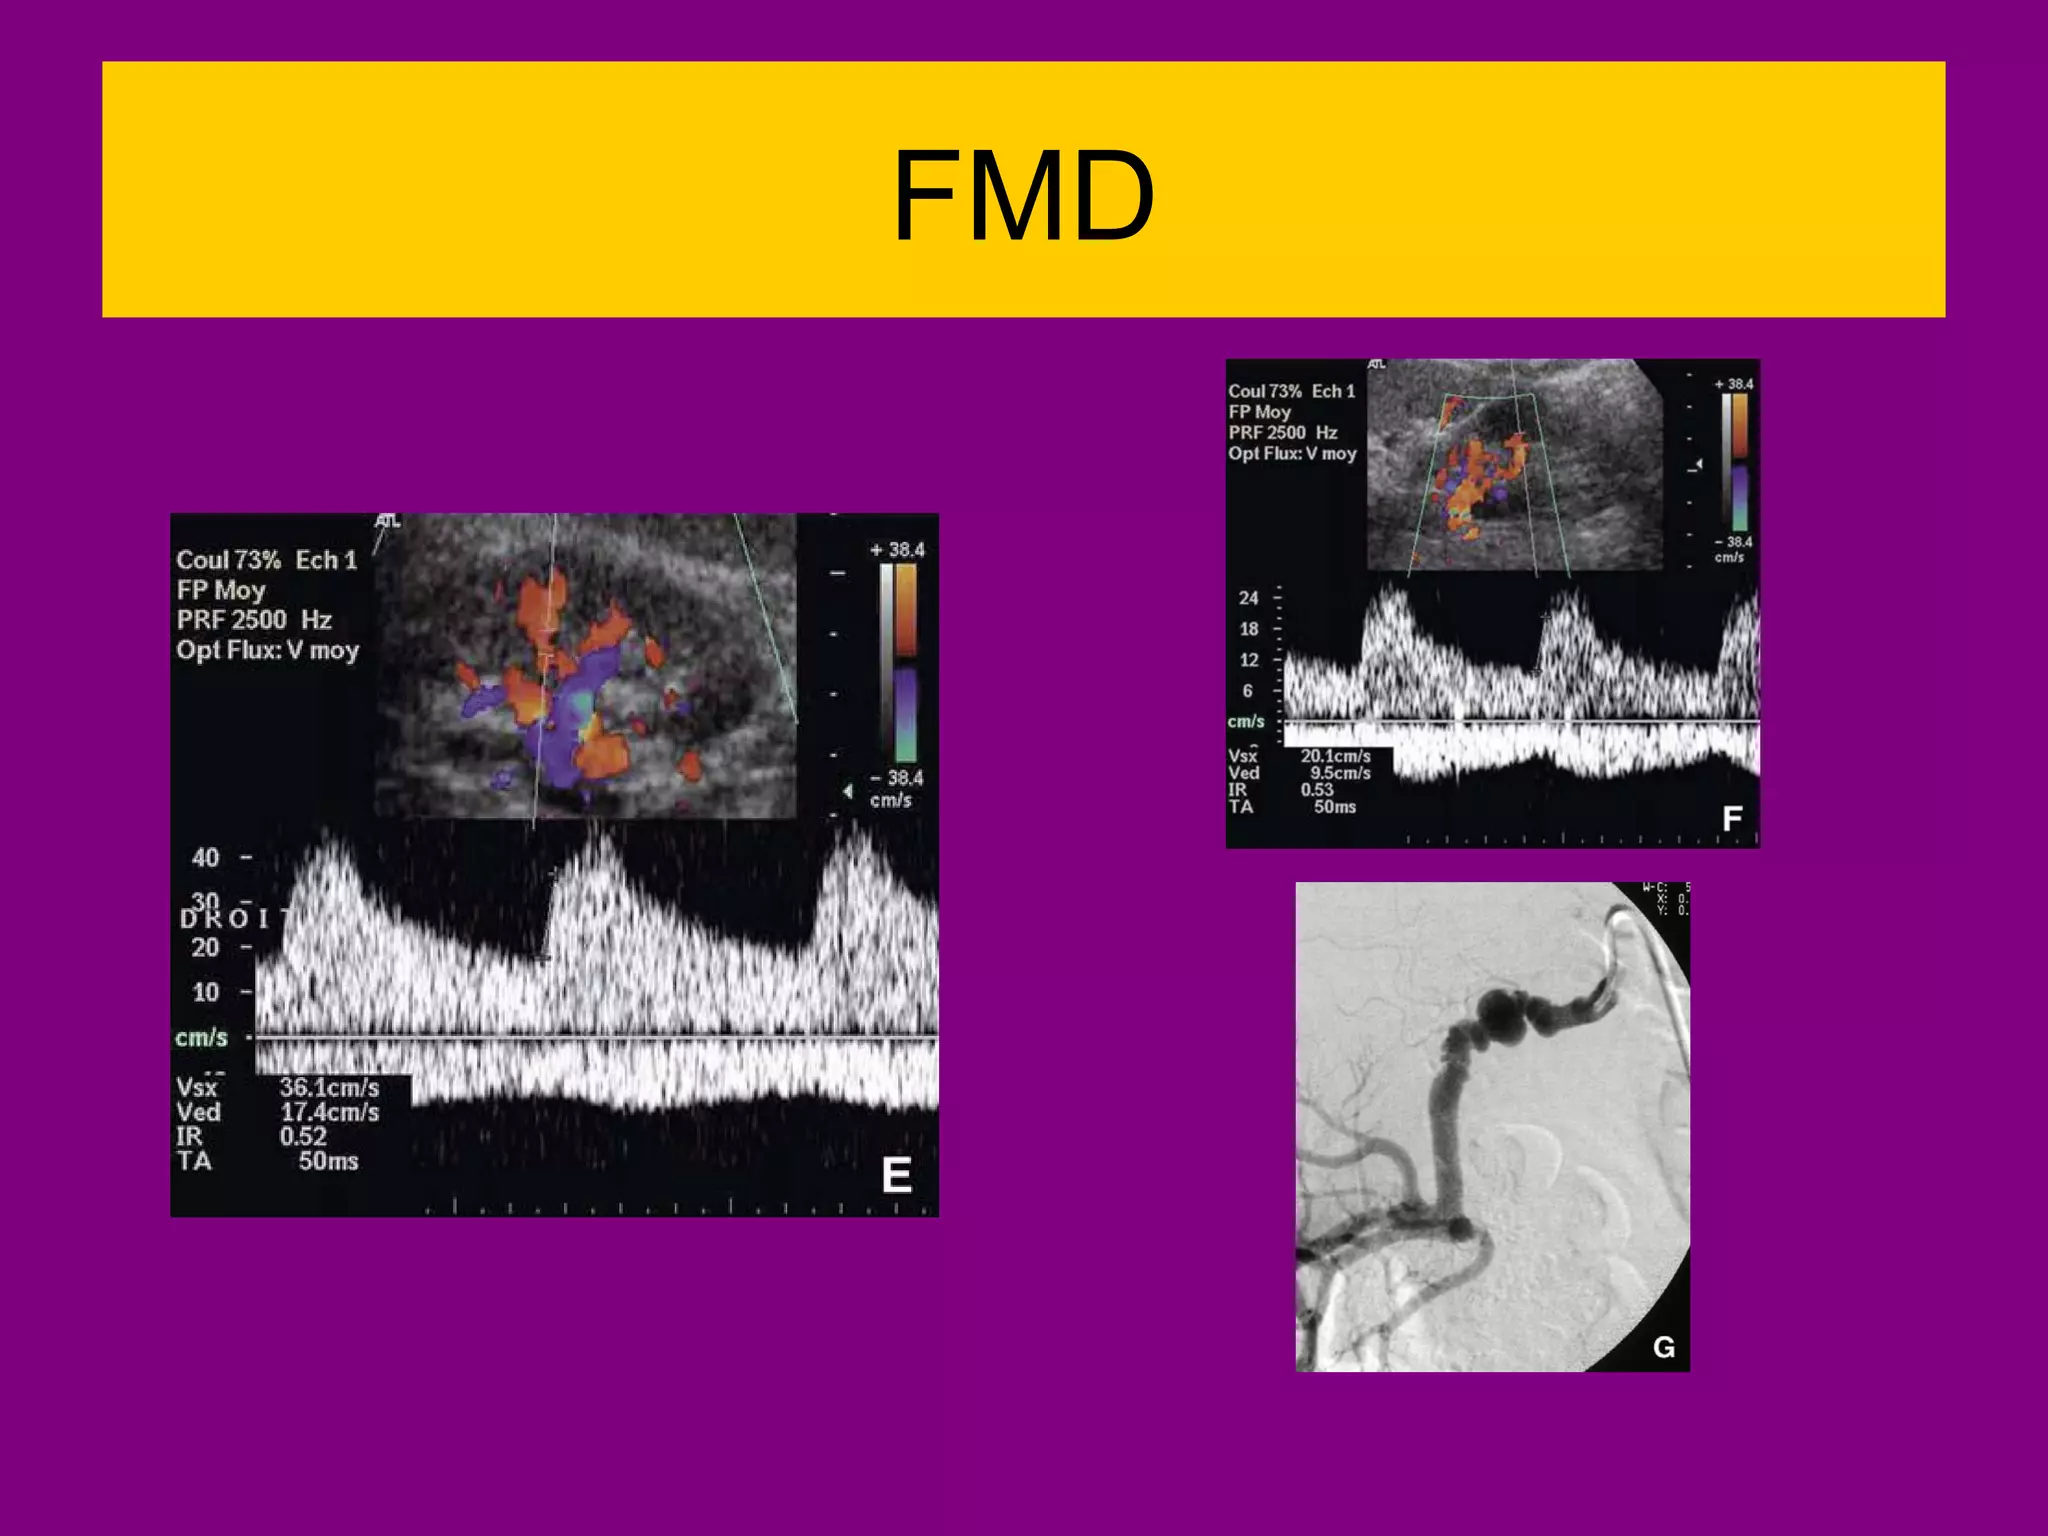


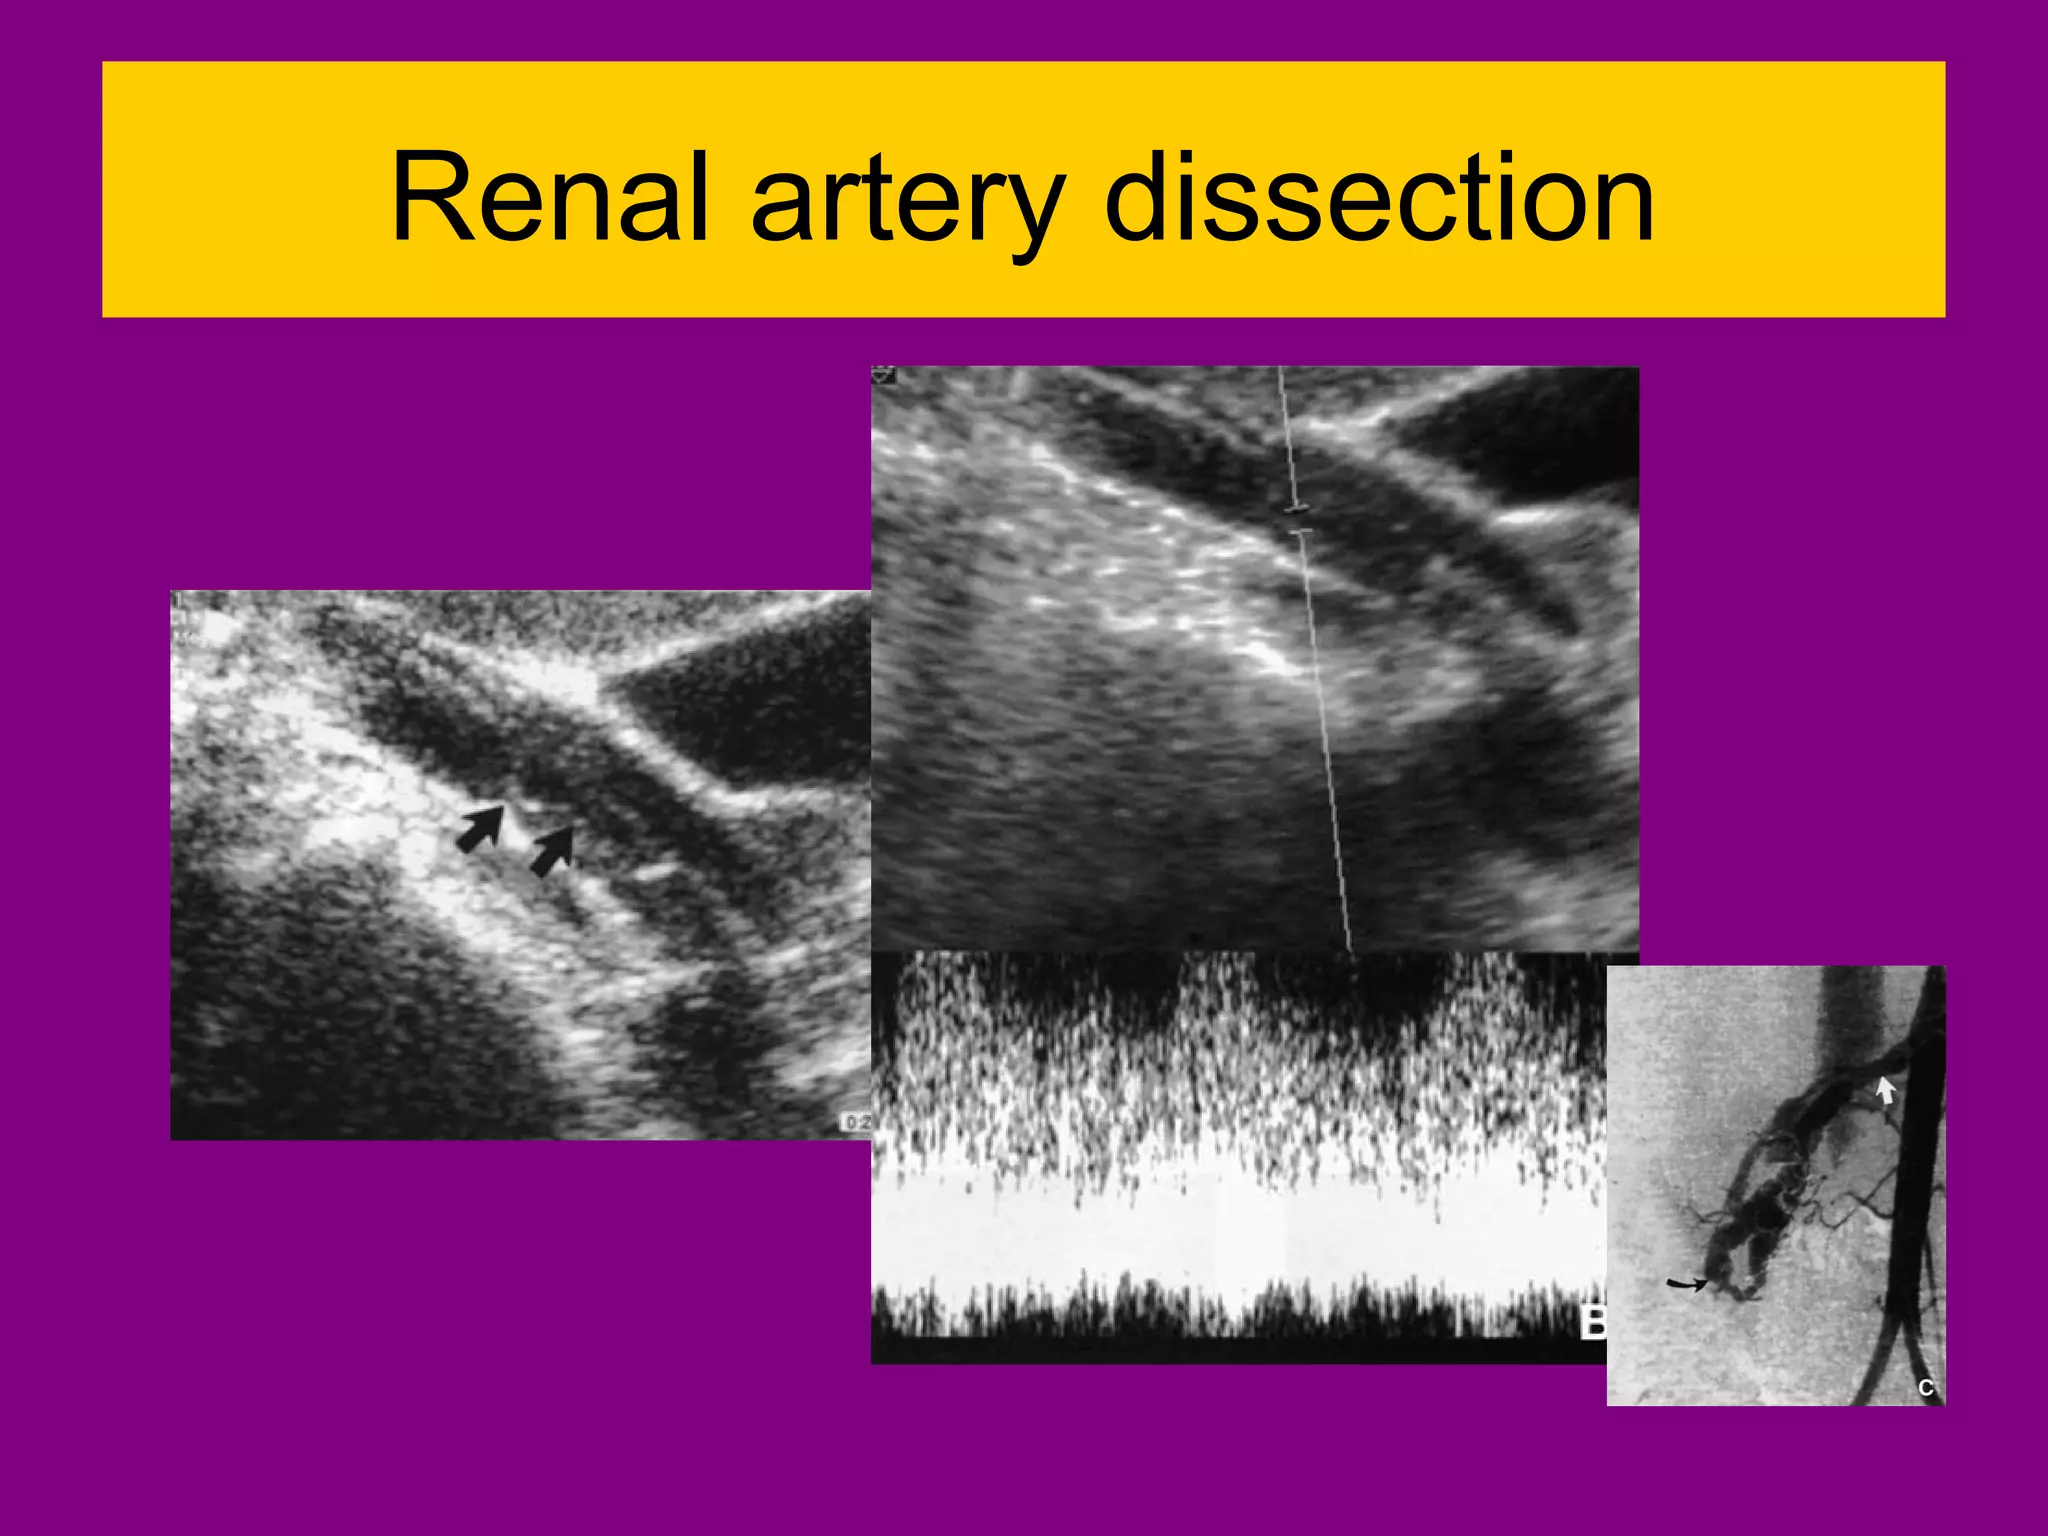


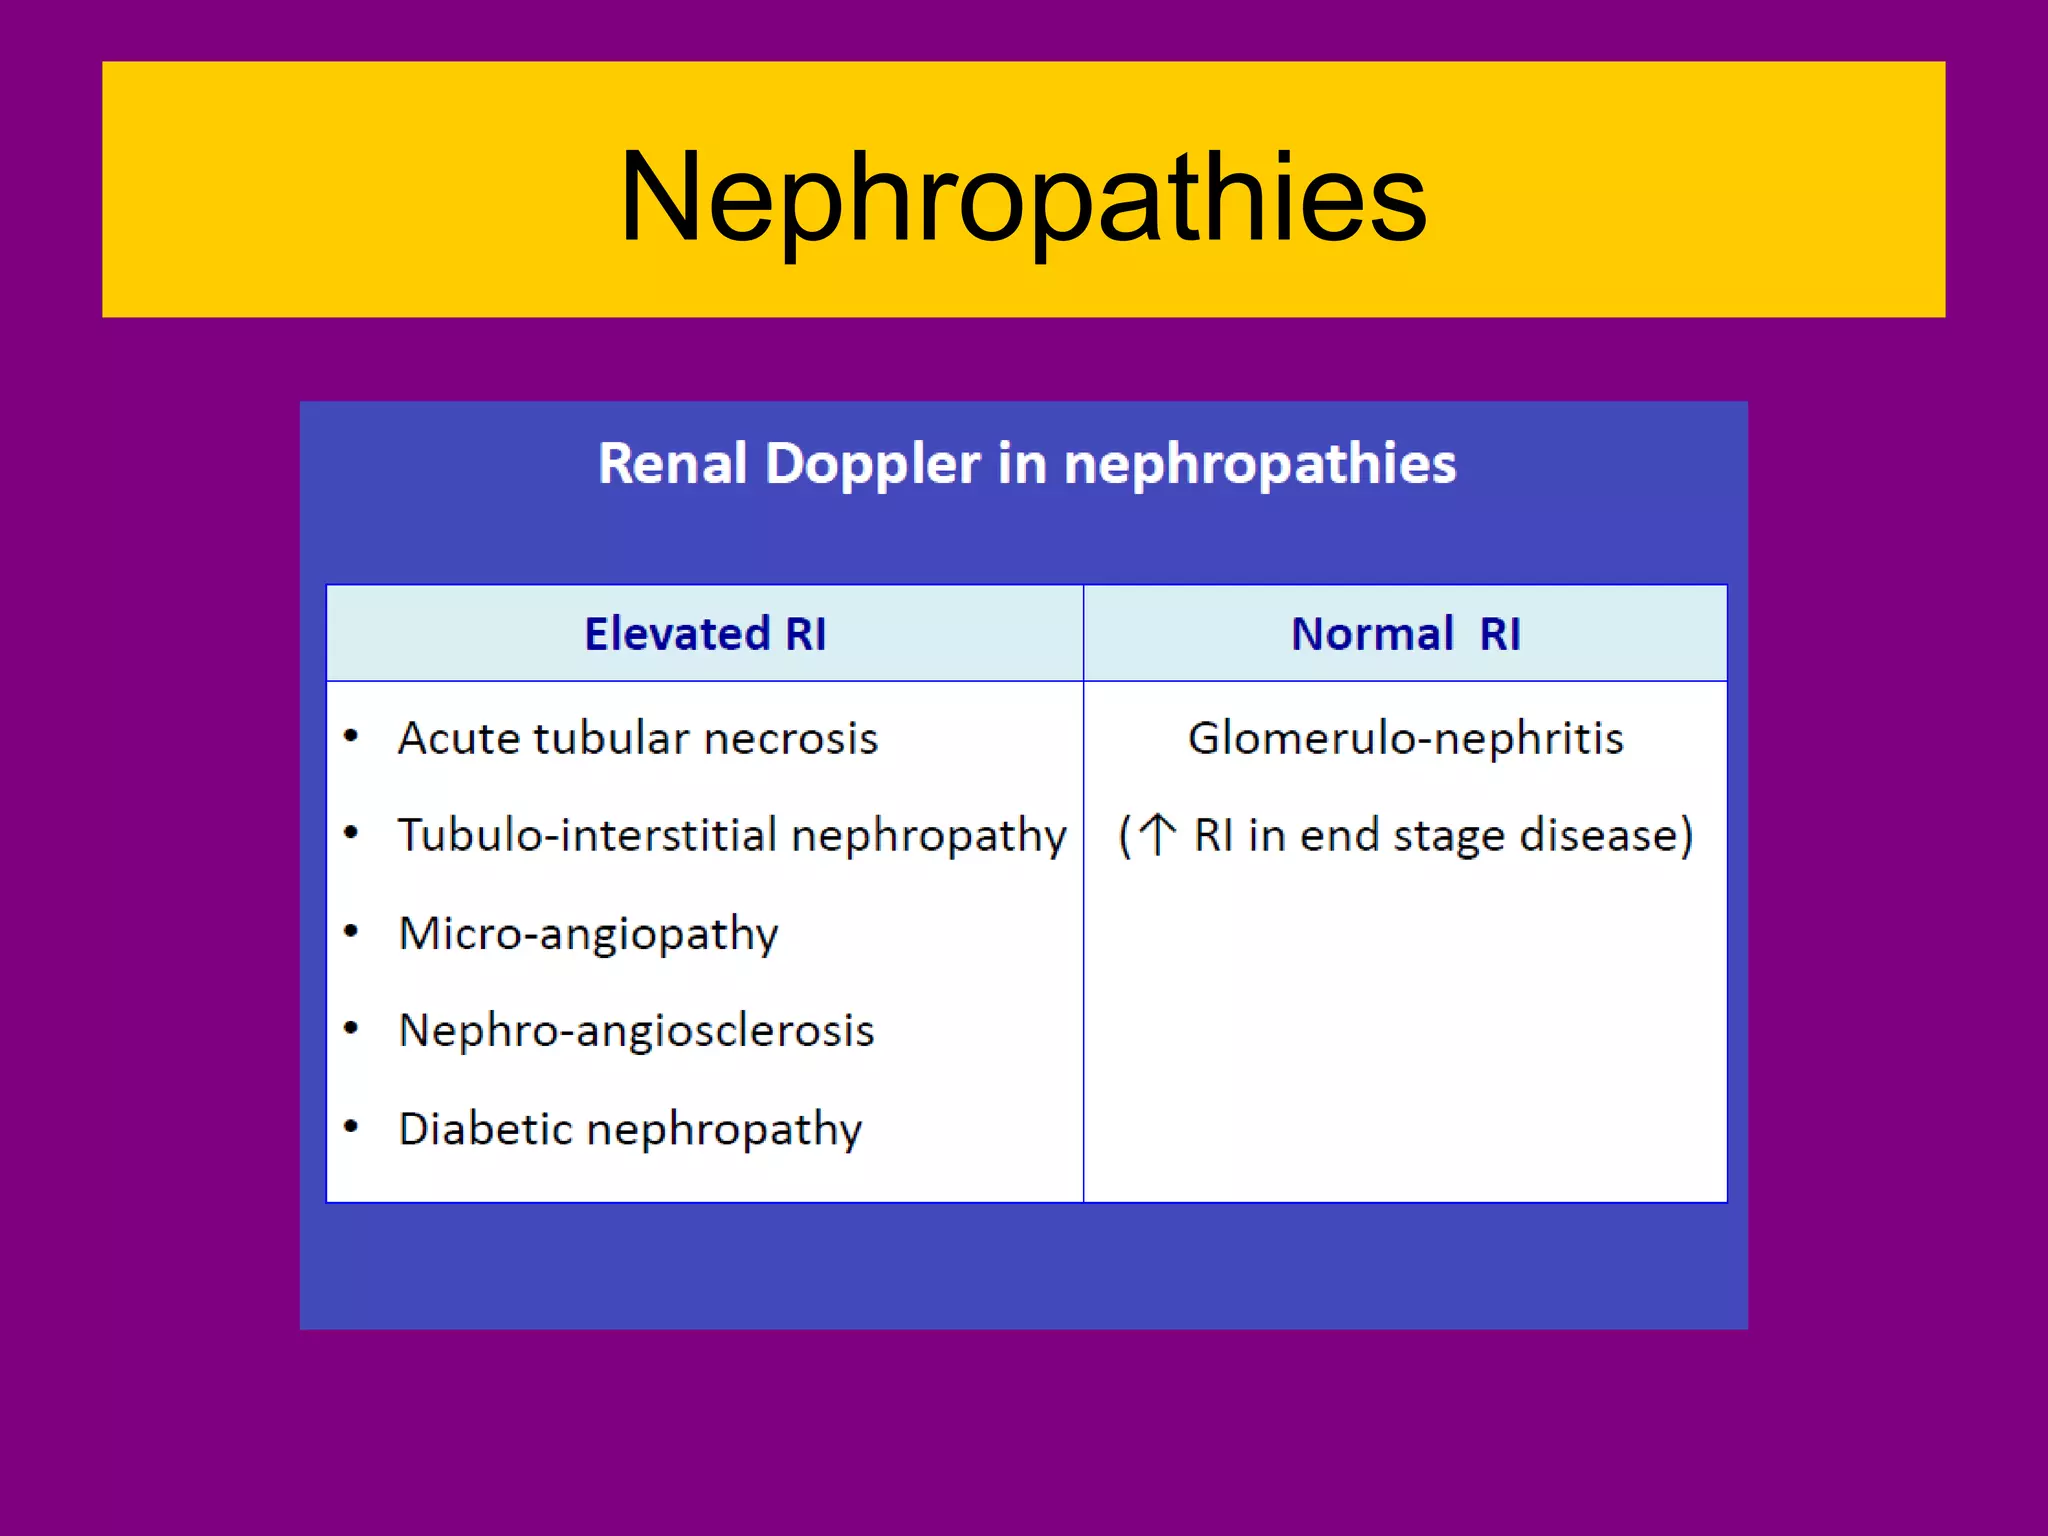


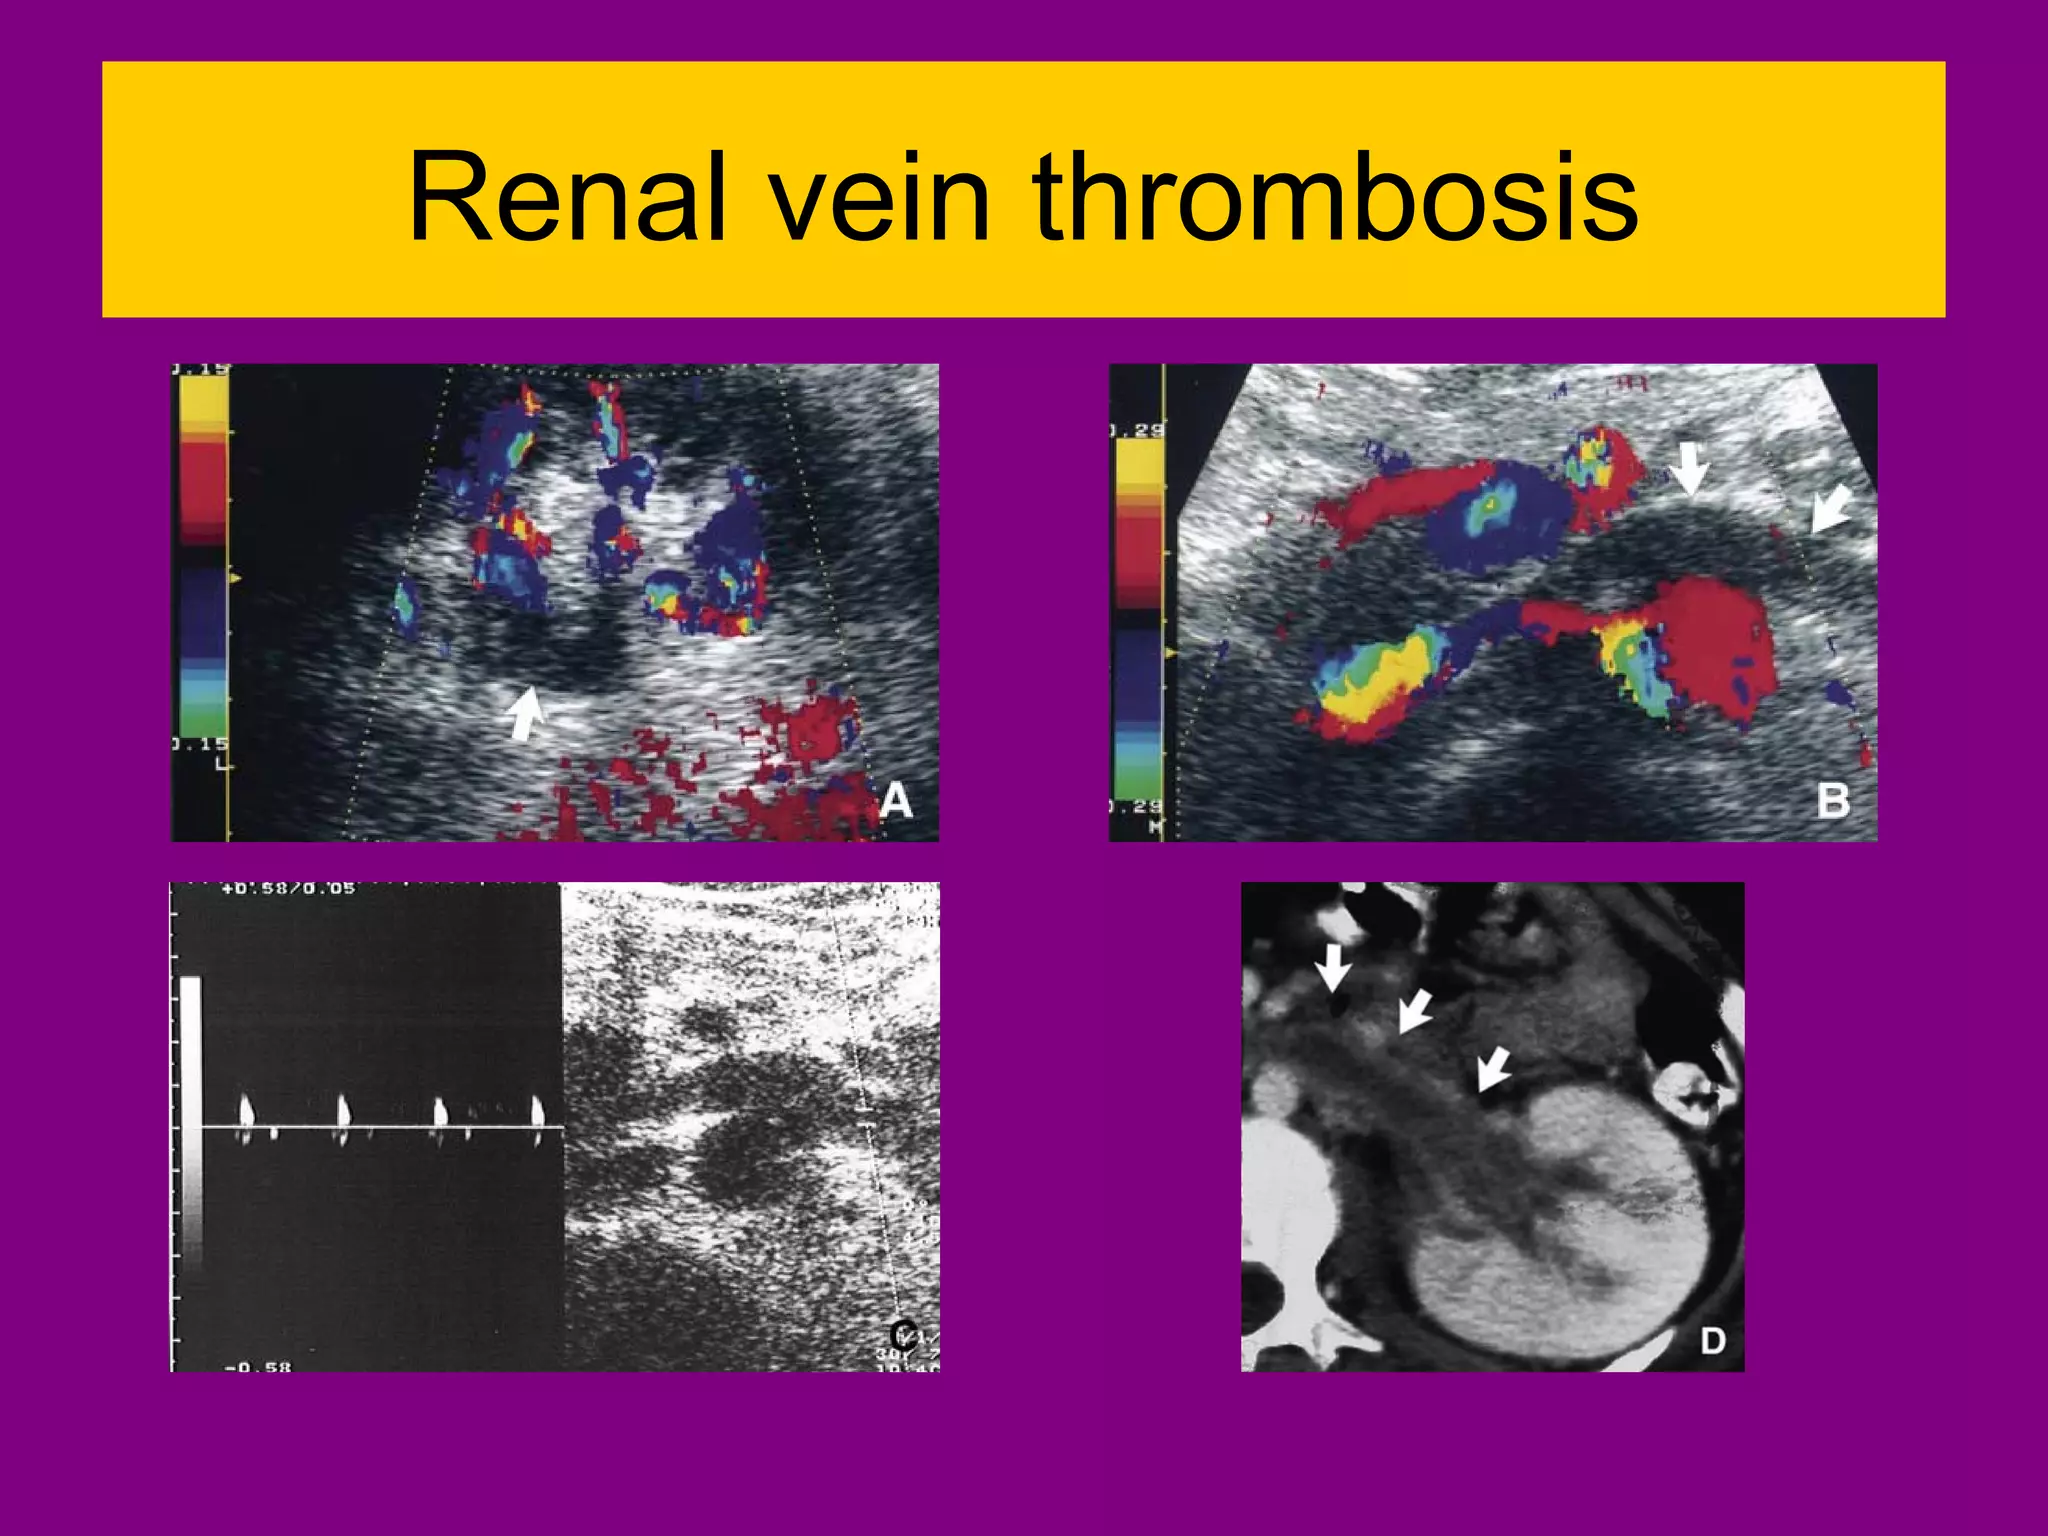


This document provides information on performing and interpreting renal Doppler ultrasounds. It discusses the optimal approaches for imaging the renal arteries, including the anterior, oblique, and flank approaches. It also outlines criteria for evaluating renal artery stenosis, including peak systolic velocity measurements and the renal-aortic ratio. Common renal pathologies that can be identified with Doppler ultrasound are also summarized, such as fibromuscular dysplasia, atherosclerosis, aneurysms, and hydronephrosis.


