Download to read offline


![services:
monolog.handler.rotating_file:
class: MonologHandlerRotatingFileHandler
arguments: ['private://logs/debug.log', 10, '%monolog.level.info%']
First of all define a new service in the service container](https://image.slidesharecdn.com/doyouknowwhatyourdrupalisdoingobserveit-220406085556/75/Do-you-know-what-your-Drupal-is-doing_-Observe-it-22-2048.jpg)
![parameters:
monolog.channel_handlers:
default:
handlers:
- name: 'rotating_file'
formatter: 'json'
monolog.processors: [
'message_placeholder', 'current_user',
'request_uri', 'ip', 'referer',
'filter_backtrace', 'introspection'
]
Then define handlers, formatter
and processors using service
container parameters. Here we're
configuring the default channel to
catch all log messages and to save
them using the
monolog.handler.rotating_file
service, in json format and after
being processed by a set of
processors](https://image.slidesharecdn.com/doyouknowwhatyourdrupalisdoingobserveit-220406085556/75/Do-you-know-what-your-Drupal-is-doing_-Observe-it-23-2048.jpg)
![settings.php
$settings['container_yamls'][] =
DRUPAL_ROOT . '/sites/default/monolog.services.yml';
Add monolog.services.yml to
the list of container’s yamls in settings.php file](https://image.slidesharecdn.com/doyouknowwhatyourdrupalisdoingobserveit-220406085556/75/Do-you-know-what-your-Drupal-is-doing_-Observe-it-24-2048.jpg)
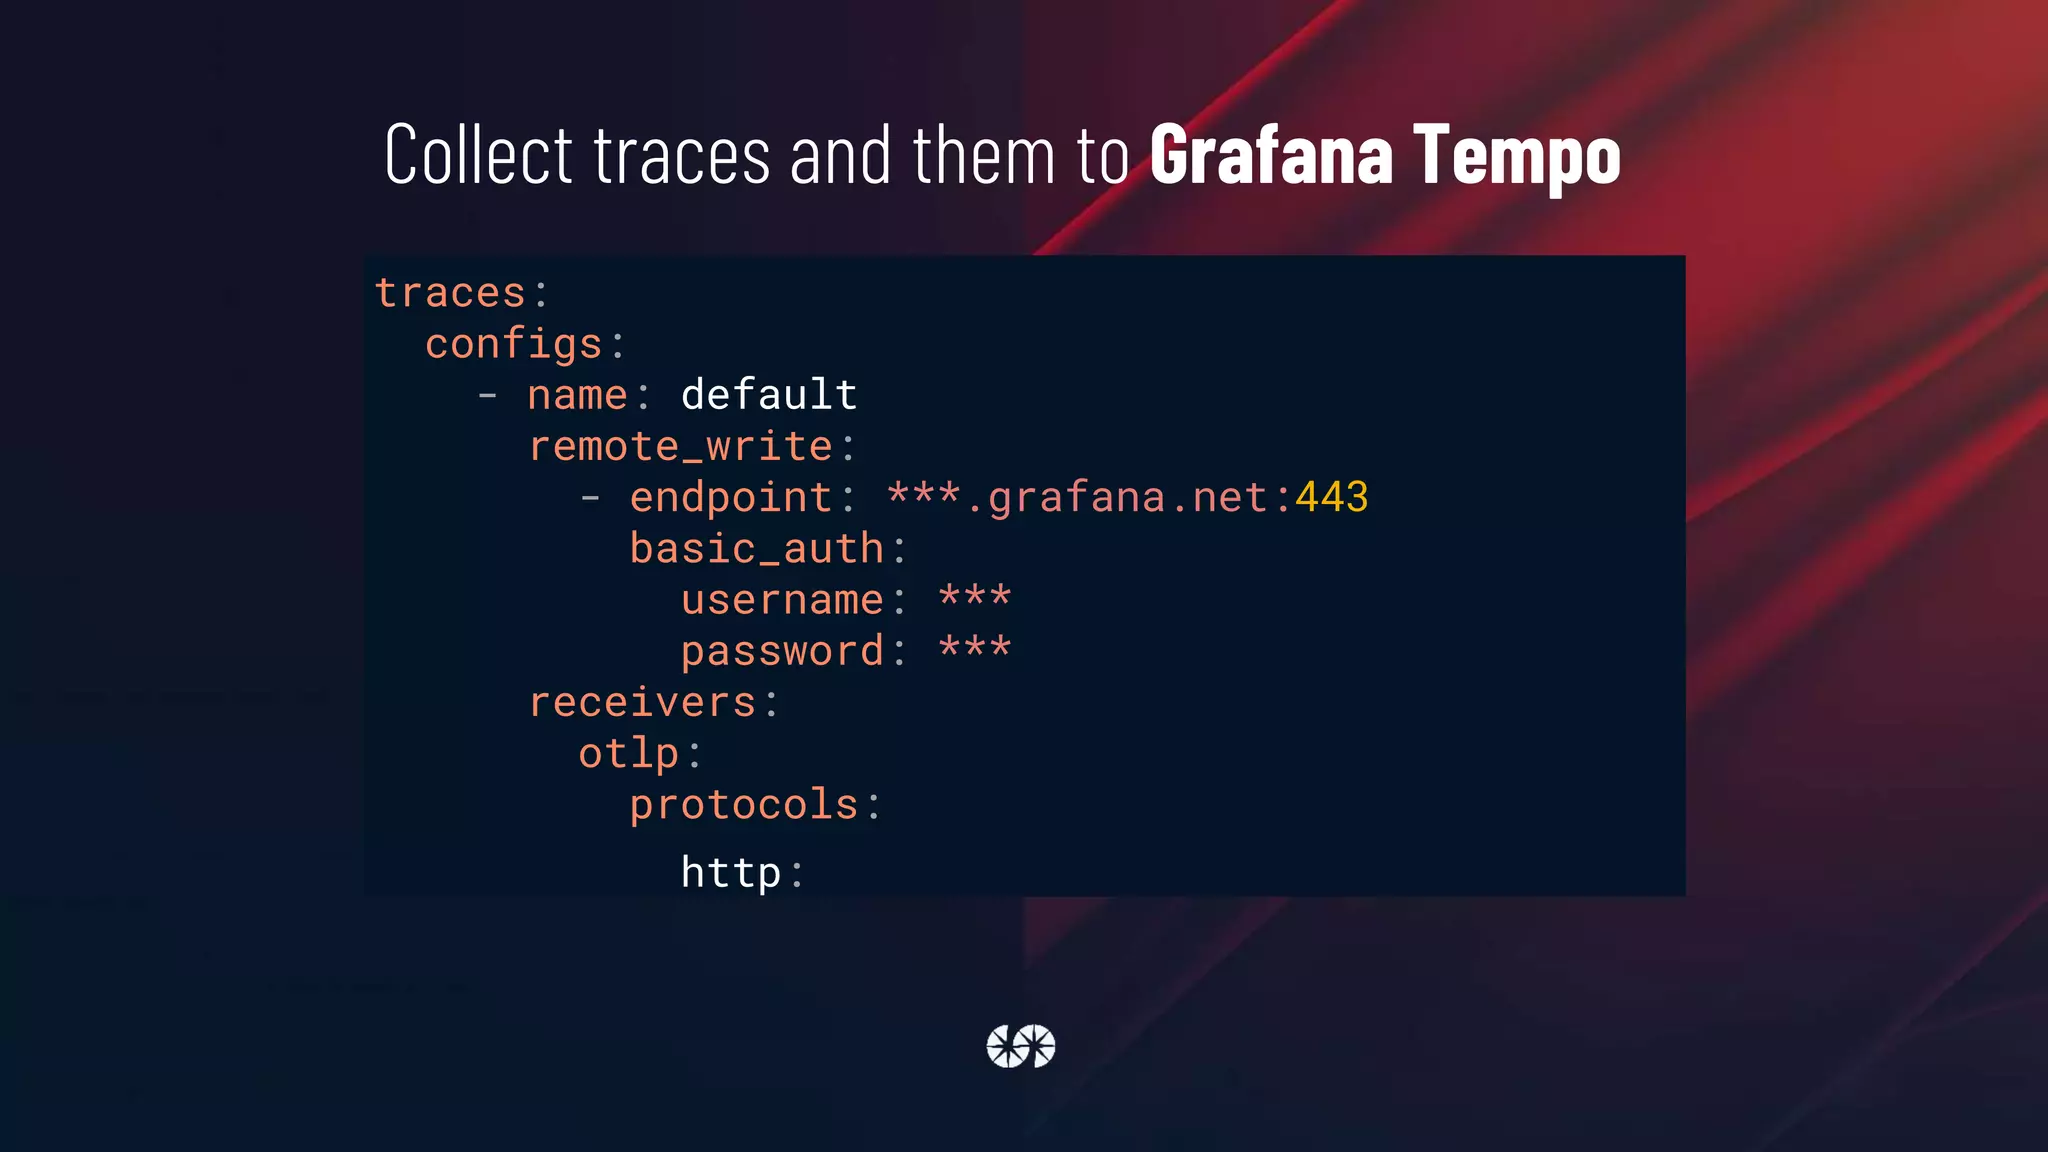
![logs:
configs:
- name: default
positions:
filename: /mnt/ddev_config/grafana/positions.yaml
scrape_configs:
- job_name: drupal
pipeline_stages:
- json:
expressions:
level: level_name
- labels:
level:
static_configs:
- targets: [localhost]
labels:
job: drupal
__path__: /private/logs/*log
clients:
- url: http://***.grafana.net/loki/api/v1/push
basic_auth:
username: ***
password: ***
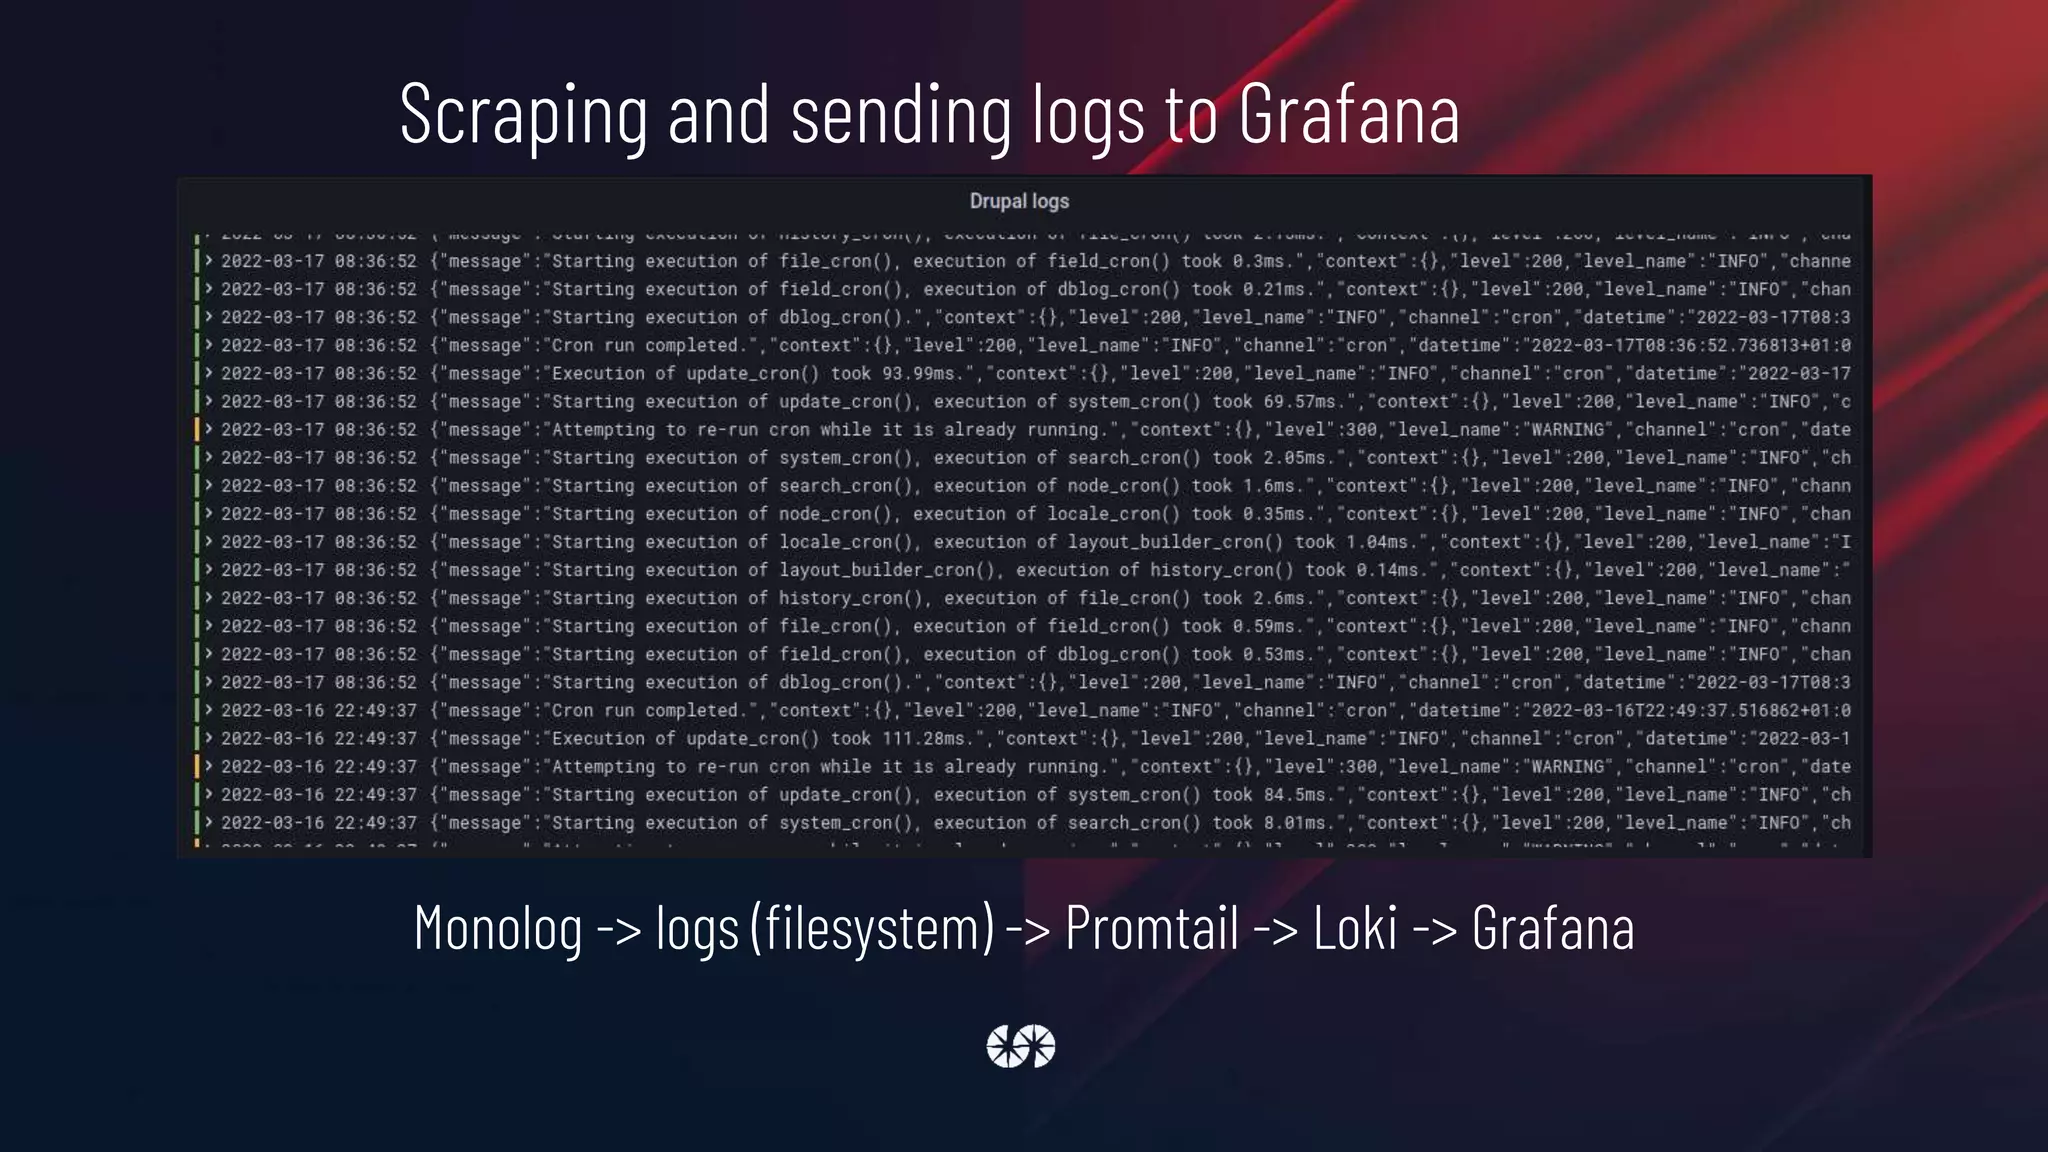
Scraping and sending logs to Grafana Loki](https://image.slidesharecdn.com/doyouknowwhatyourdrupalisdoingobserveit-220406085556/75/Do-you-know-what-your-Drupal-is-doing_-Observe-it-29-2048.jpg)

![metrics:
global:
scrape_interval: 1m
remote_write:
- url: https://***.grafana.net/api/prom/push
basic_auth:
username: ***
password: ***
configs:
- name: default
scrape_configs:
- job_name: drupal
static_configs:
- targets: [ddev-drupal10-web]
Scraping and sending metrics to Grafana Prometheus](https://image.slidesharecdn.com/doyouknowwhatyourdrupalisdoingobserveit-220406085556/75/Do-you-know-what-your-Drupal-is-doing_-Observe-it-40-2048.jpg)
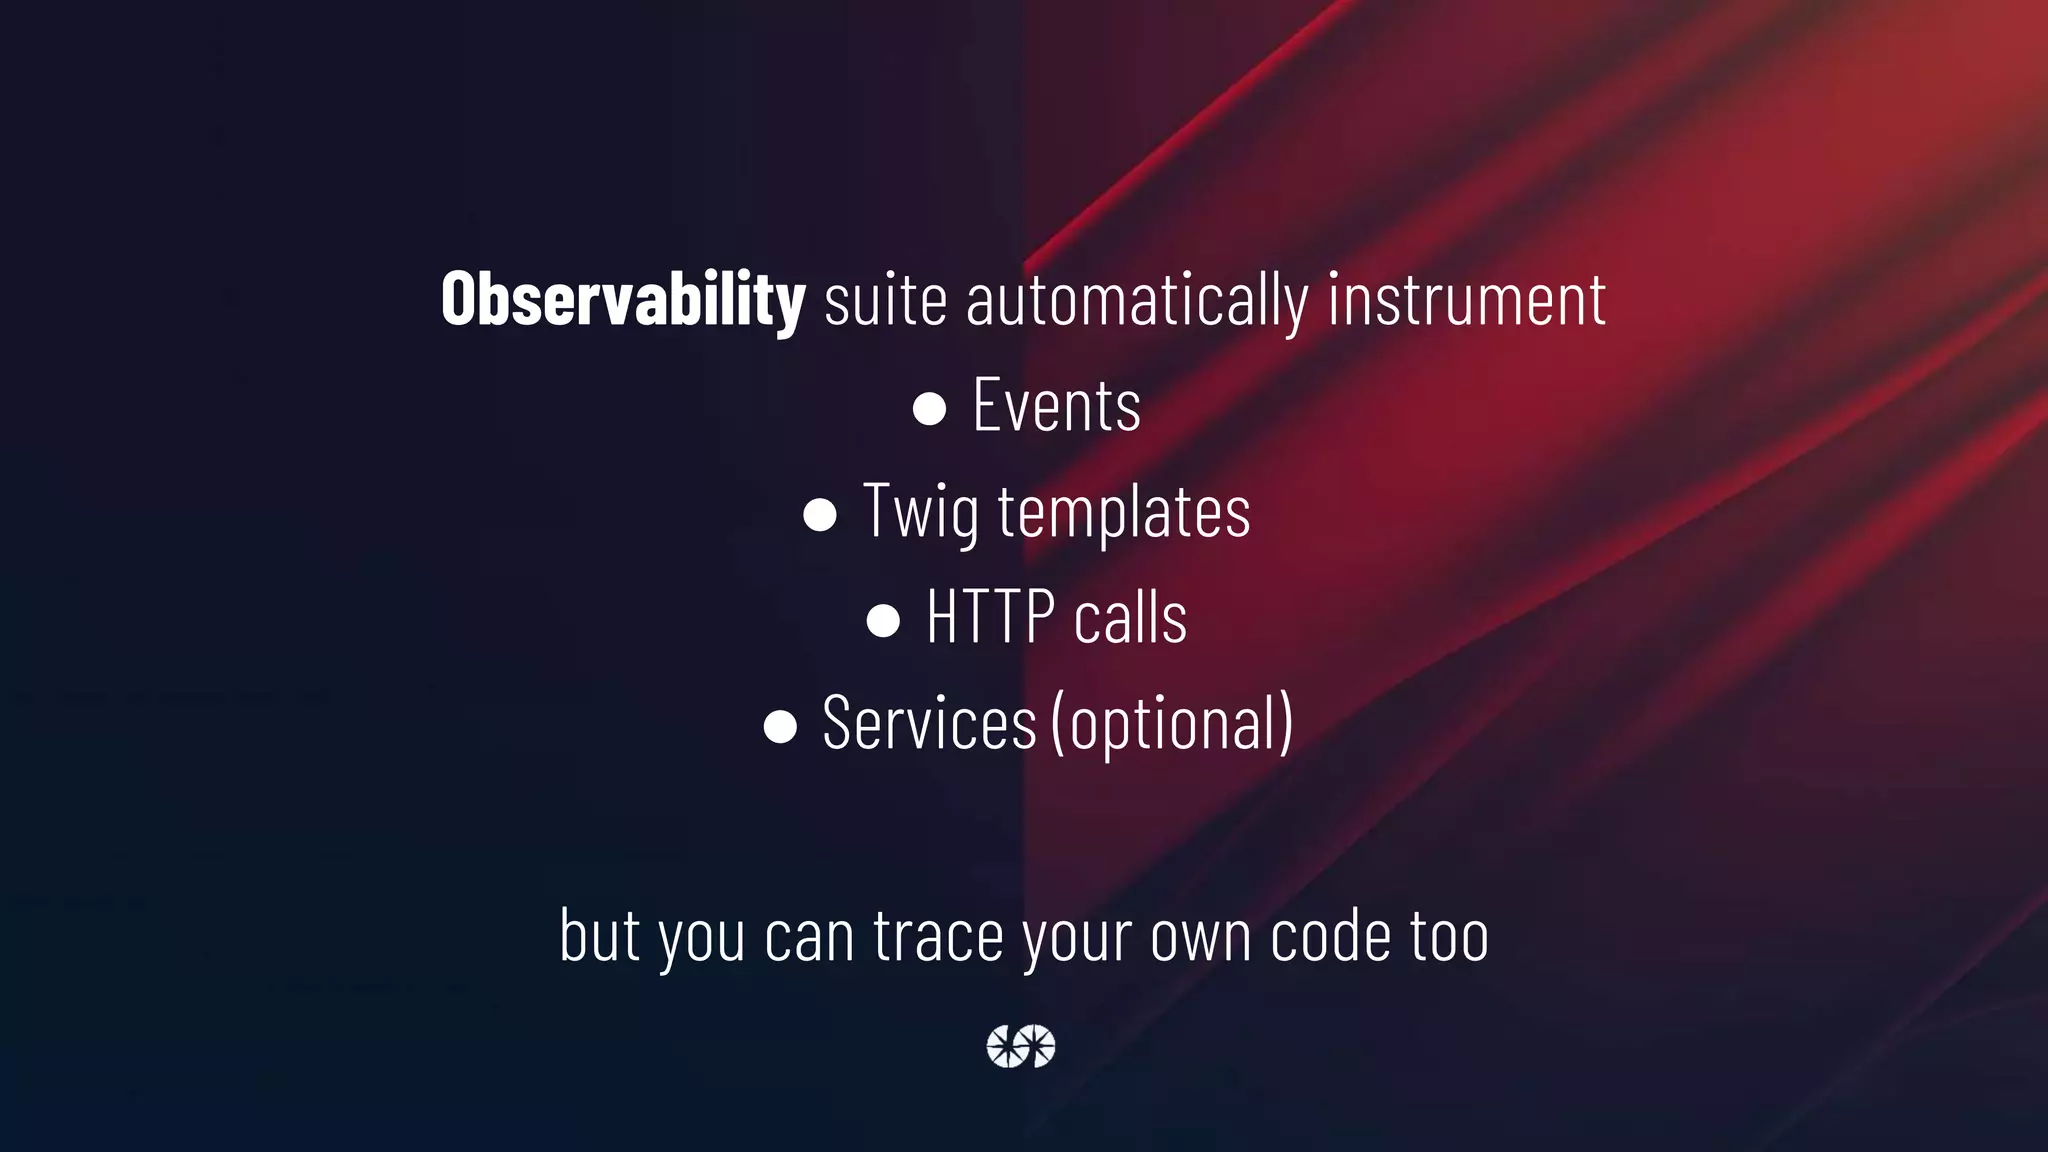
![Manually instrument code
function example_entity_insert(EntityInterface $entity) {
/** @var Drupalo11y_metricsMeterInterface $meter */
$meter = Drupal::service('o11y_metrics.meter');
$meter->increment(
'entity_insert',
'Insert a new entity',
[
'type' => $entity->getEntityTypeId(),
'bundle' => $entity->bundle()
]
);
}](https://image.slidesharecdn.com/doyouknowwhatyourdrupalisdoingobserveit-220406085556/75/Do-you-know-what-your-Drupal-is-doing_-Observe-it-41-2048.jpg)


![class MicroserviceController extends ControllerBase {
private Client $httpClient;
public static function create(ContainerInterface $container) {
return new static(
$container->get('http_client')
);
}
final public function __construct(Client $httpClient) {
$this->httpClient = $httpClient;
}
public function view() {
$response = $this->httpClient->get('http://ddev-drupal10-microservice:8080/hello-instrumented');
$json = json_decode($response->getBody()->getContents());
$this->loggerFactory->get('devdays')->notice($json->message);
return [
'#type' => 'markup',
'#markup' => $json->message,
];
}
}](https://image.slidesharecdn.com/doyouknowwhatyourdrupalisdoingobserveit-220406085556/75/Do-you-know-what-your-Drupal-is-doing_-Observe-it-50-2048.jpg)

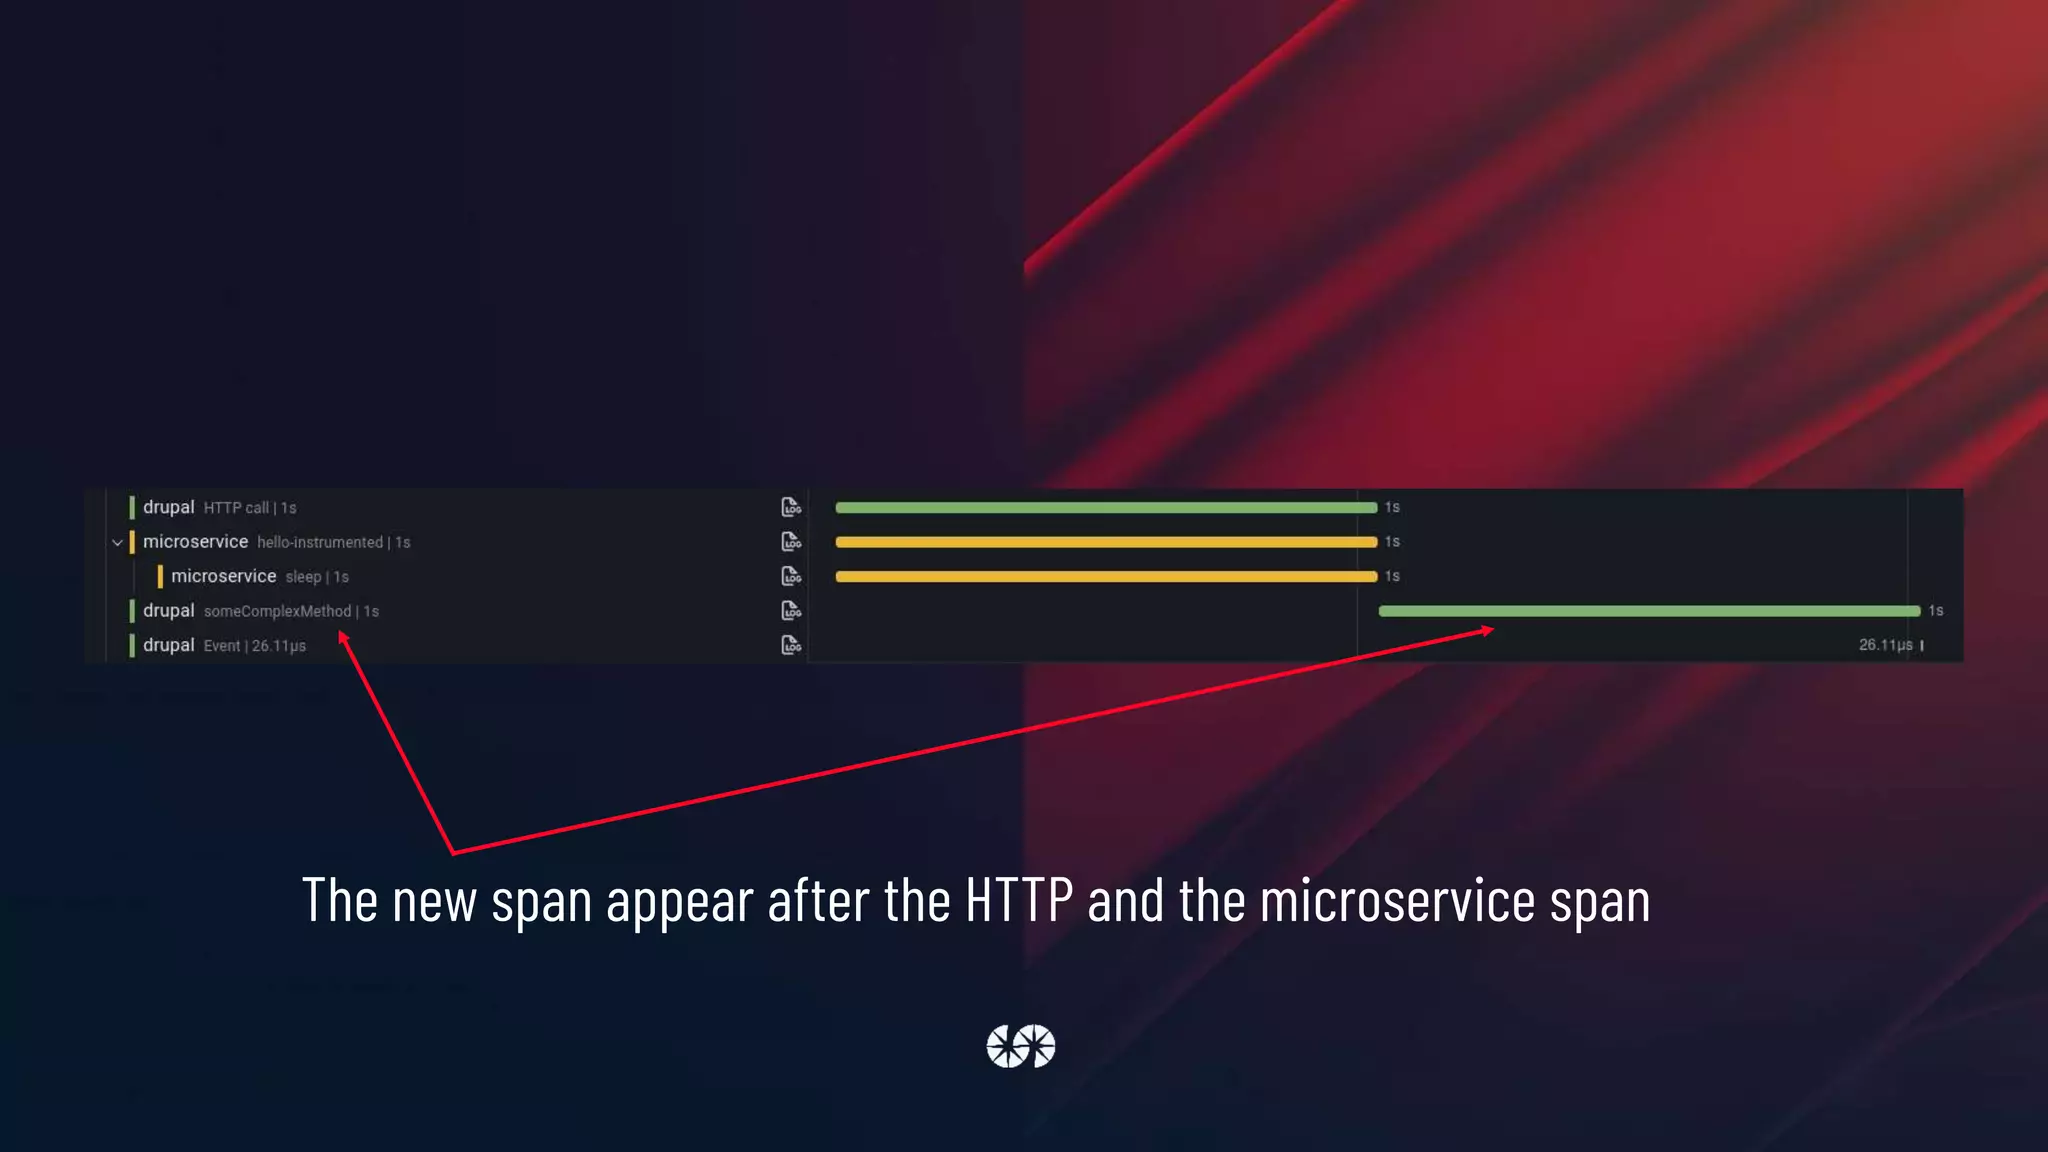
![public function view() {
$response =
$this->httpClient->get('http://ddev-drupal10-microservice:8080/hello-instrumented');
$json = json_decode($response->getBody()->getContents());
$this->getLogger('devdays')->notice($json->message);
$this->someComplexMethod($json);
return [
'#type' => 'markup',
'#markup' => $json->message,
];
}
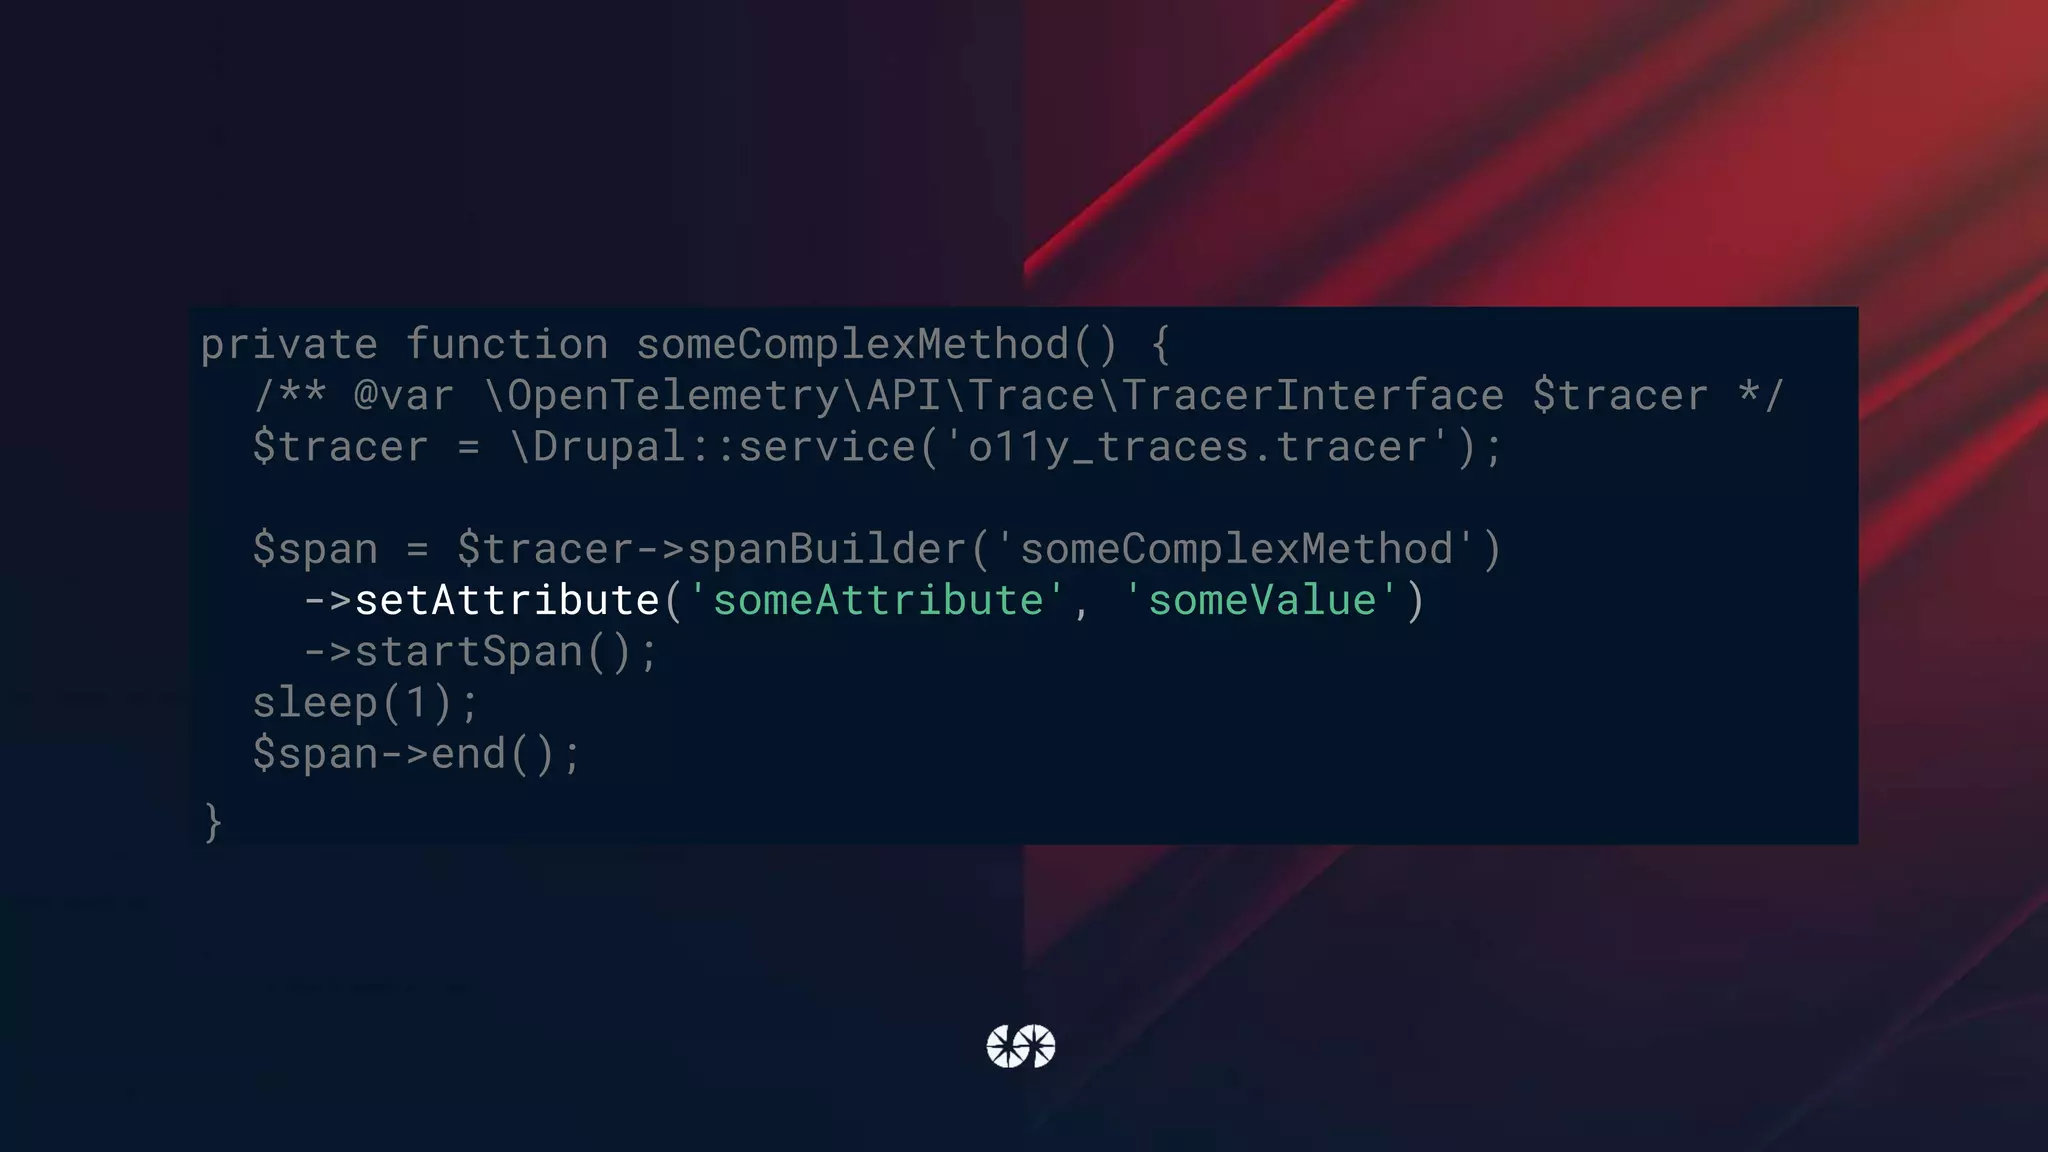
private function someComplexMethod(string $json) {
/** @var OpenTelemetryAPITraceTracerInterface $tracer */
$tracer = Drupal::service('o11y_traces.tracer');
$span = $tracer->spanBuilder('someComplexMethod')->startSpan();
sleep(1);
$span->end();
}](https://image.slidesharecdn.com/doyouknowwhatyourdrupalisdoingobserveit-220406085556/75/Do-you-know-what-your-Drupal-is-doing_-Observe-it-55-2048.jpg)

![parameters:
monolog.channel_handlers:
default:
handlers:
- name: 'rotating_file'
formatter: 'json'
monolog.processors: [
'message_placeholder', 'current_user',
'request_uri', 'ip', 'referer',
'filter_backtrace', 'introspection', 'tracer'
]](https://image.slidesharecdn.com/doyouknowwhatyourdrupalisdoingobserveit-220406085556/75/Do-you-know-what-your-Drupal-is-doing_-Observe-it-61-2048.jpg)


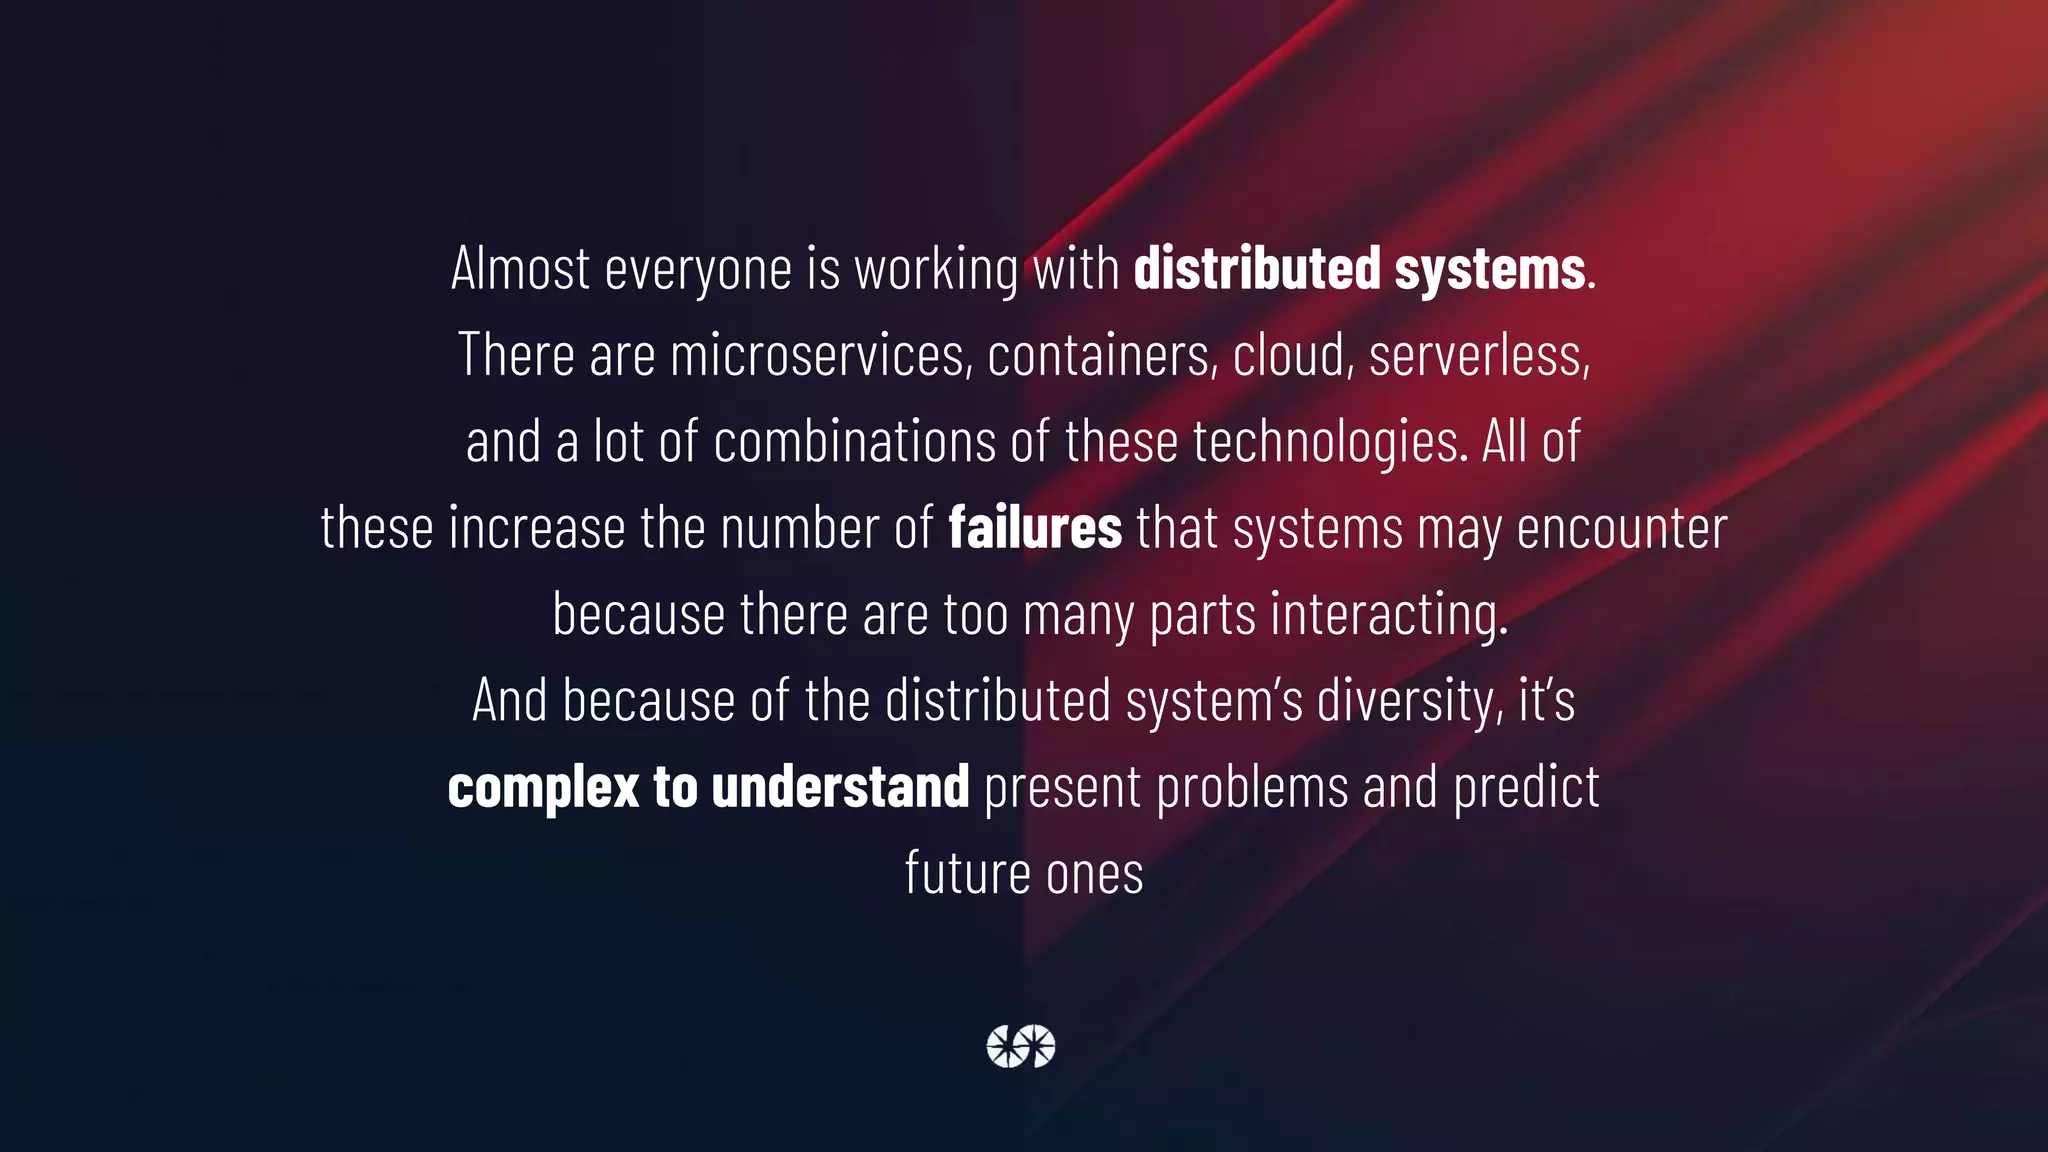
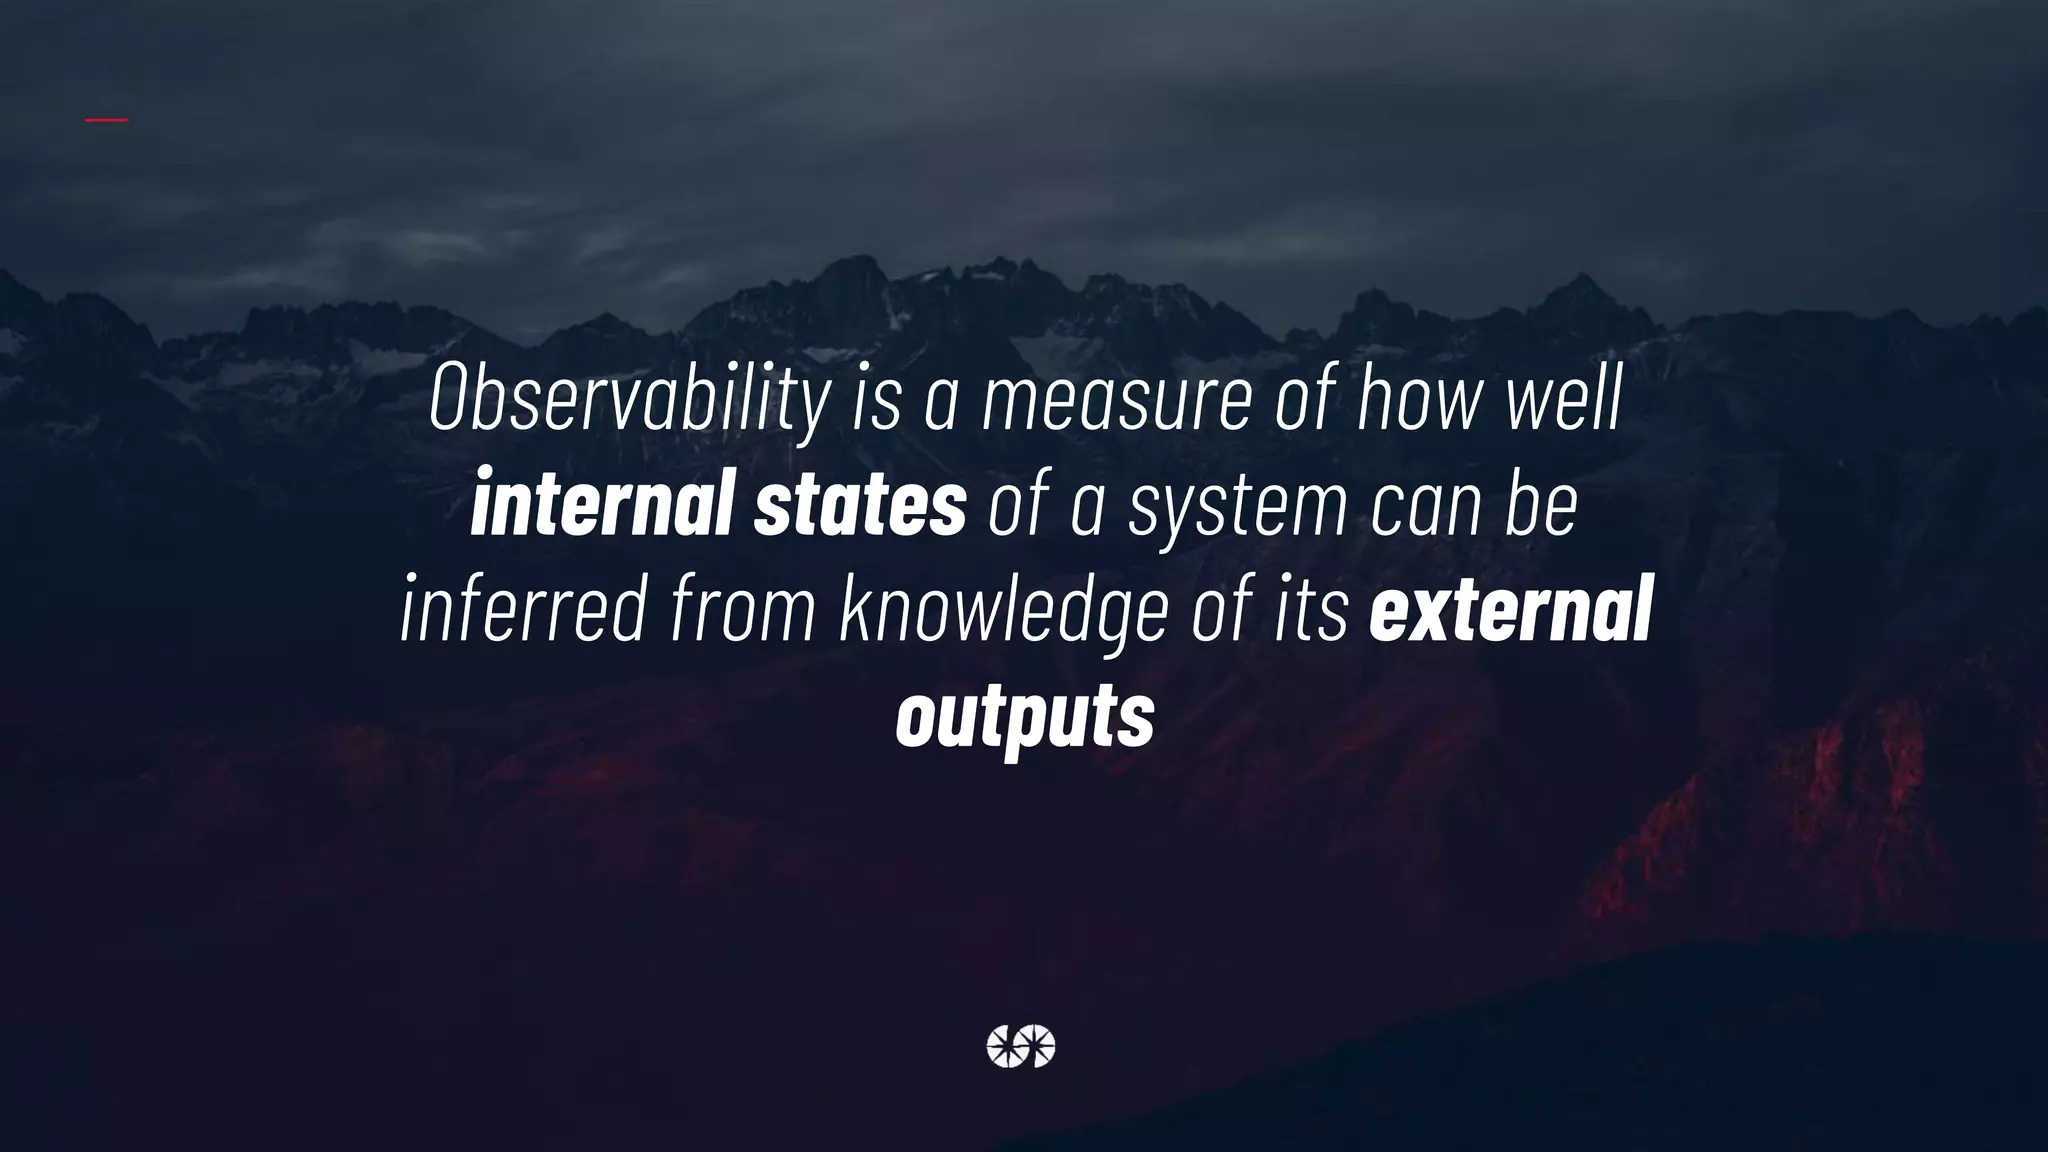
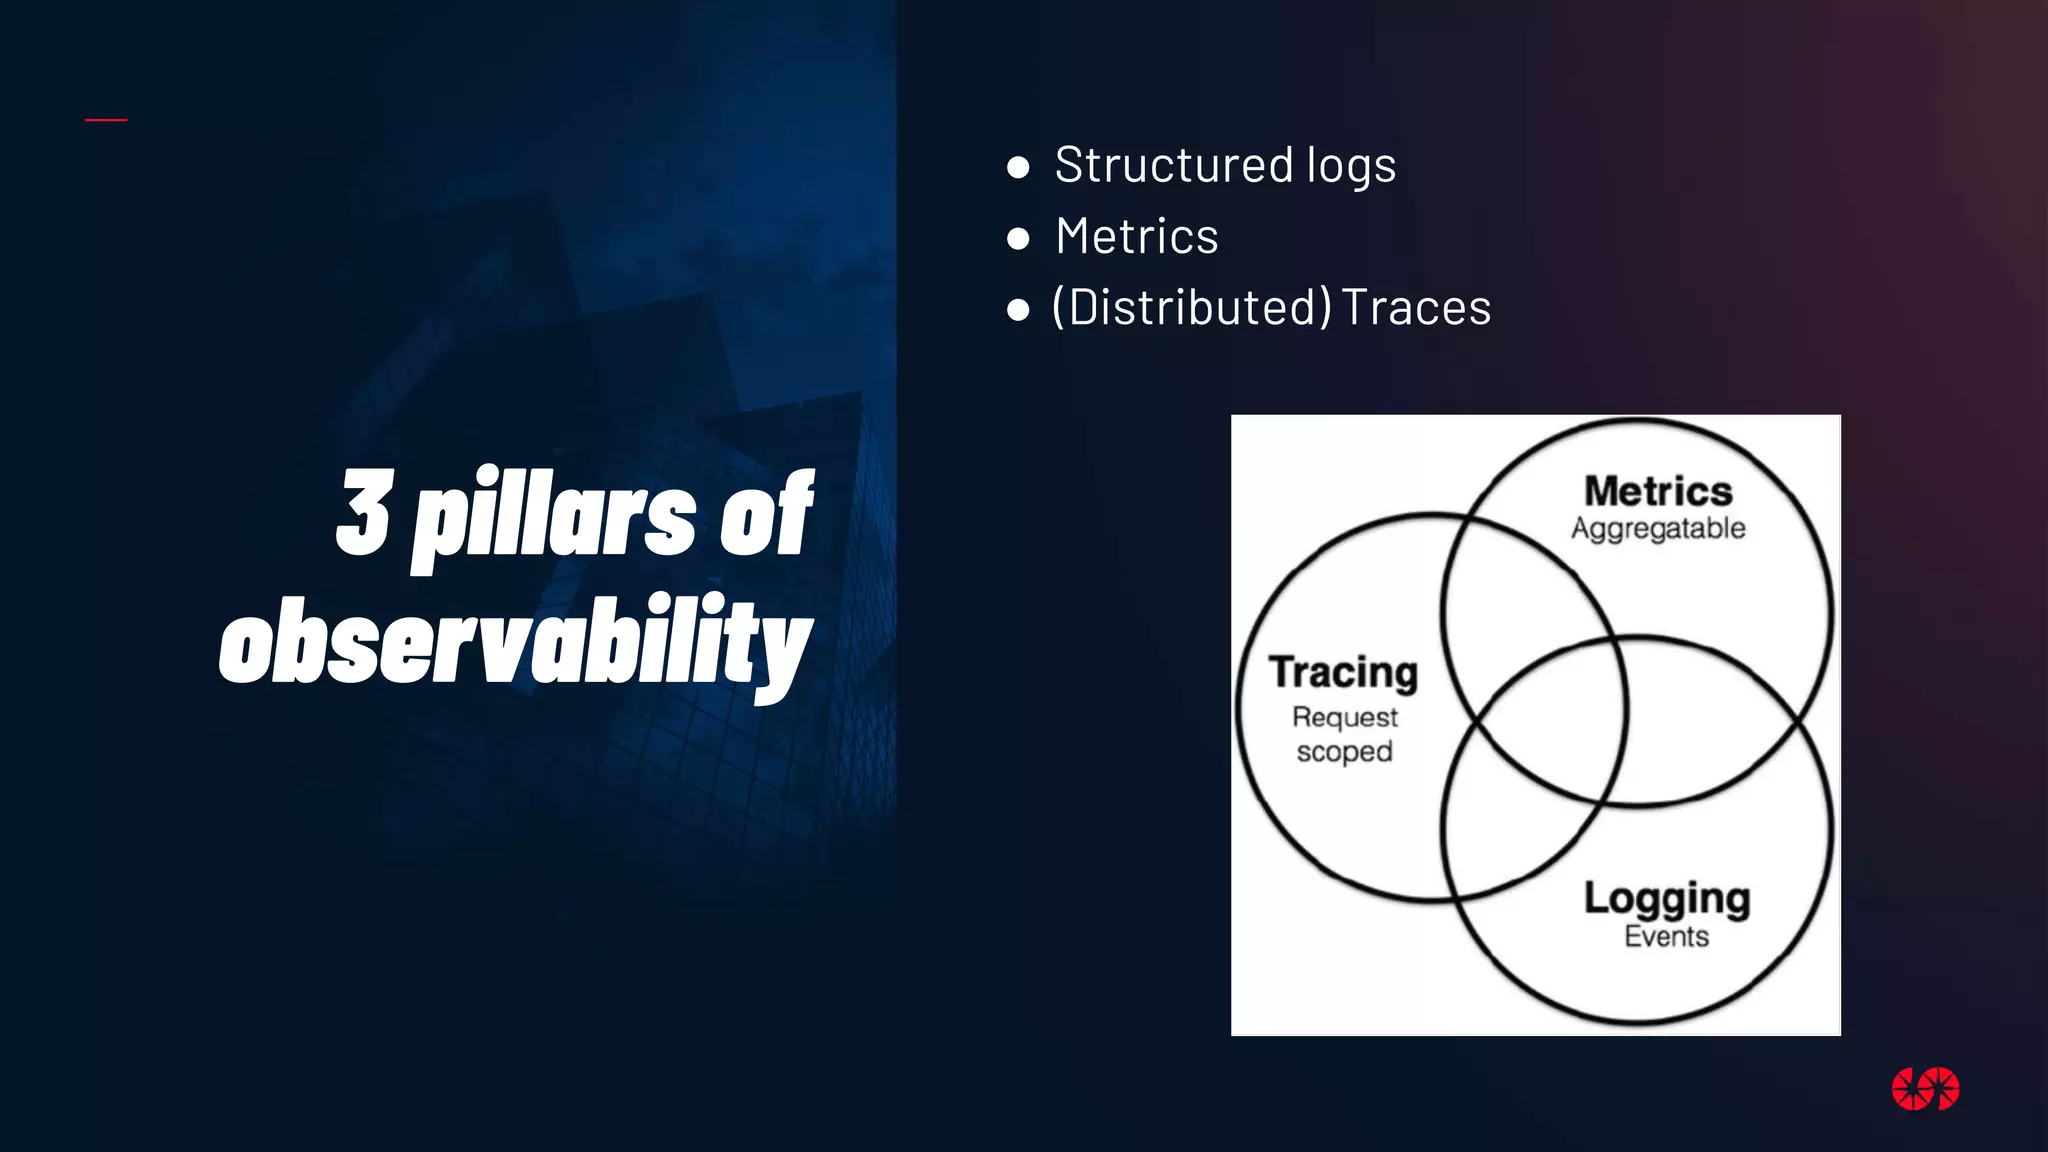
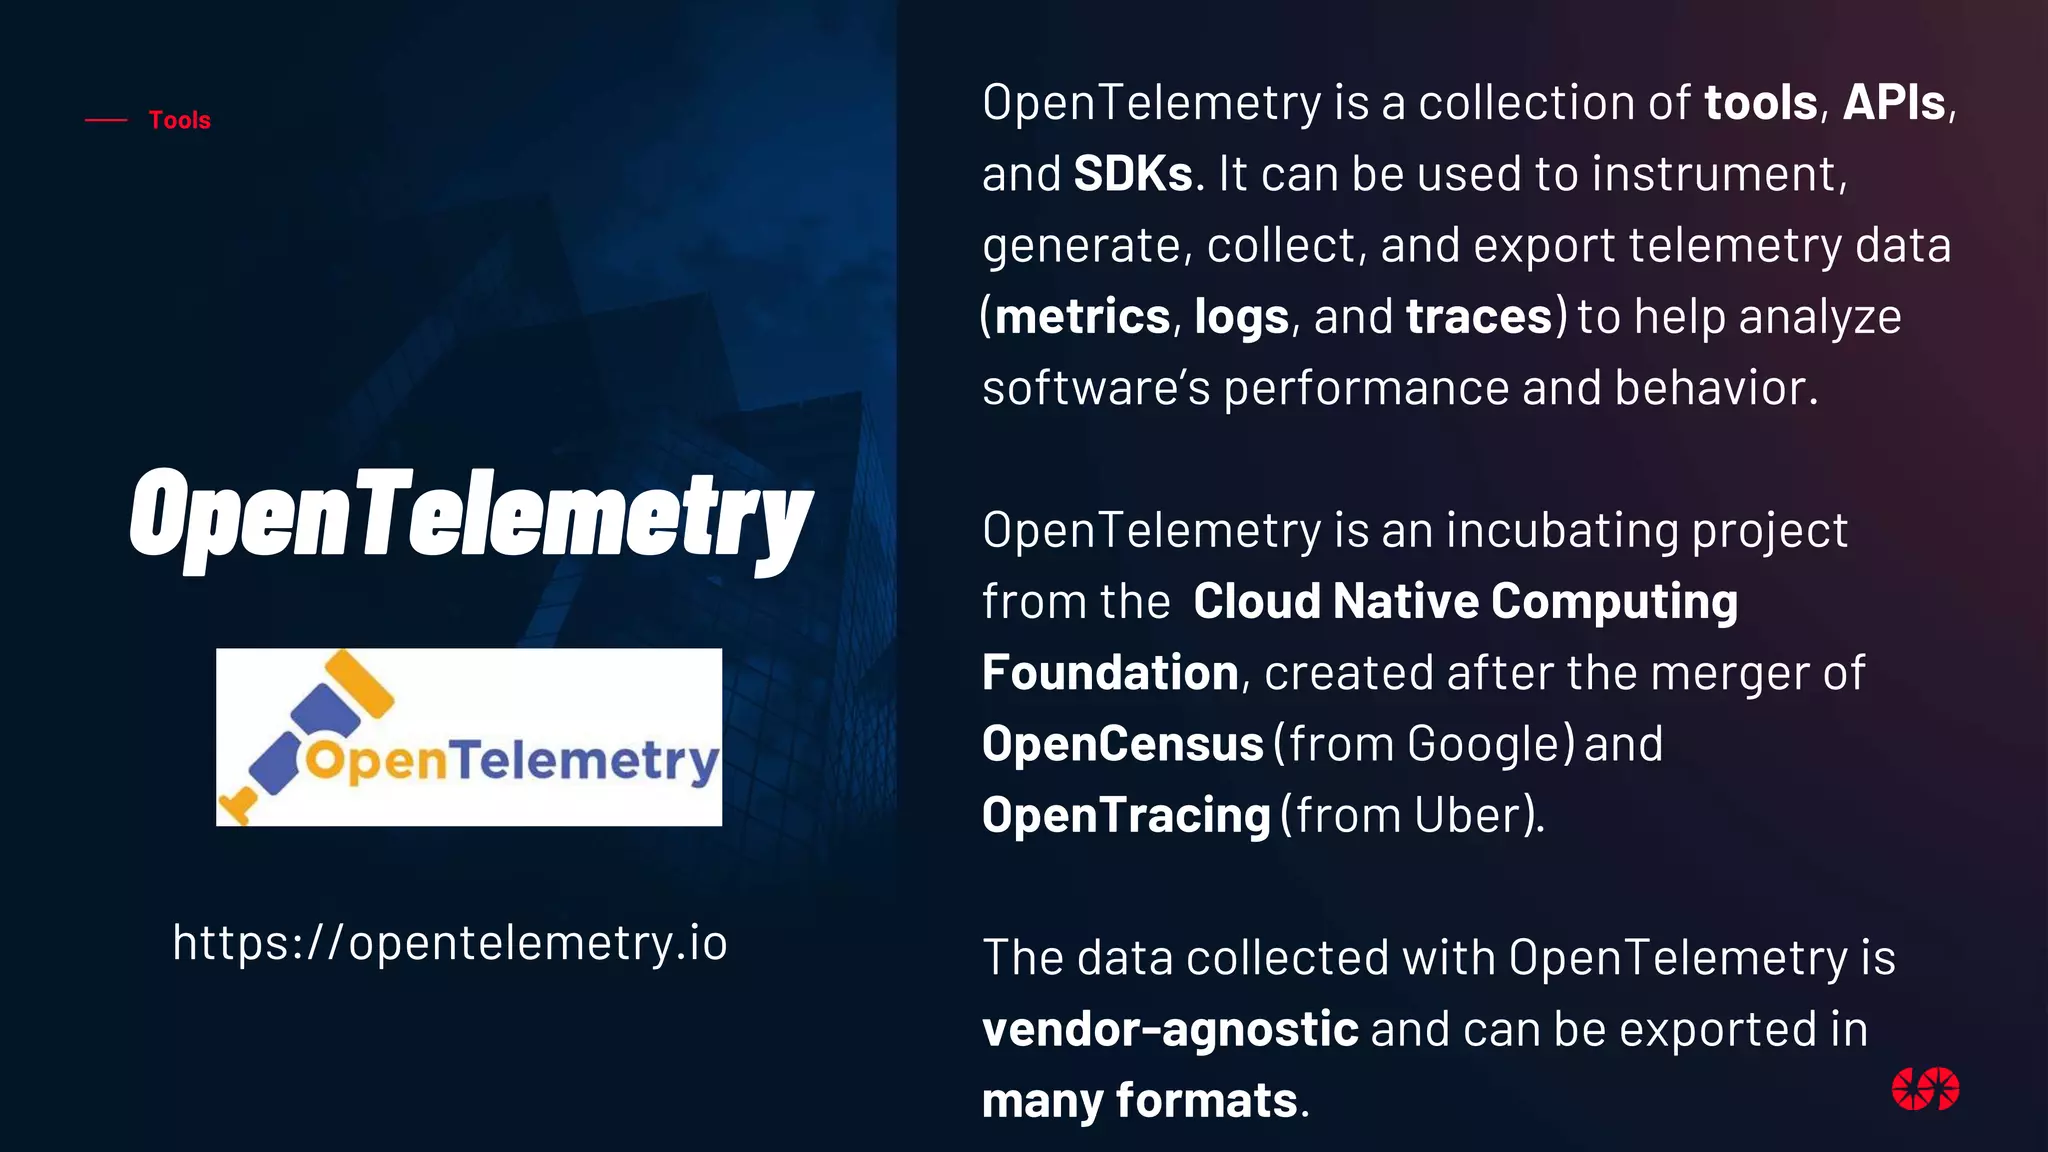
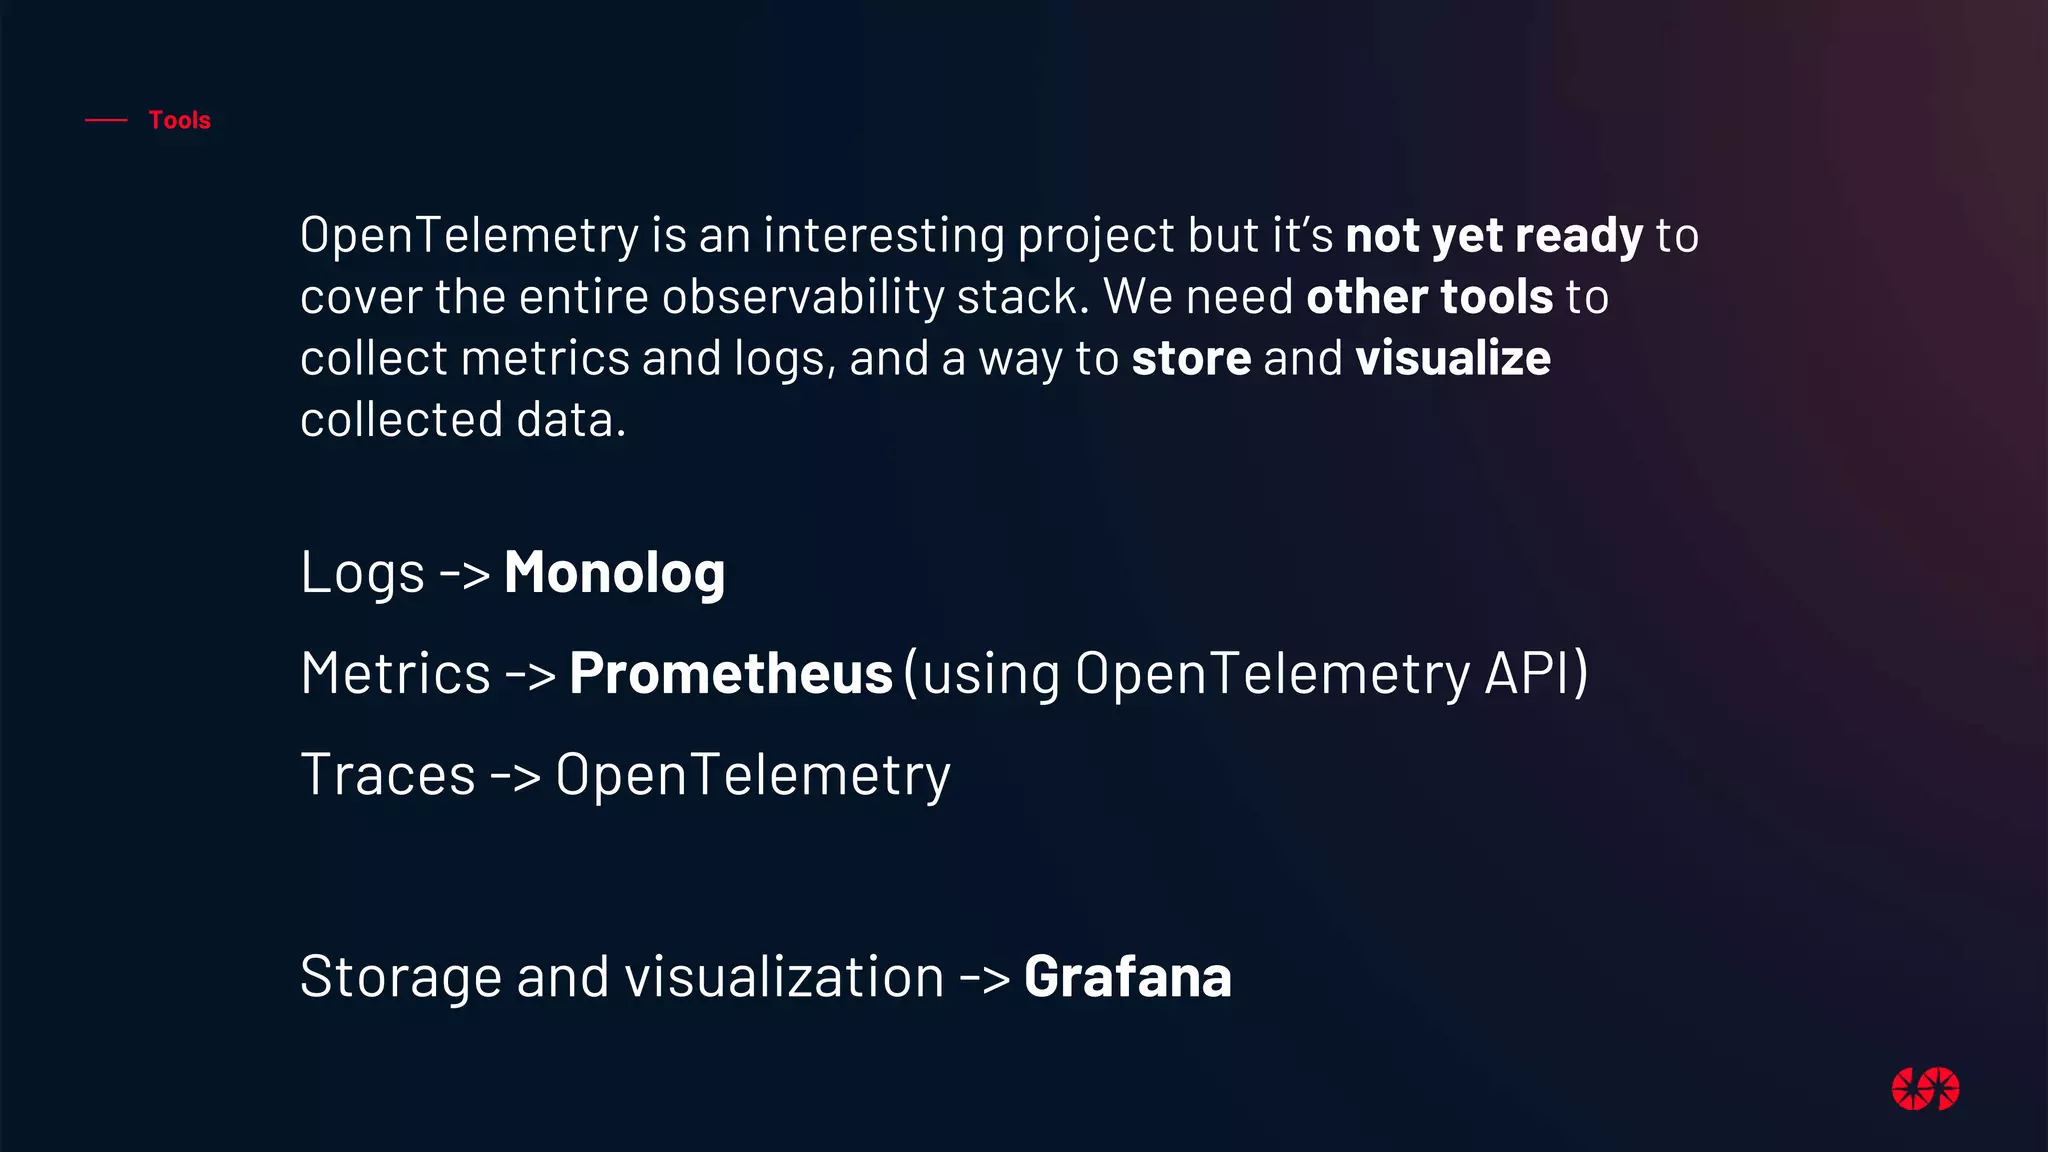
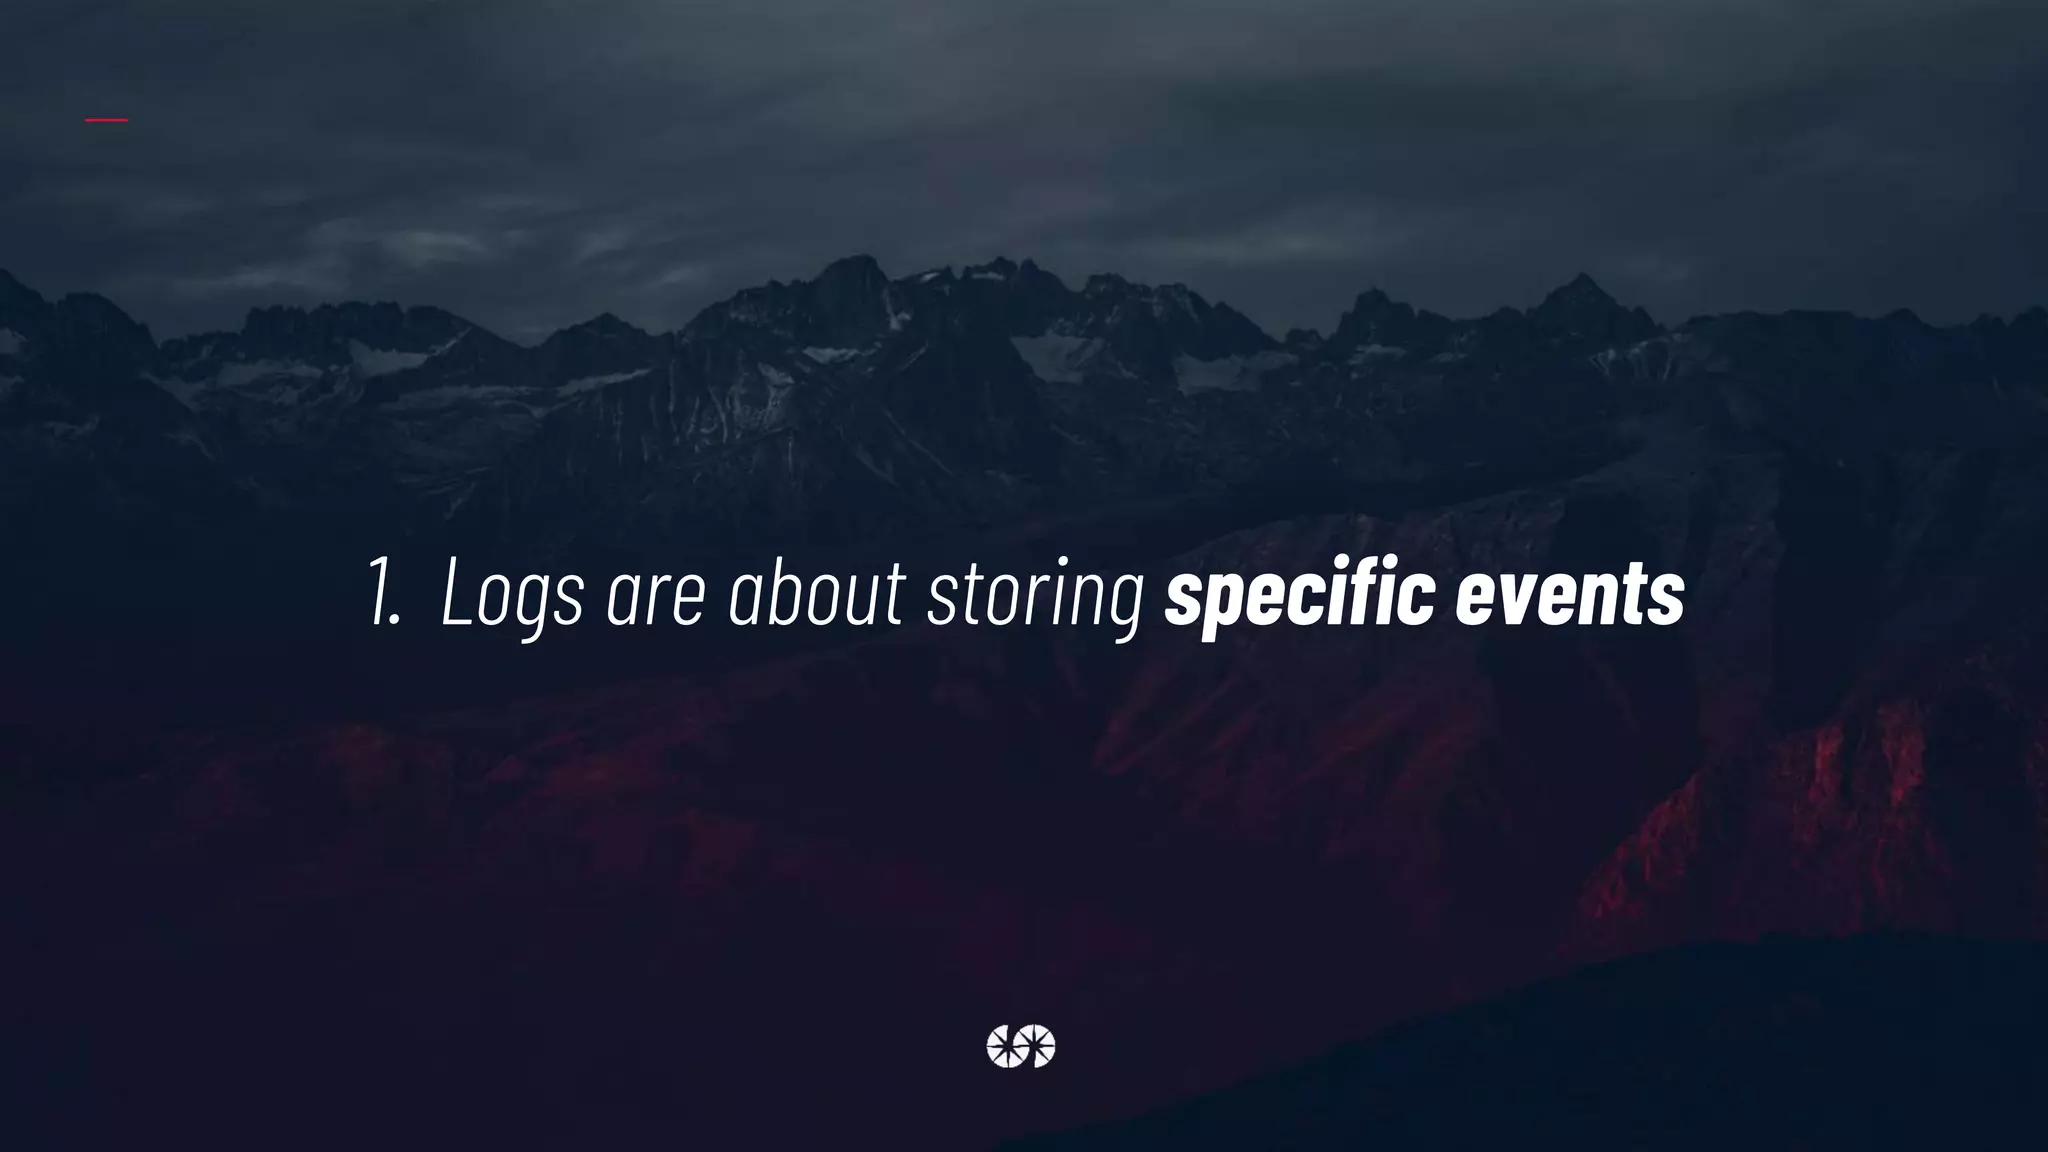
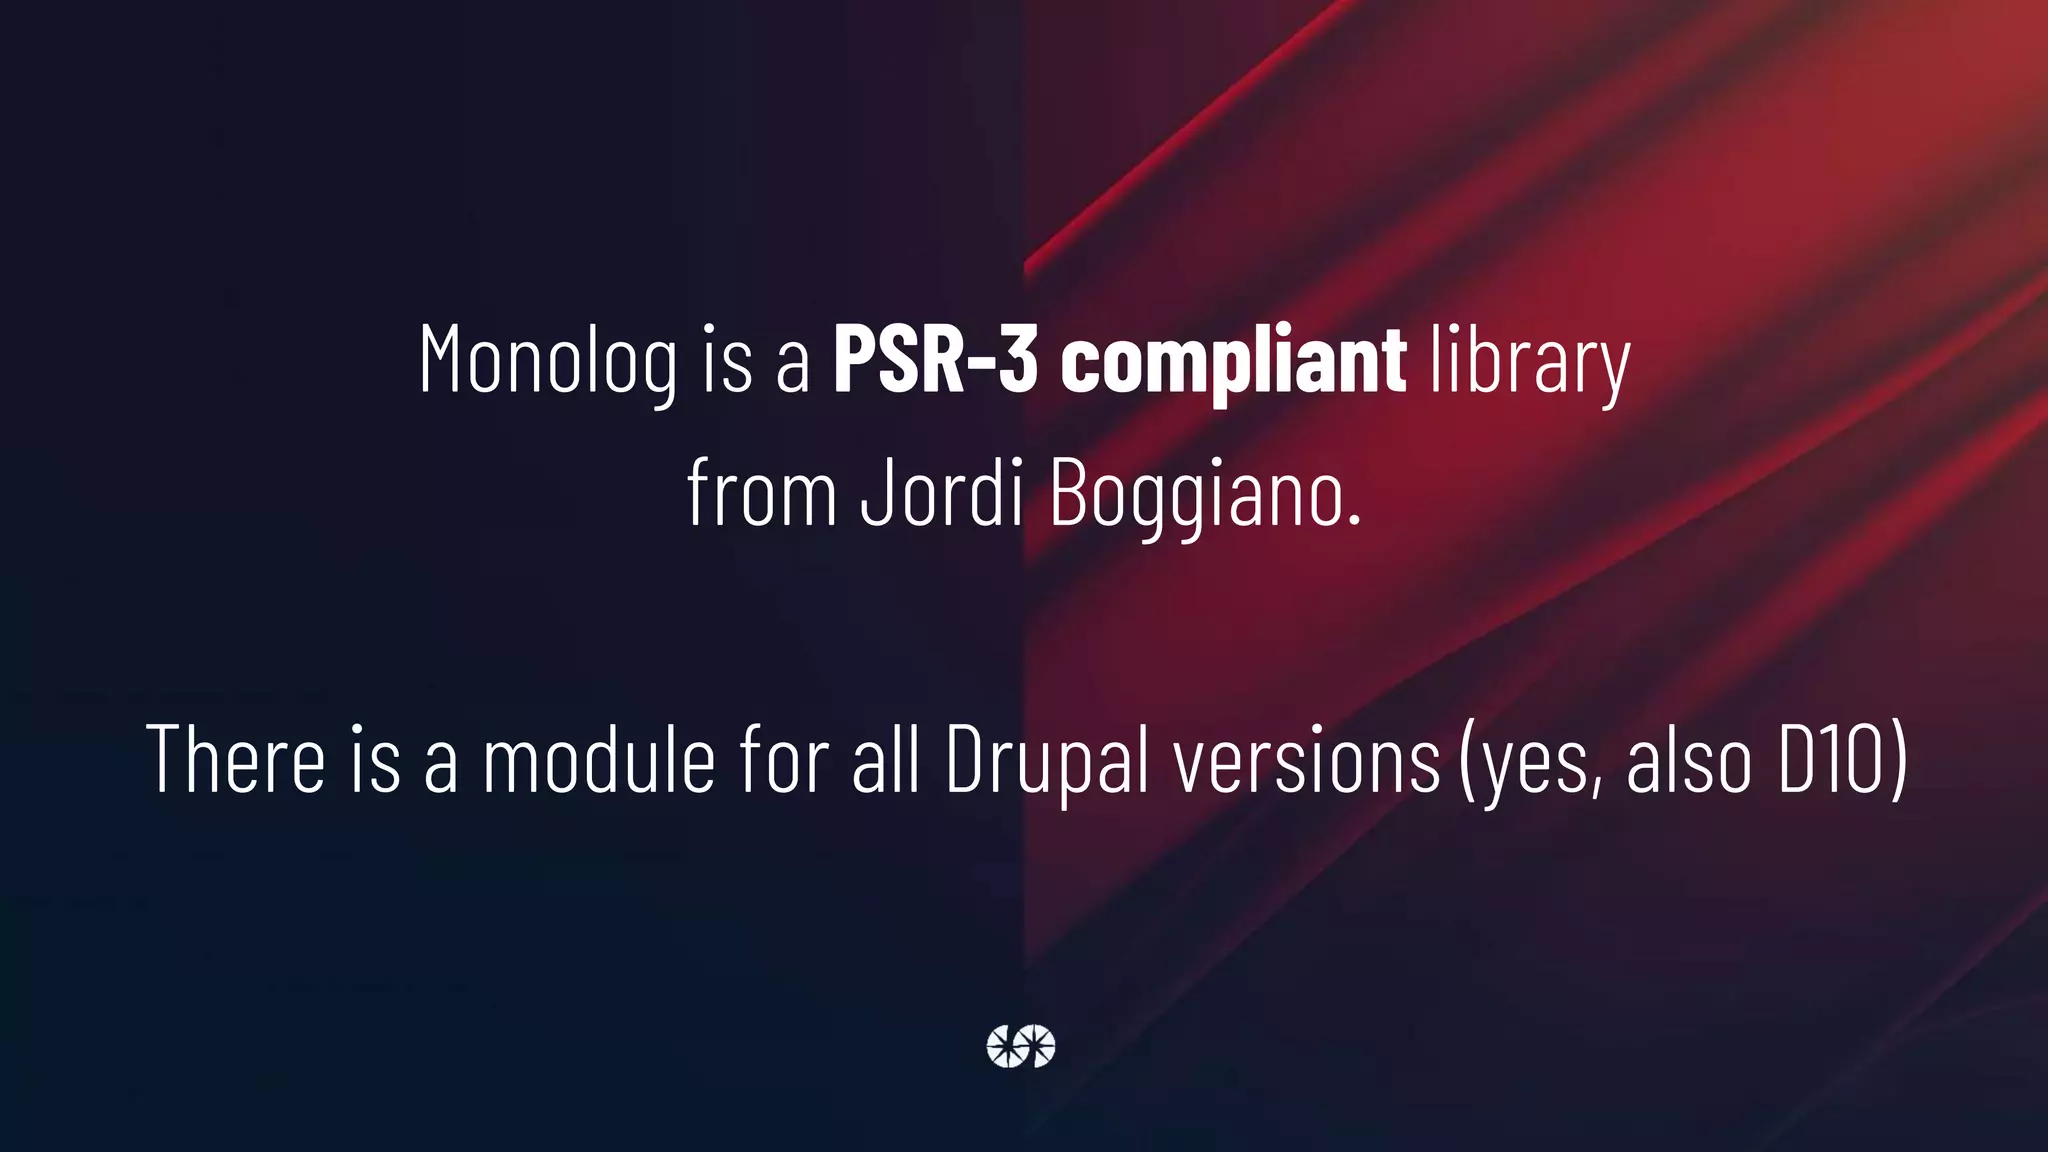
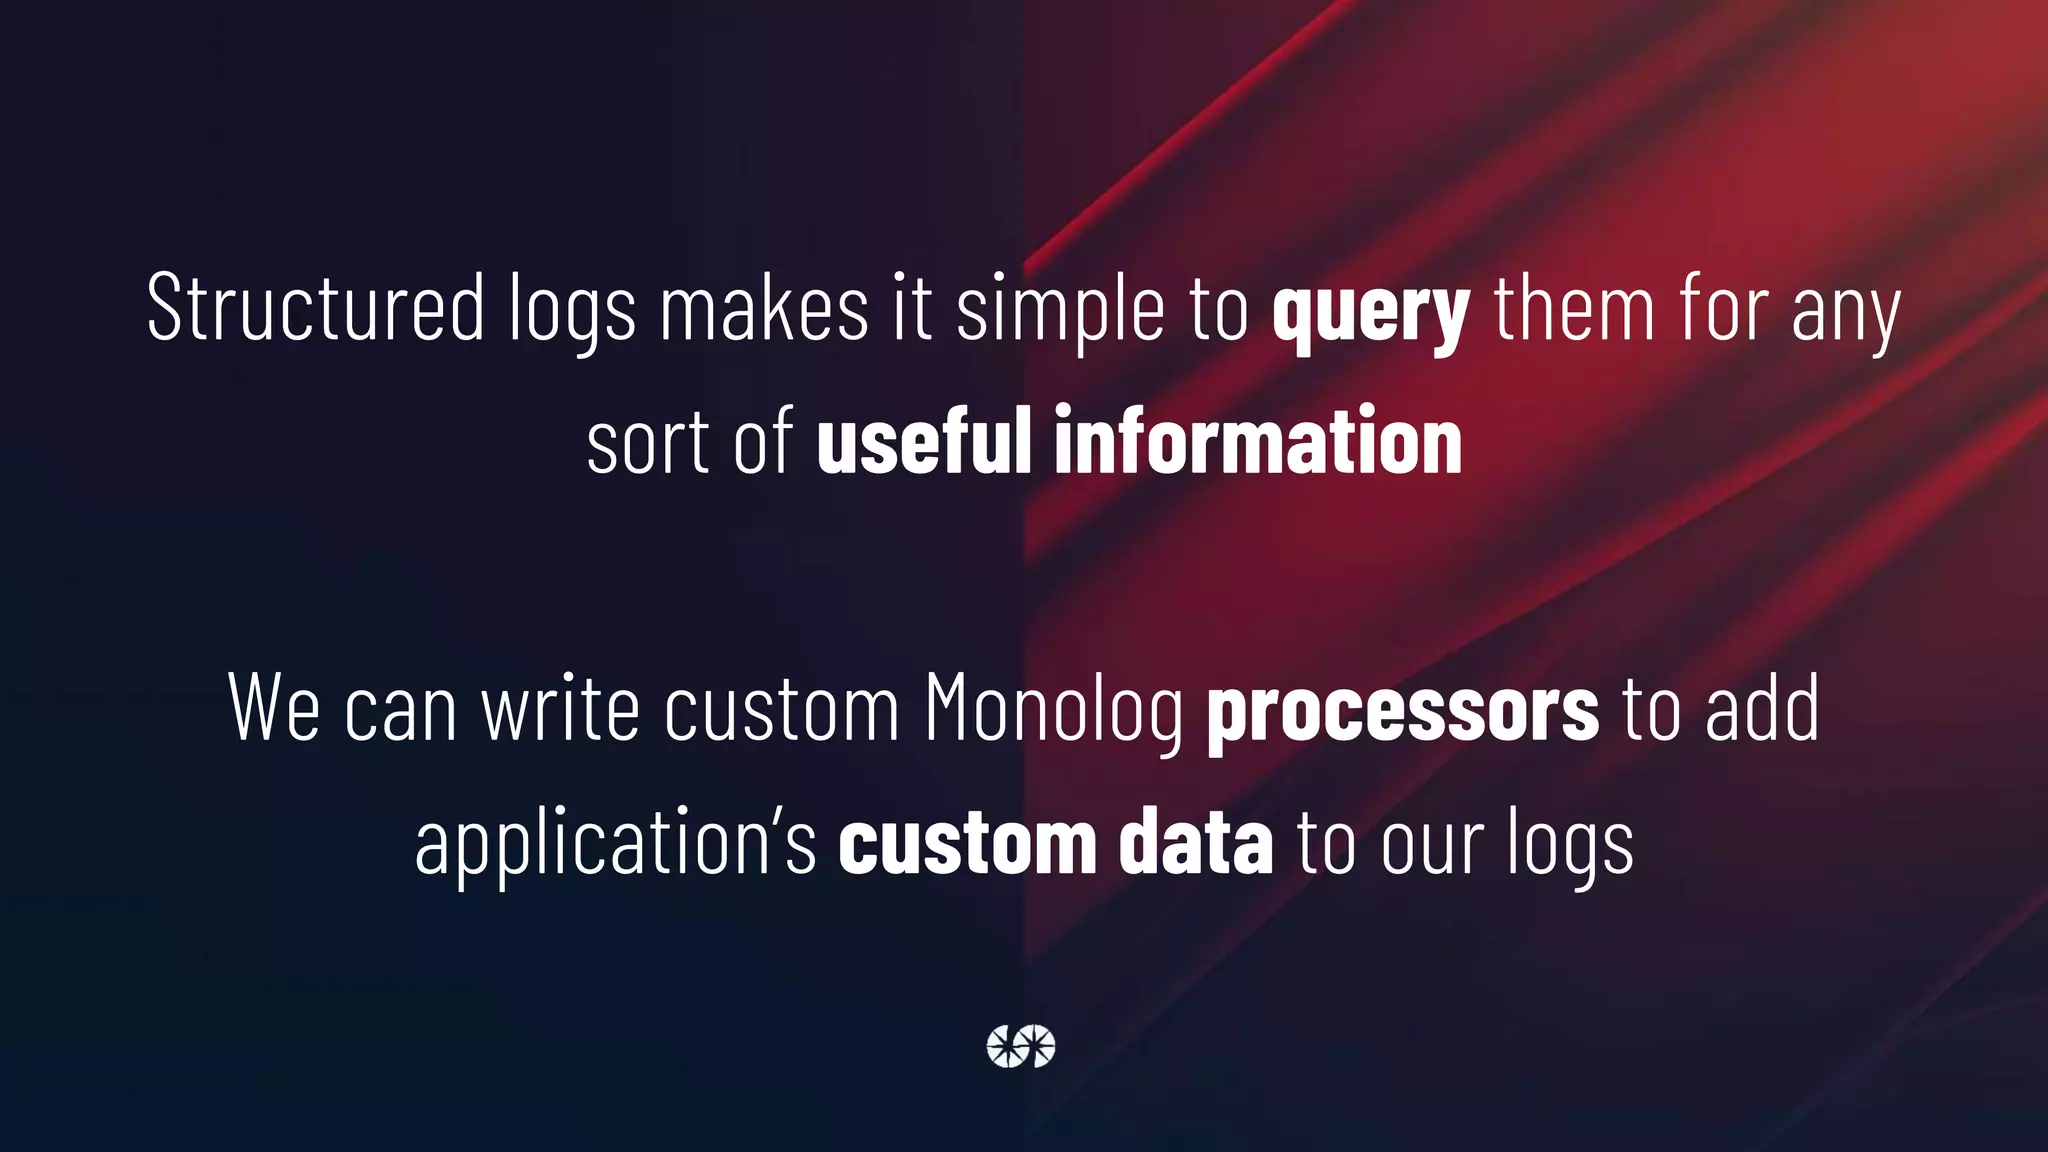
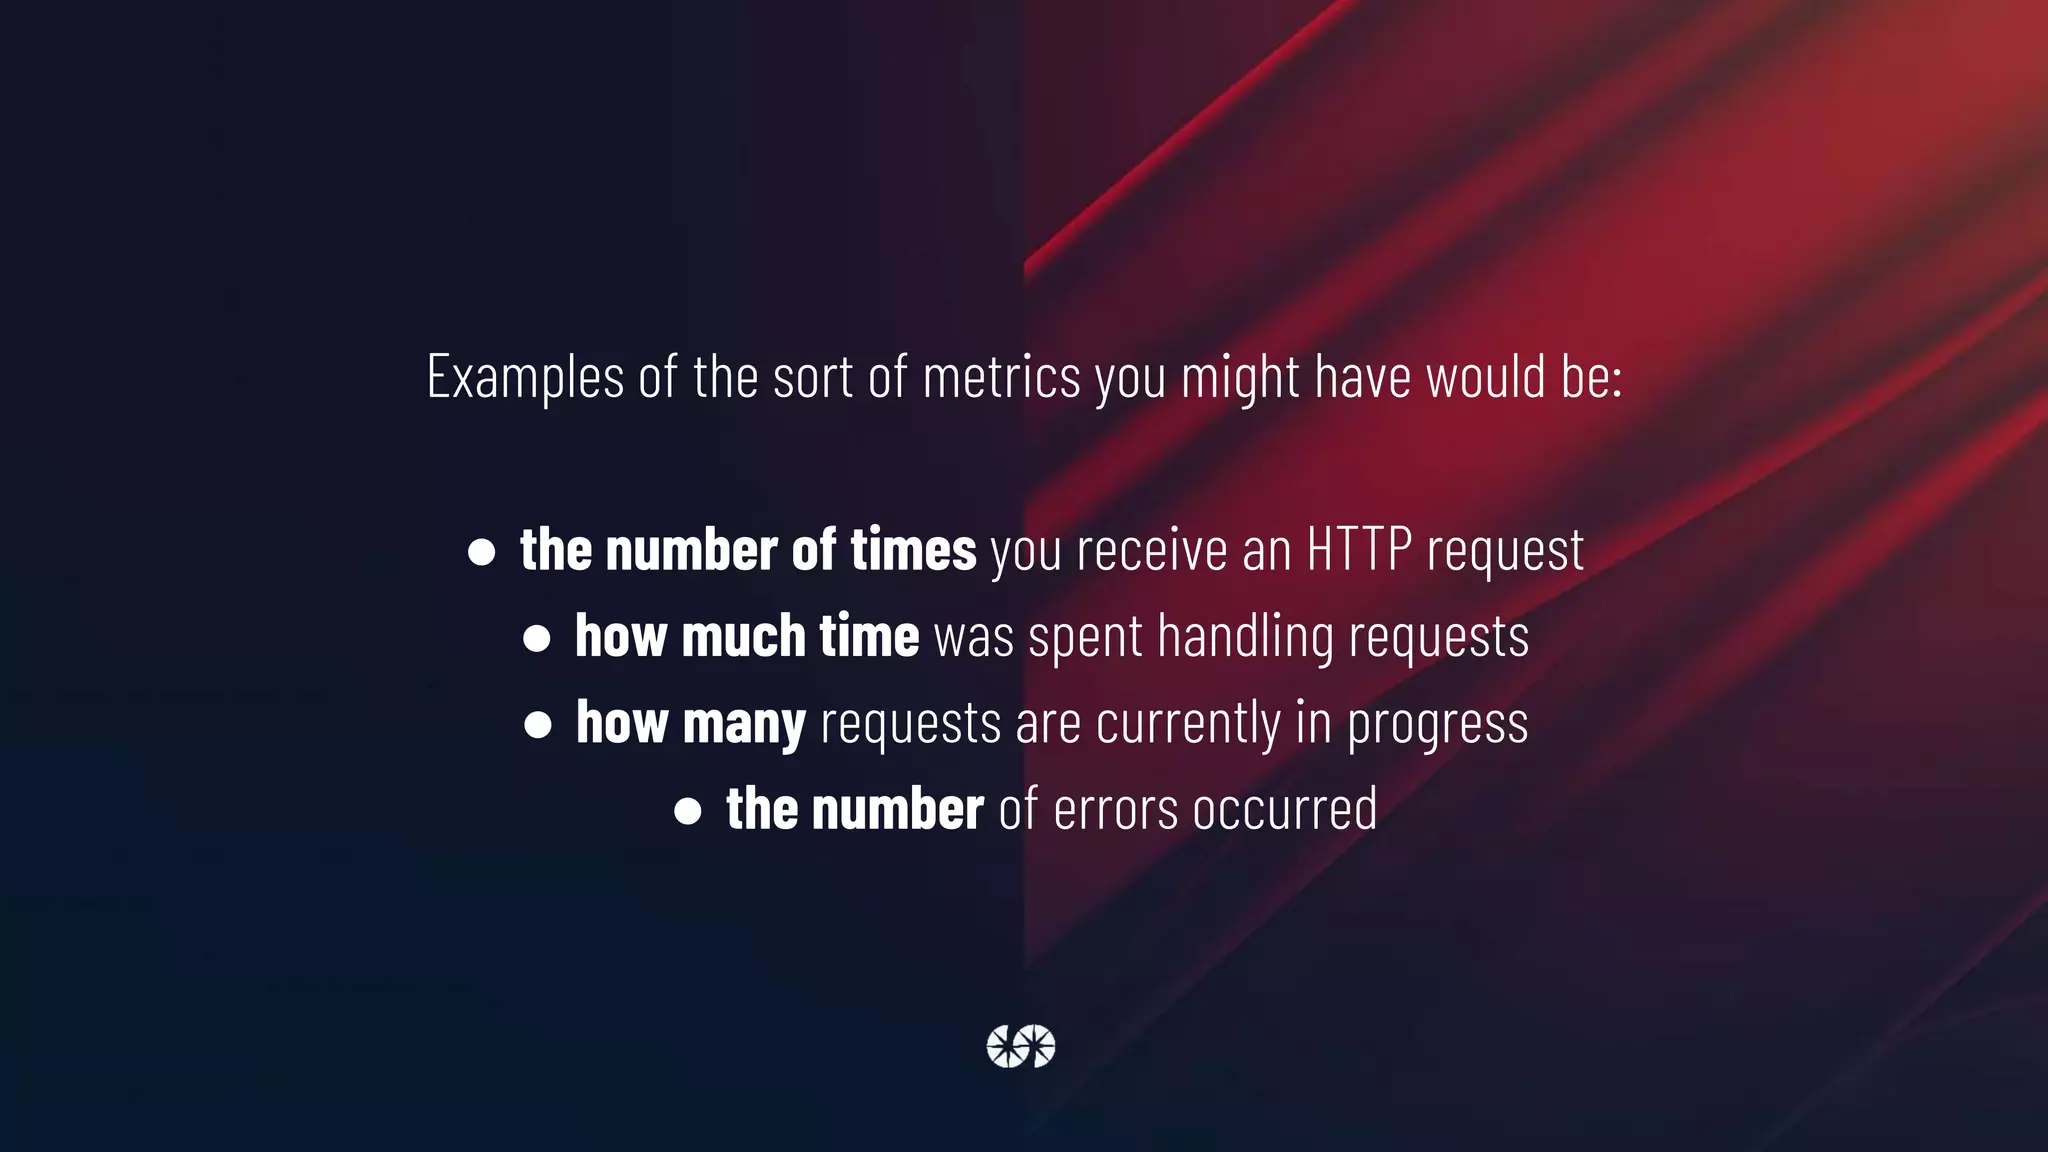
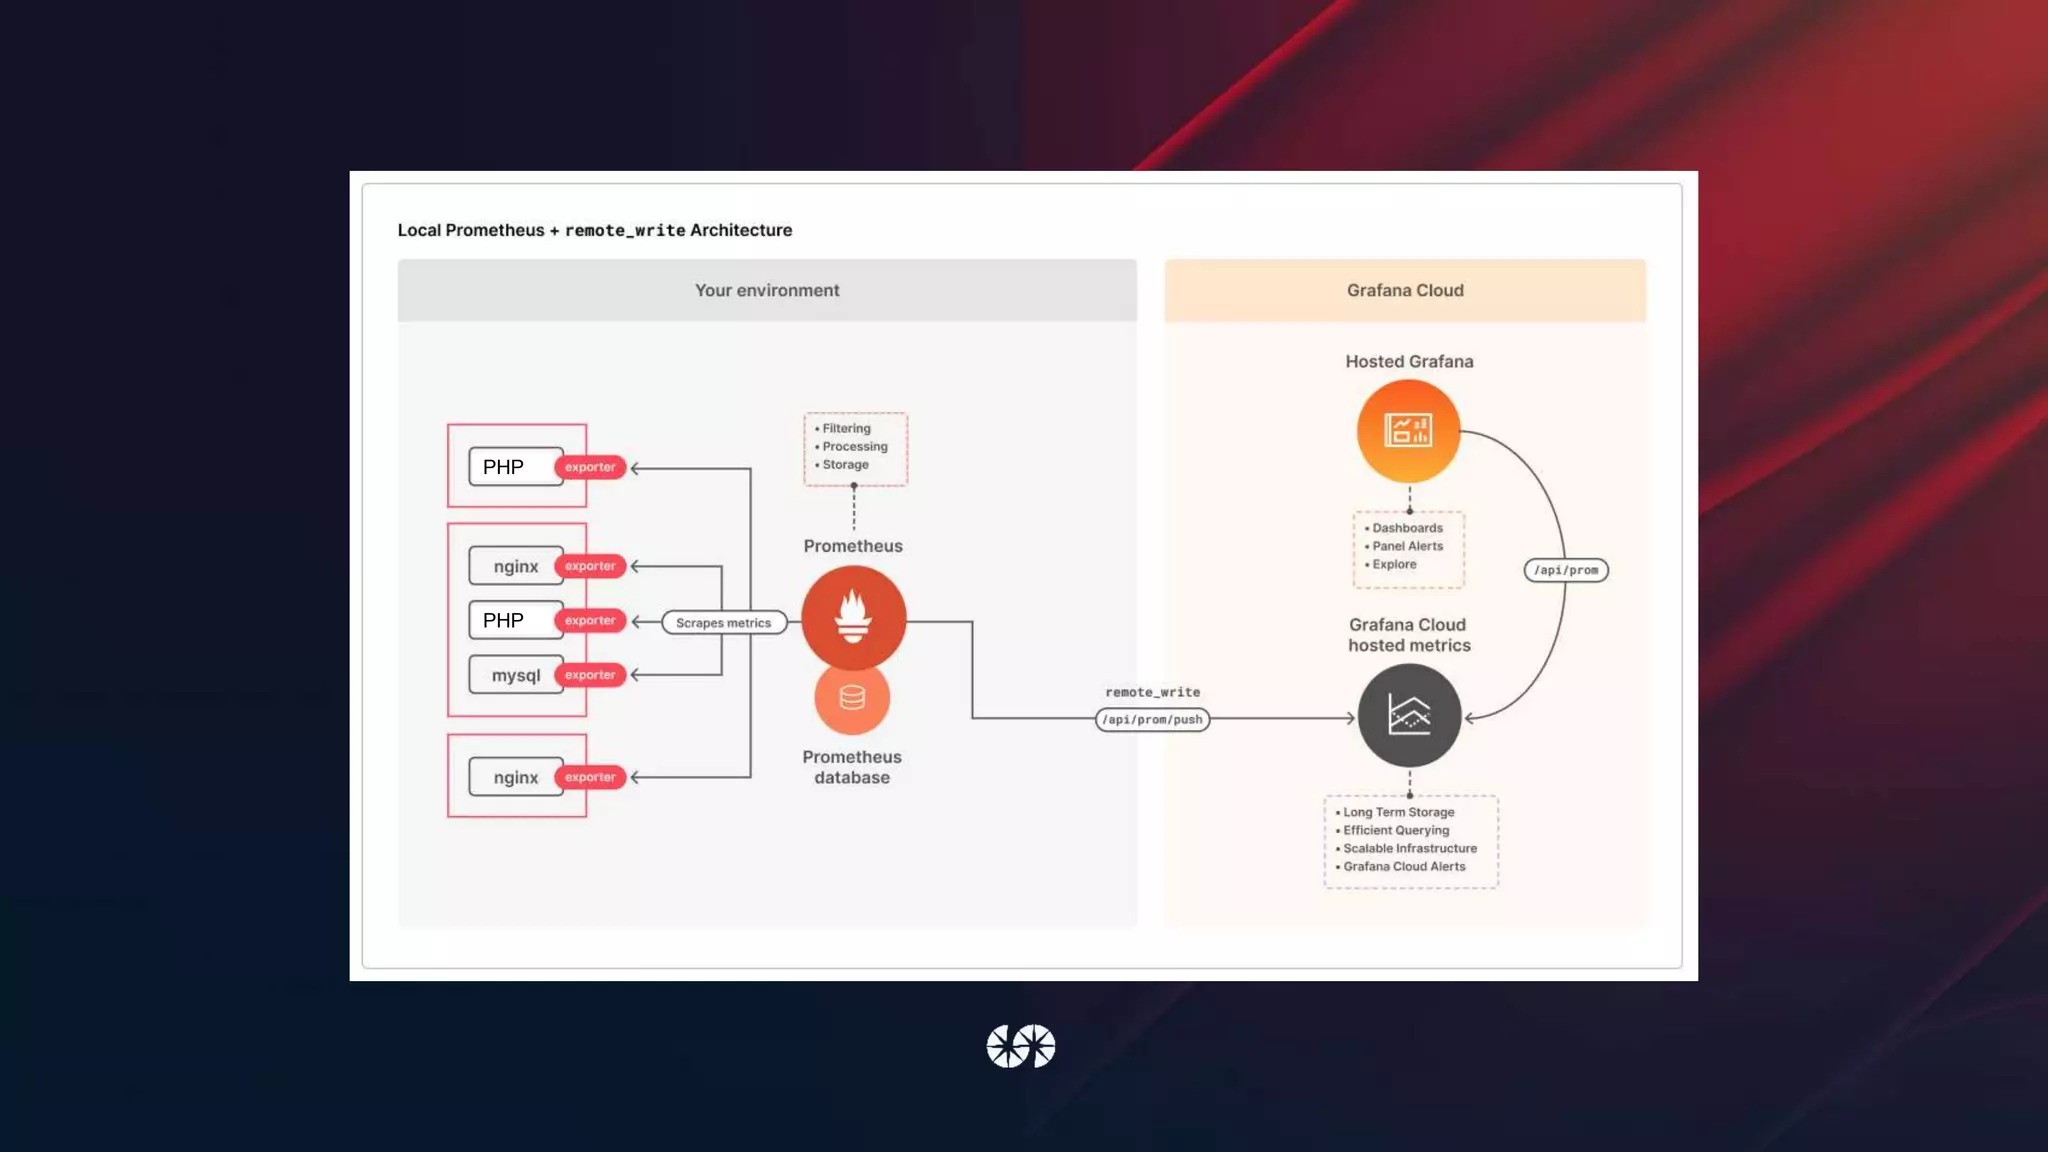
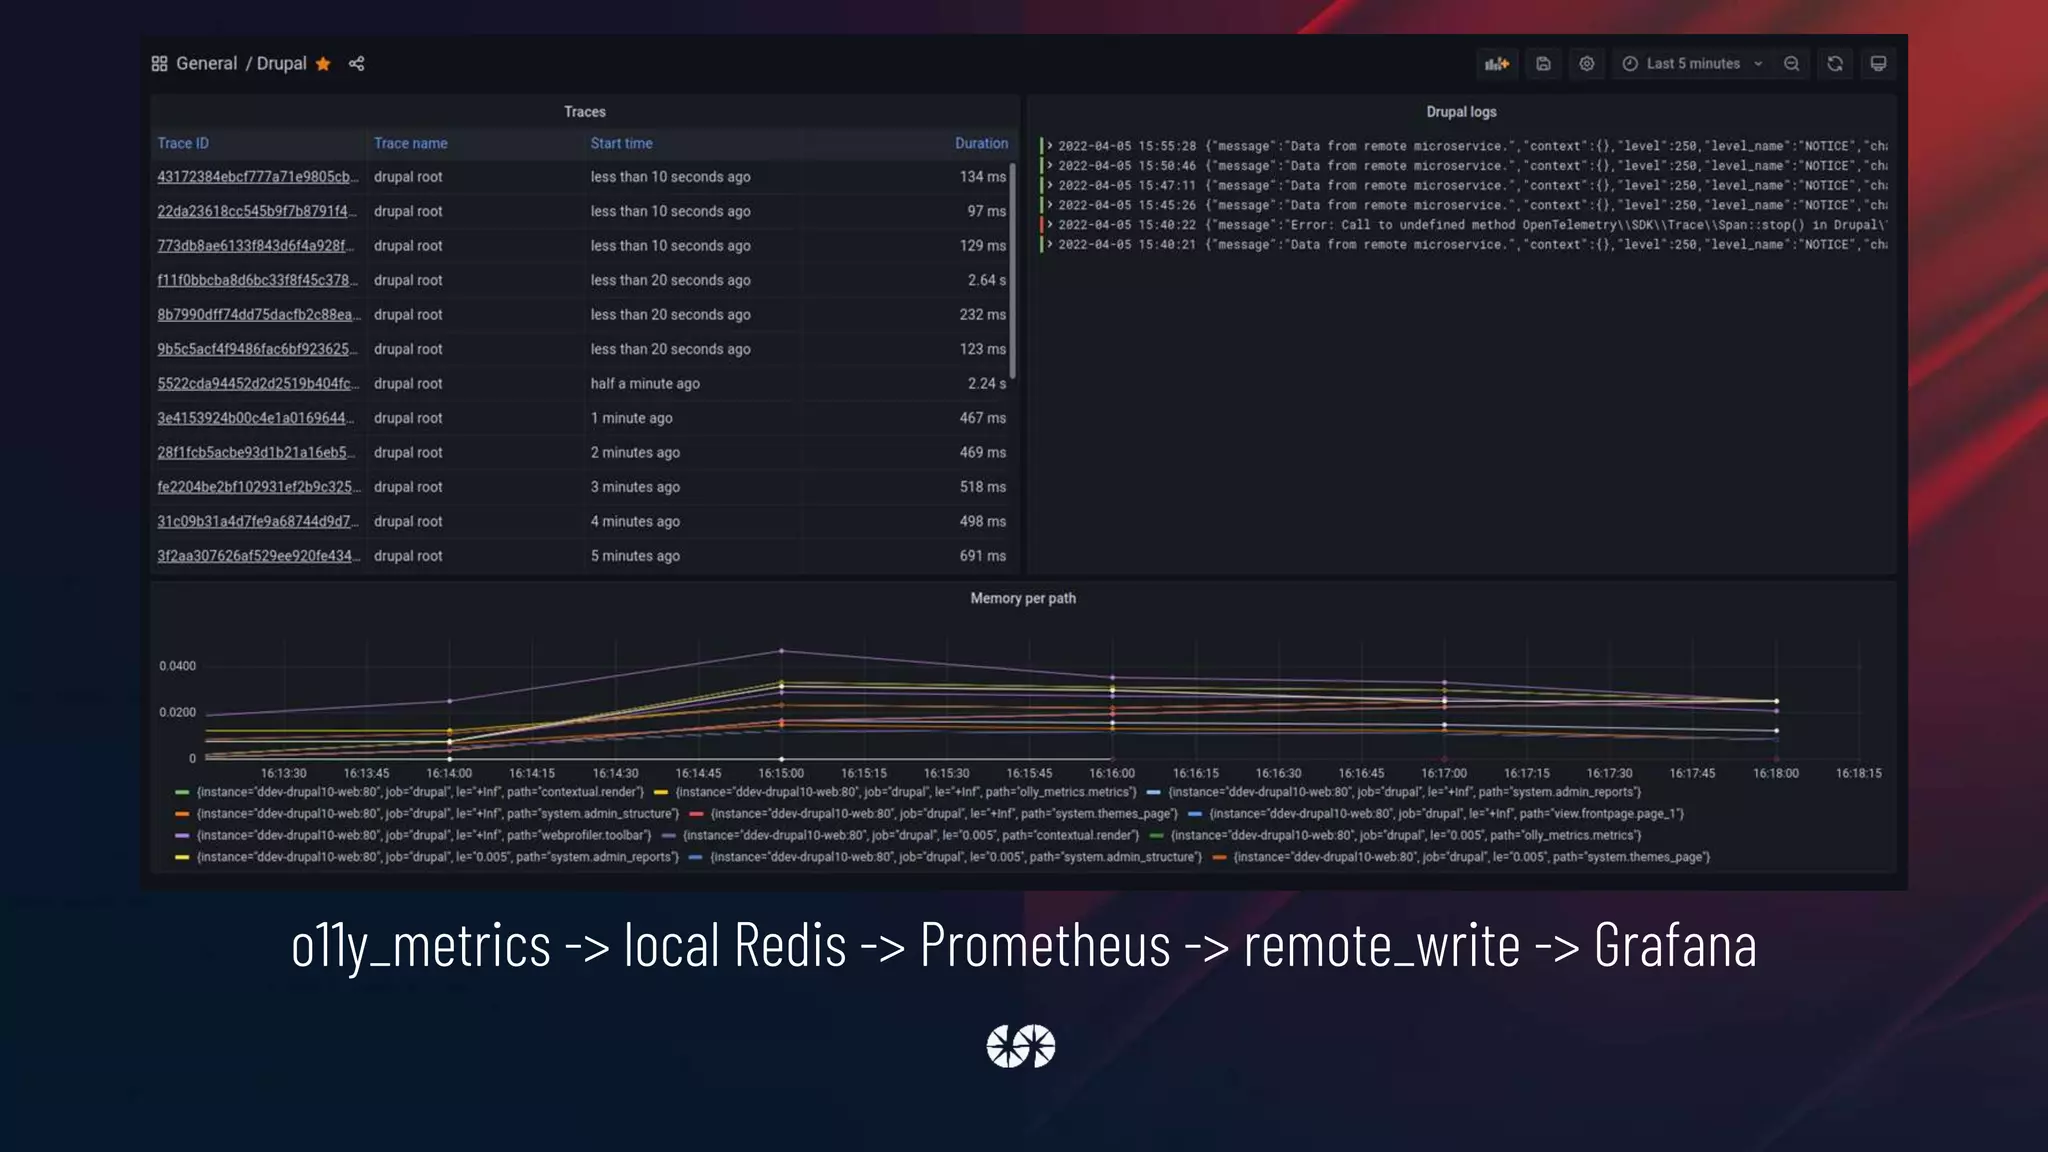
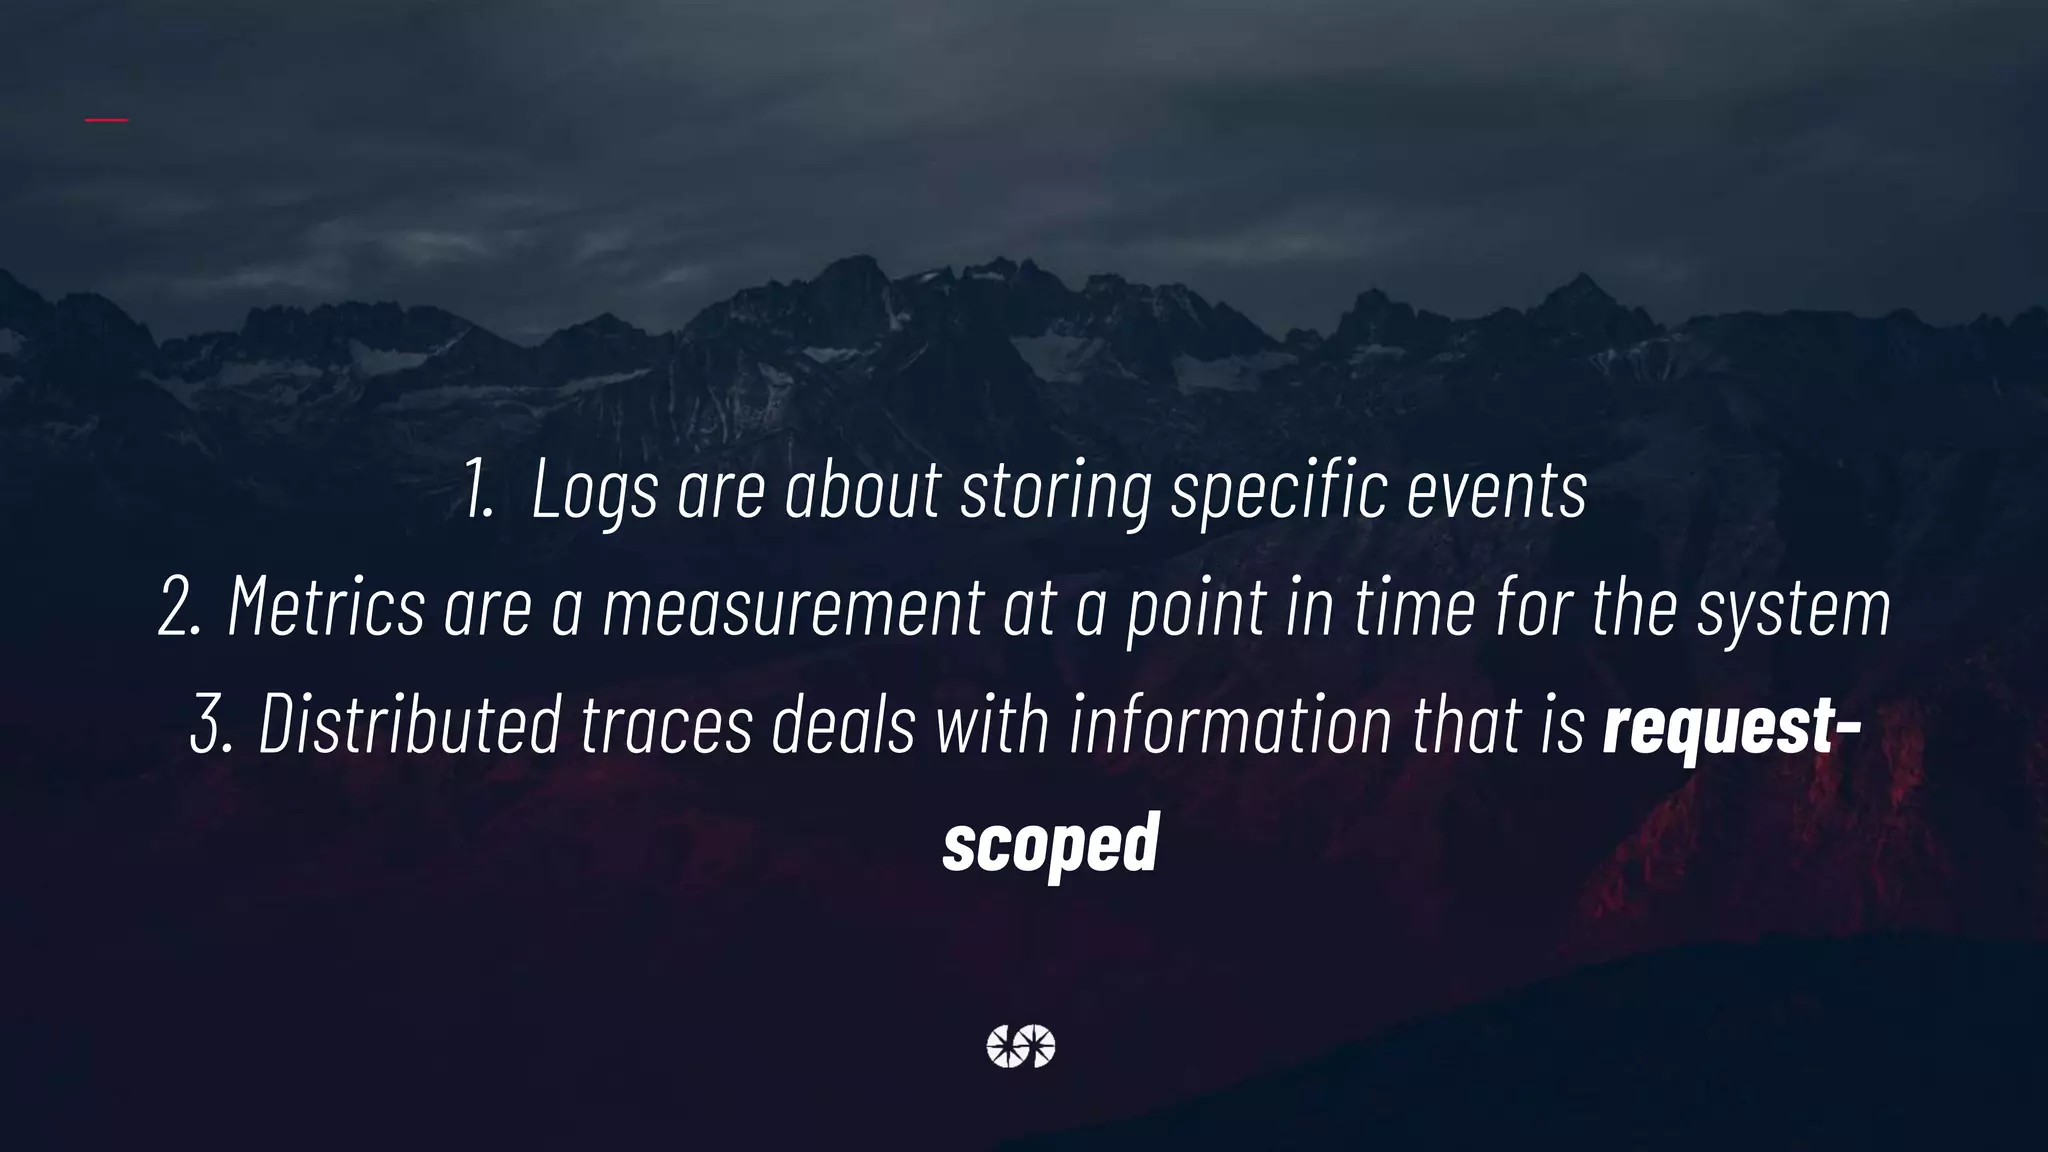
The document discusses the importance of observability in modern distributed systems, focusing on tools like OpenTelemetry, Monolog, Prometheus, and Grafana for logging, metrics, and tracing. It outlines the need for structured logs, metrics, and distributed traces to effectively monitor and analyze application performance, especially in cloud-native environments. Additionally, it highlights the integration of these tools within Drupal applications to enhance observability capabilities.