Download as PDF, PPTX

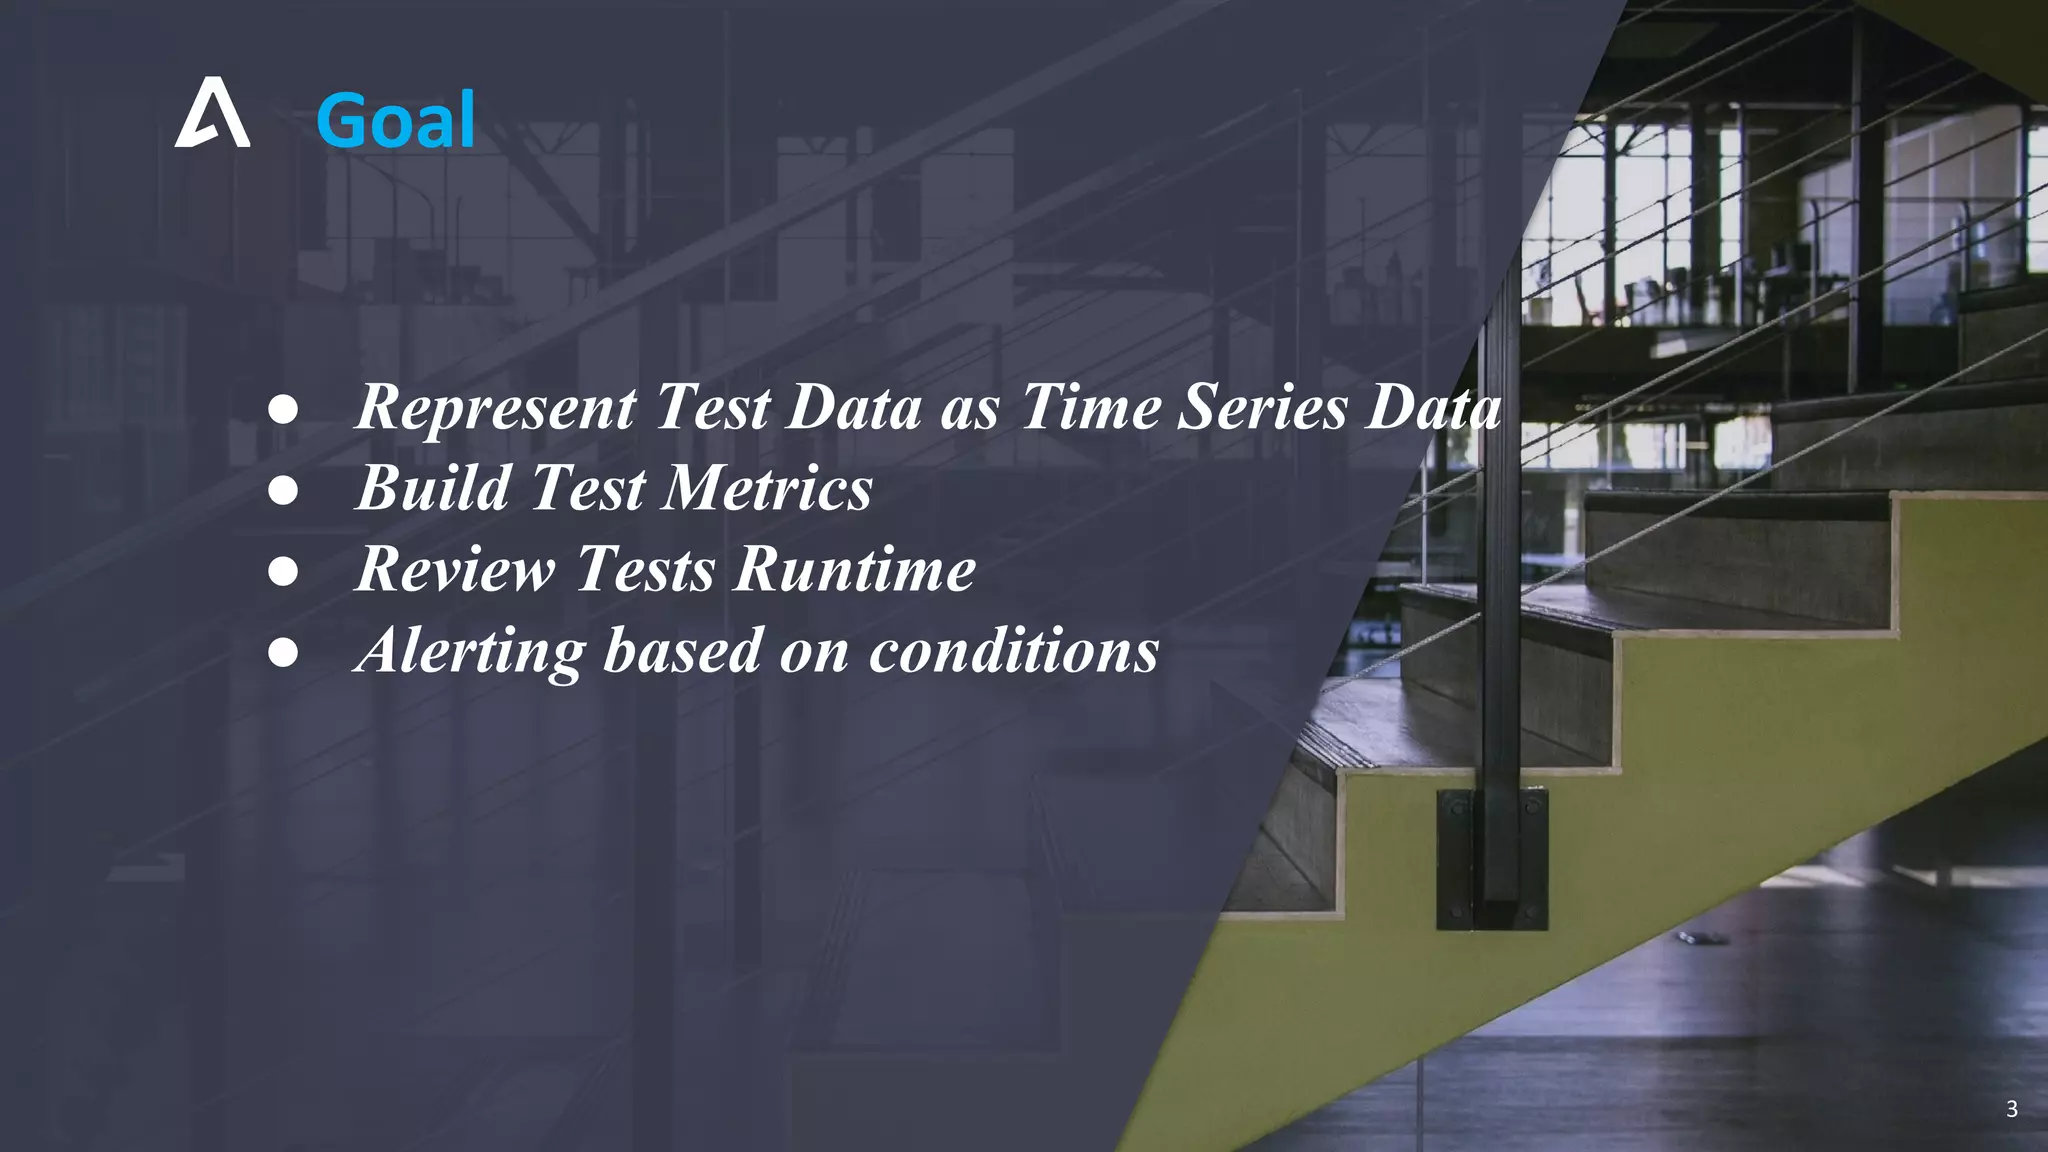

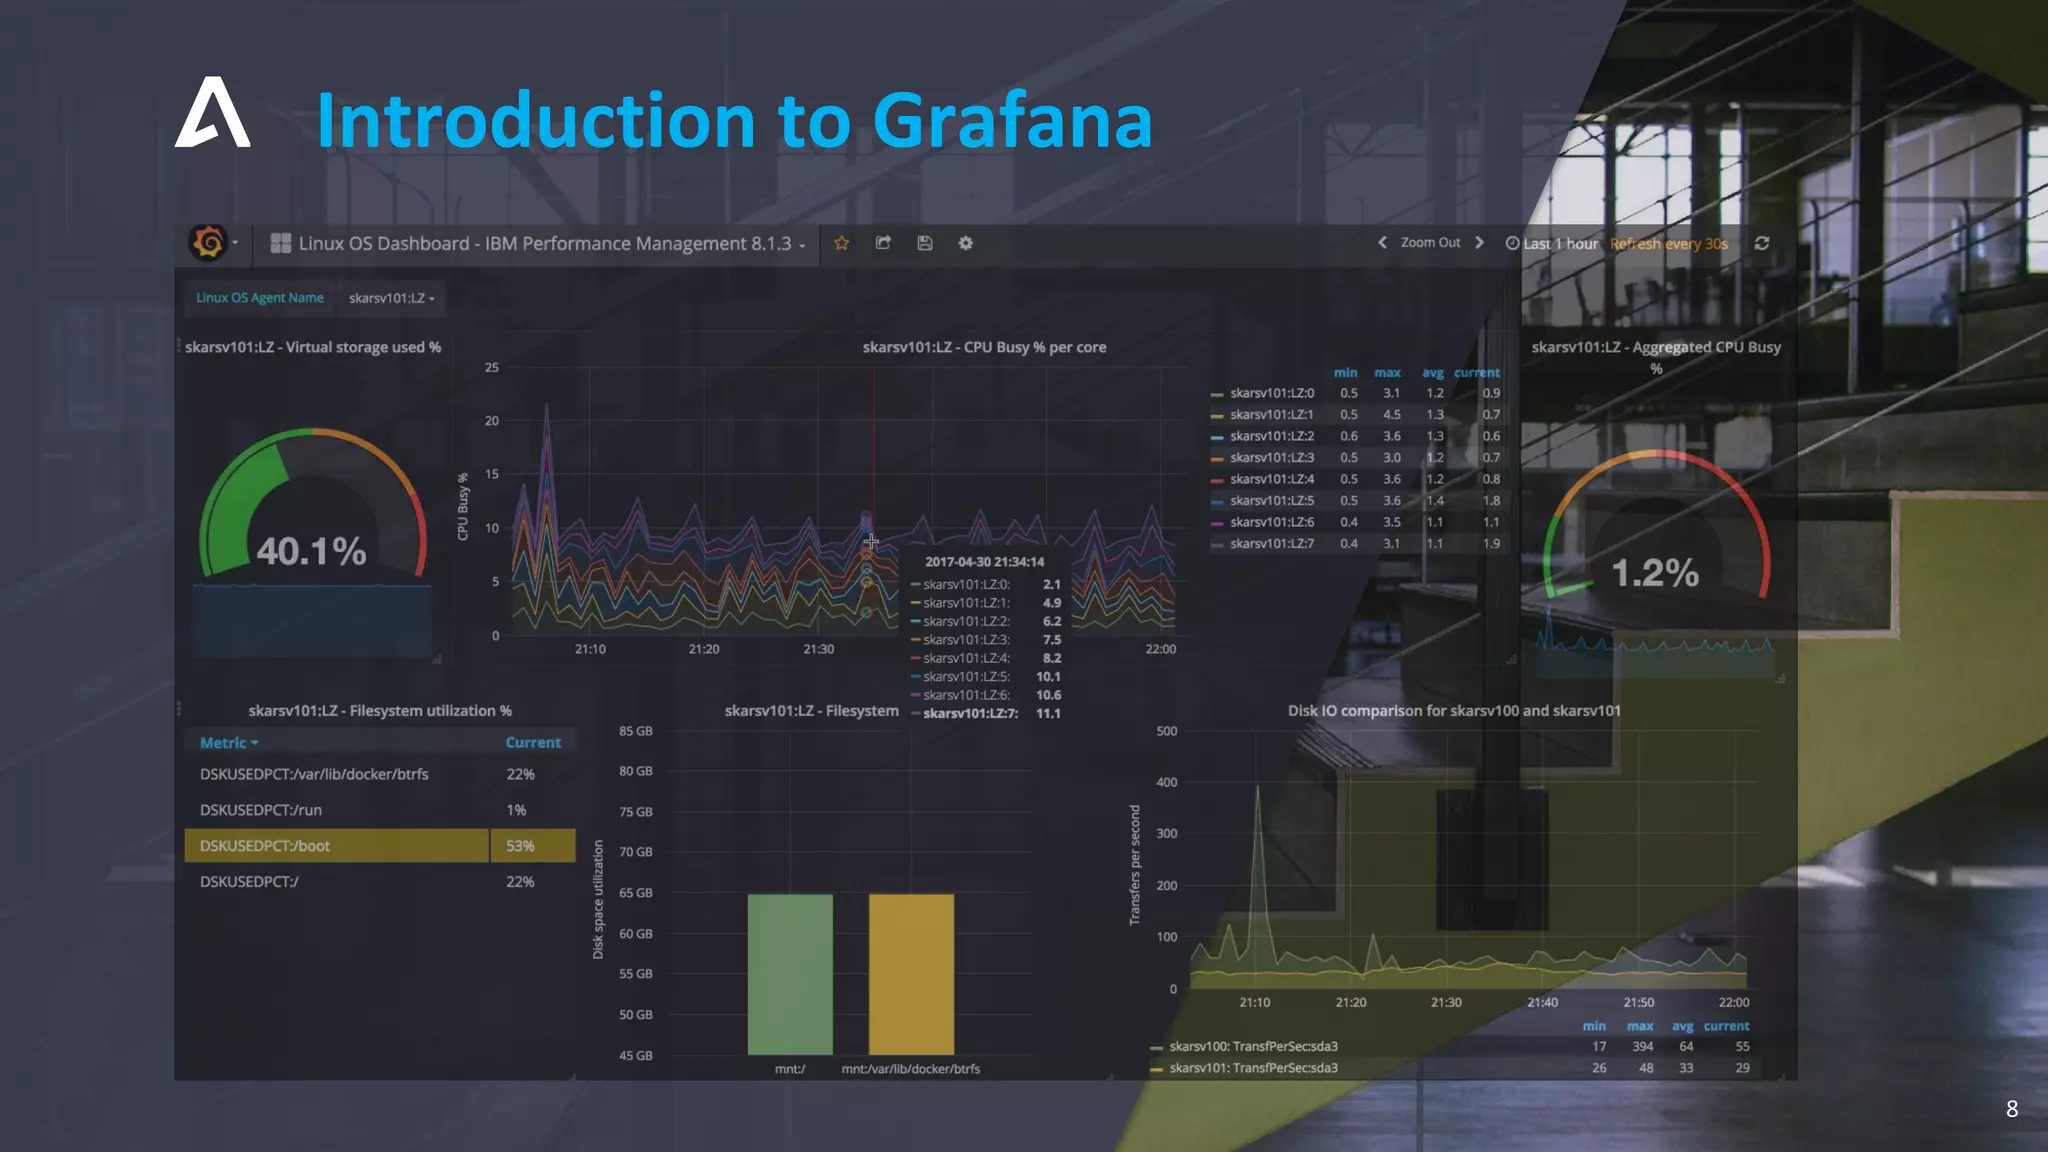
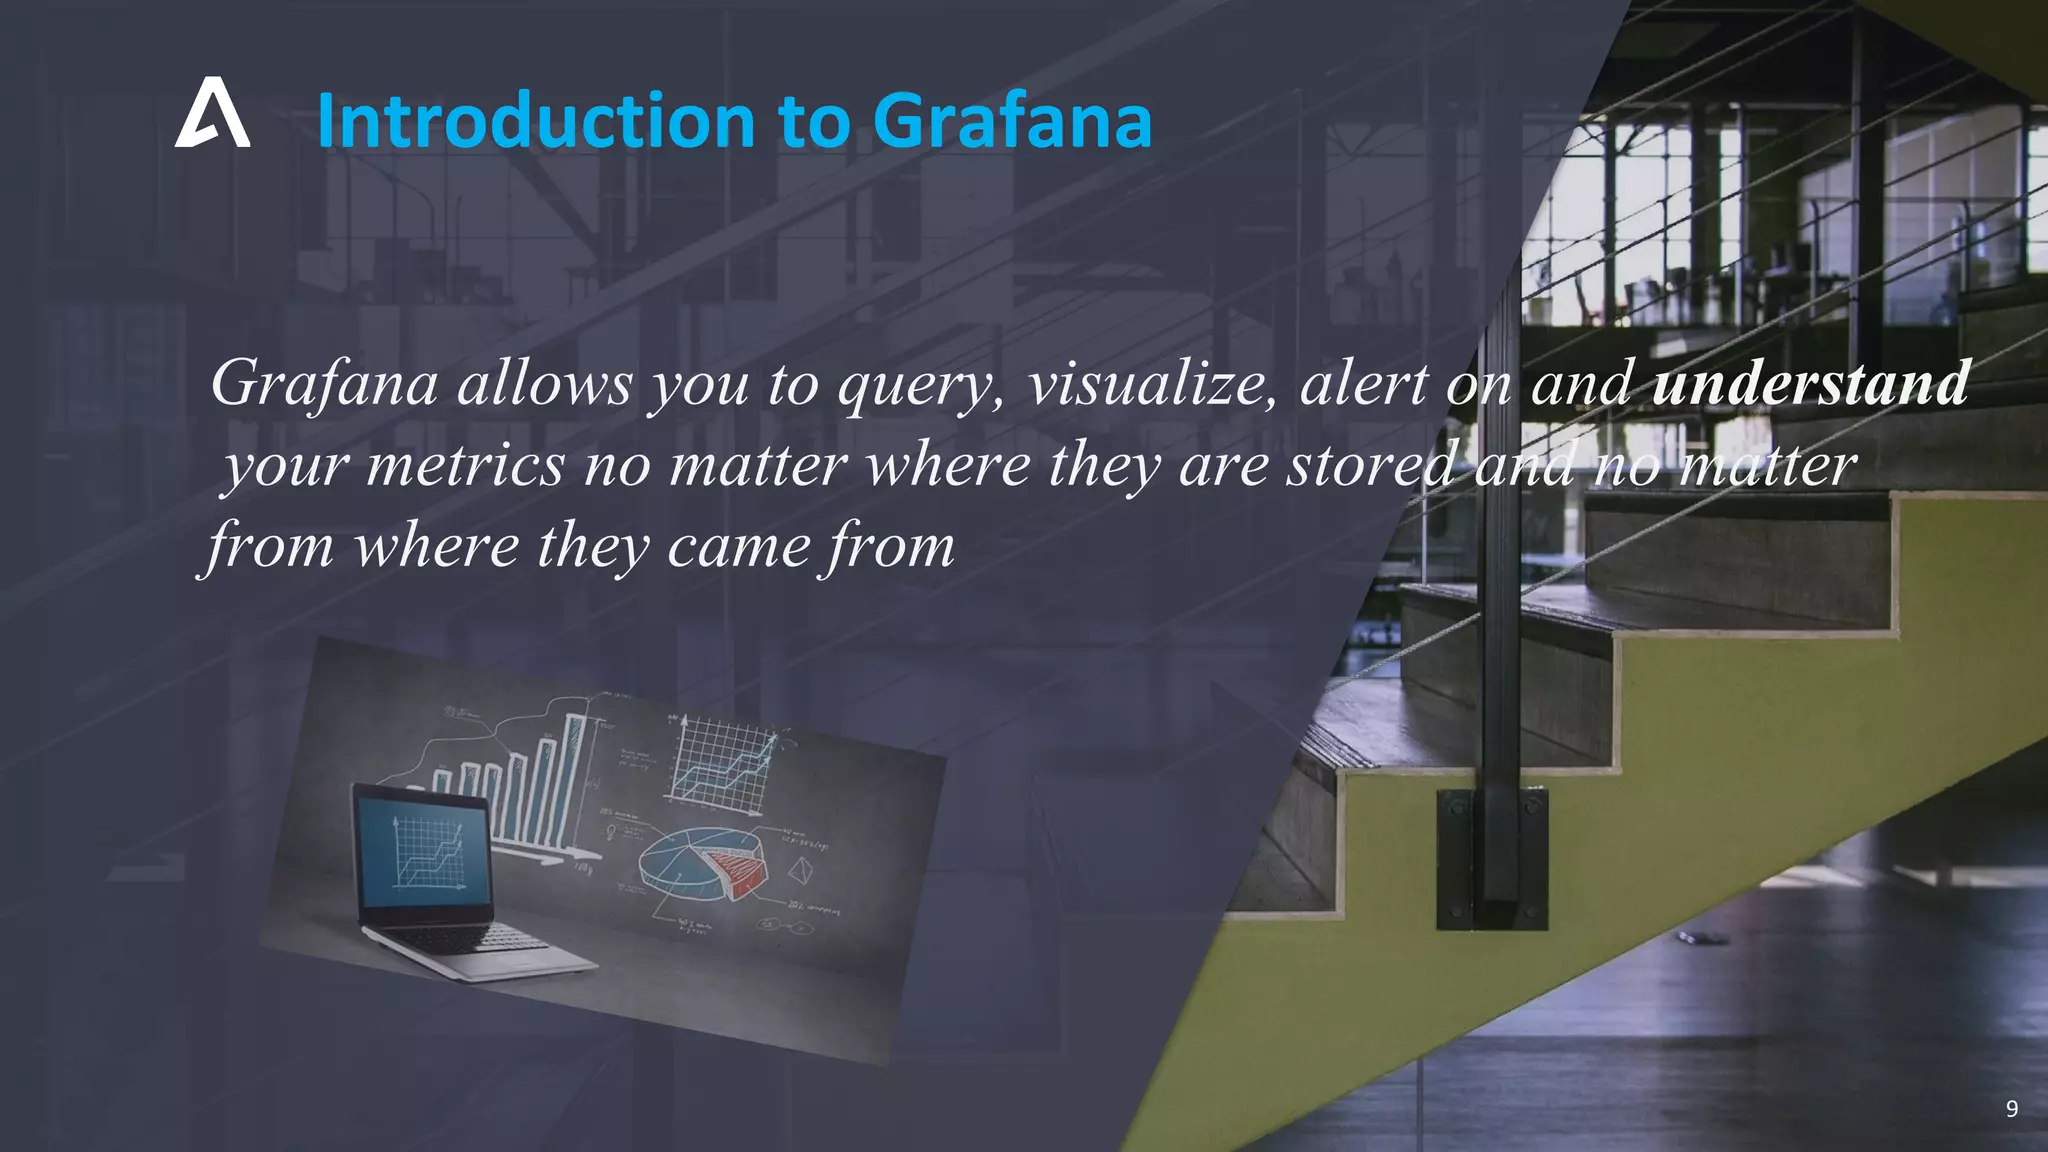
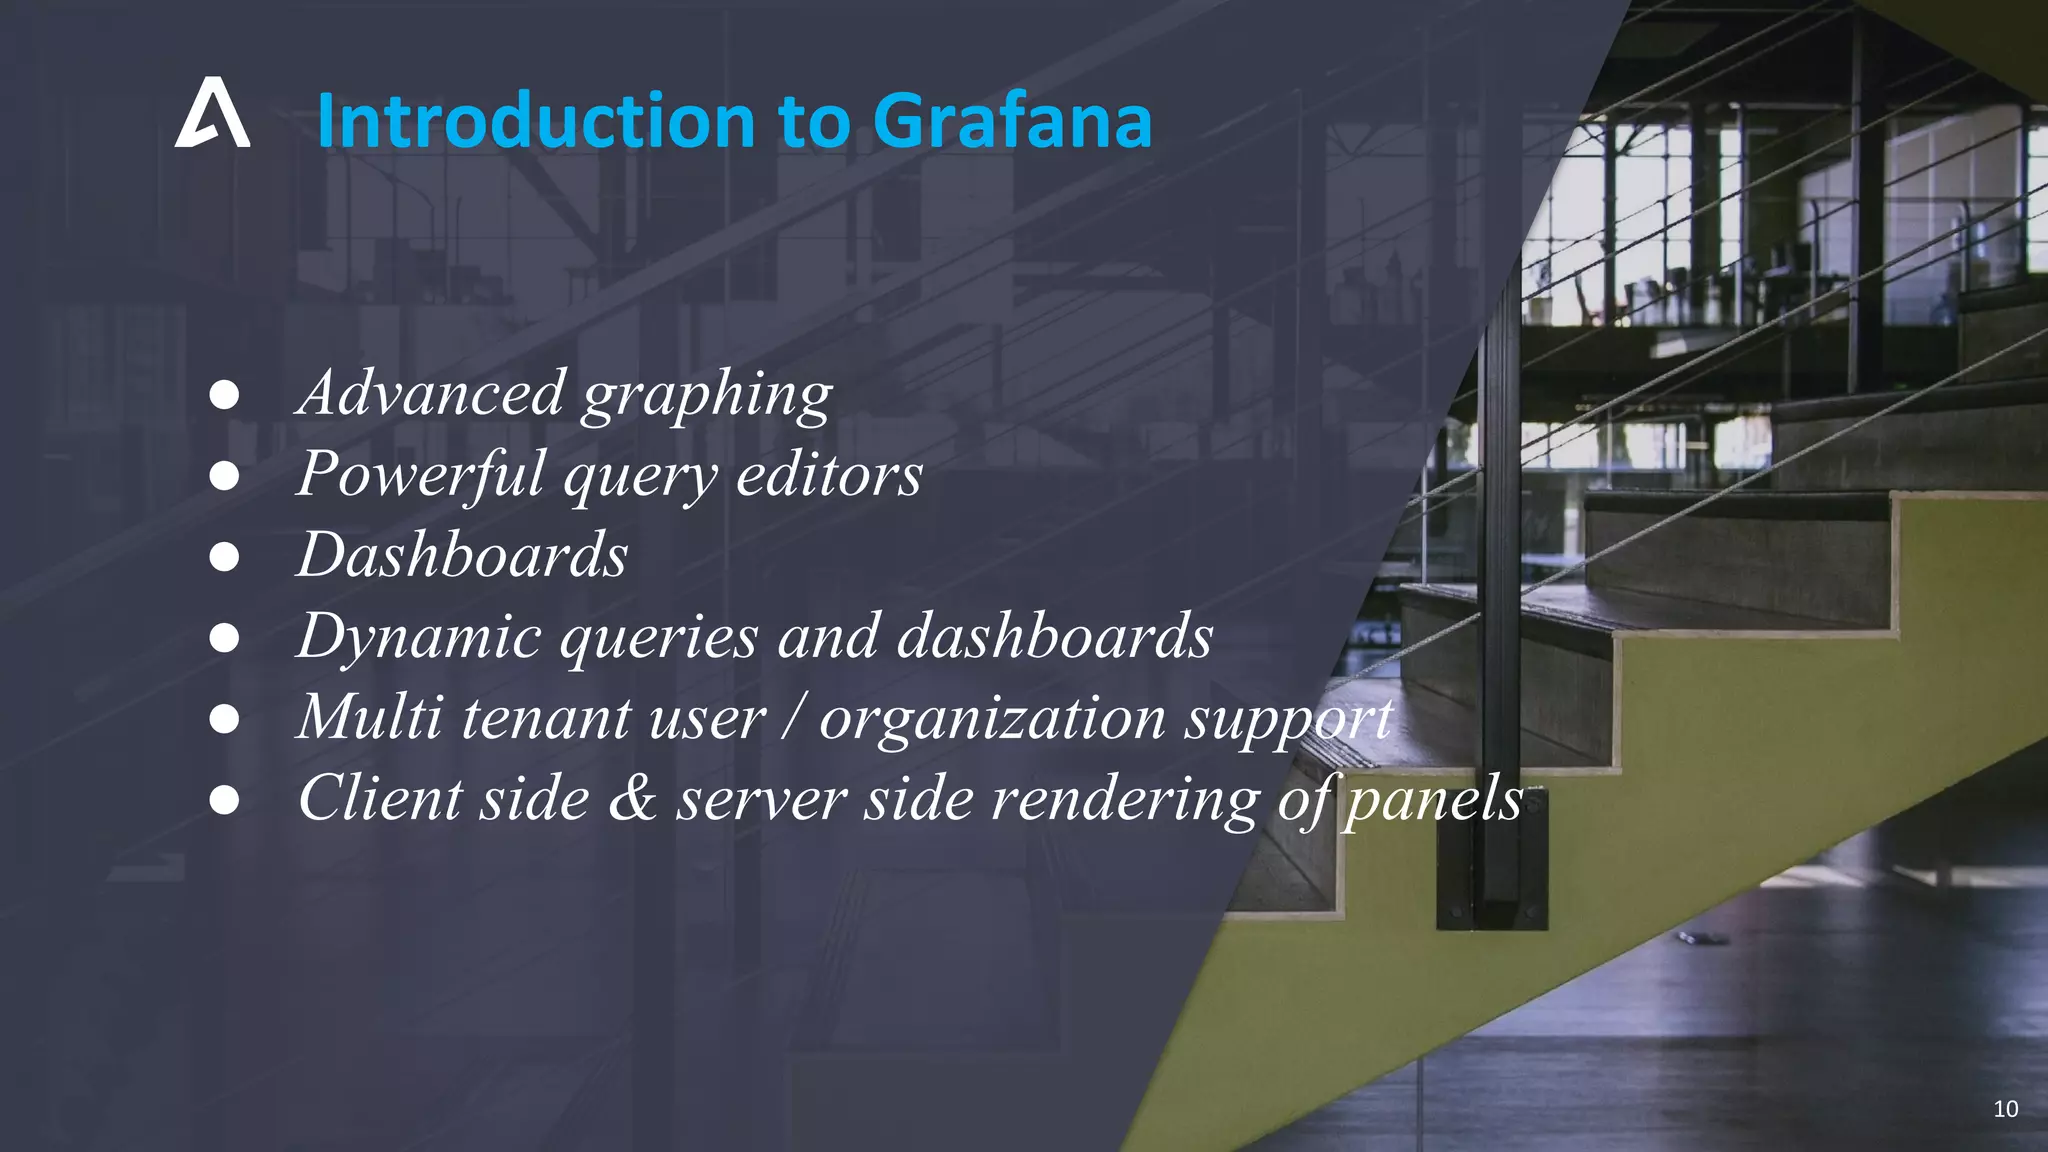
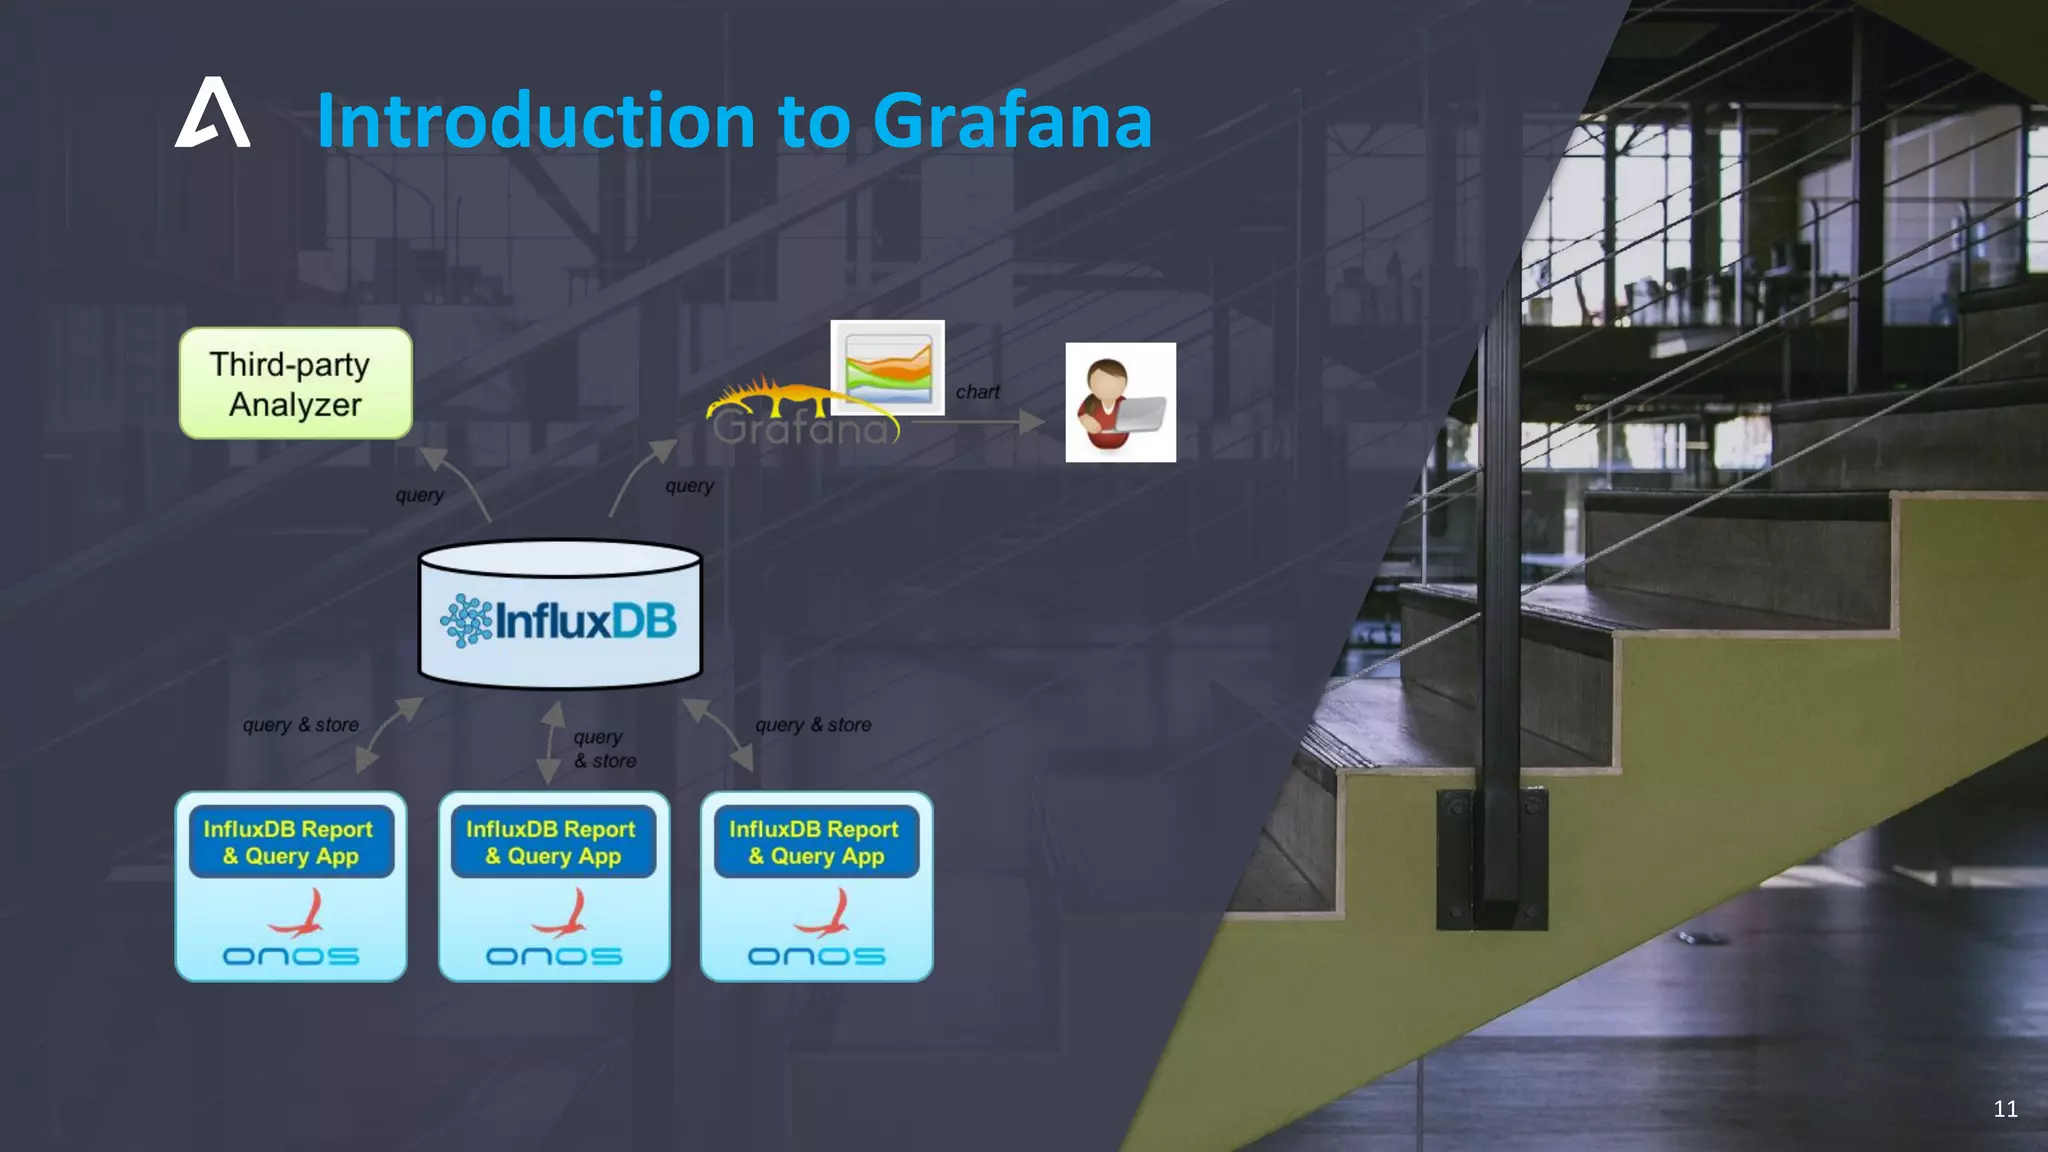
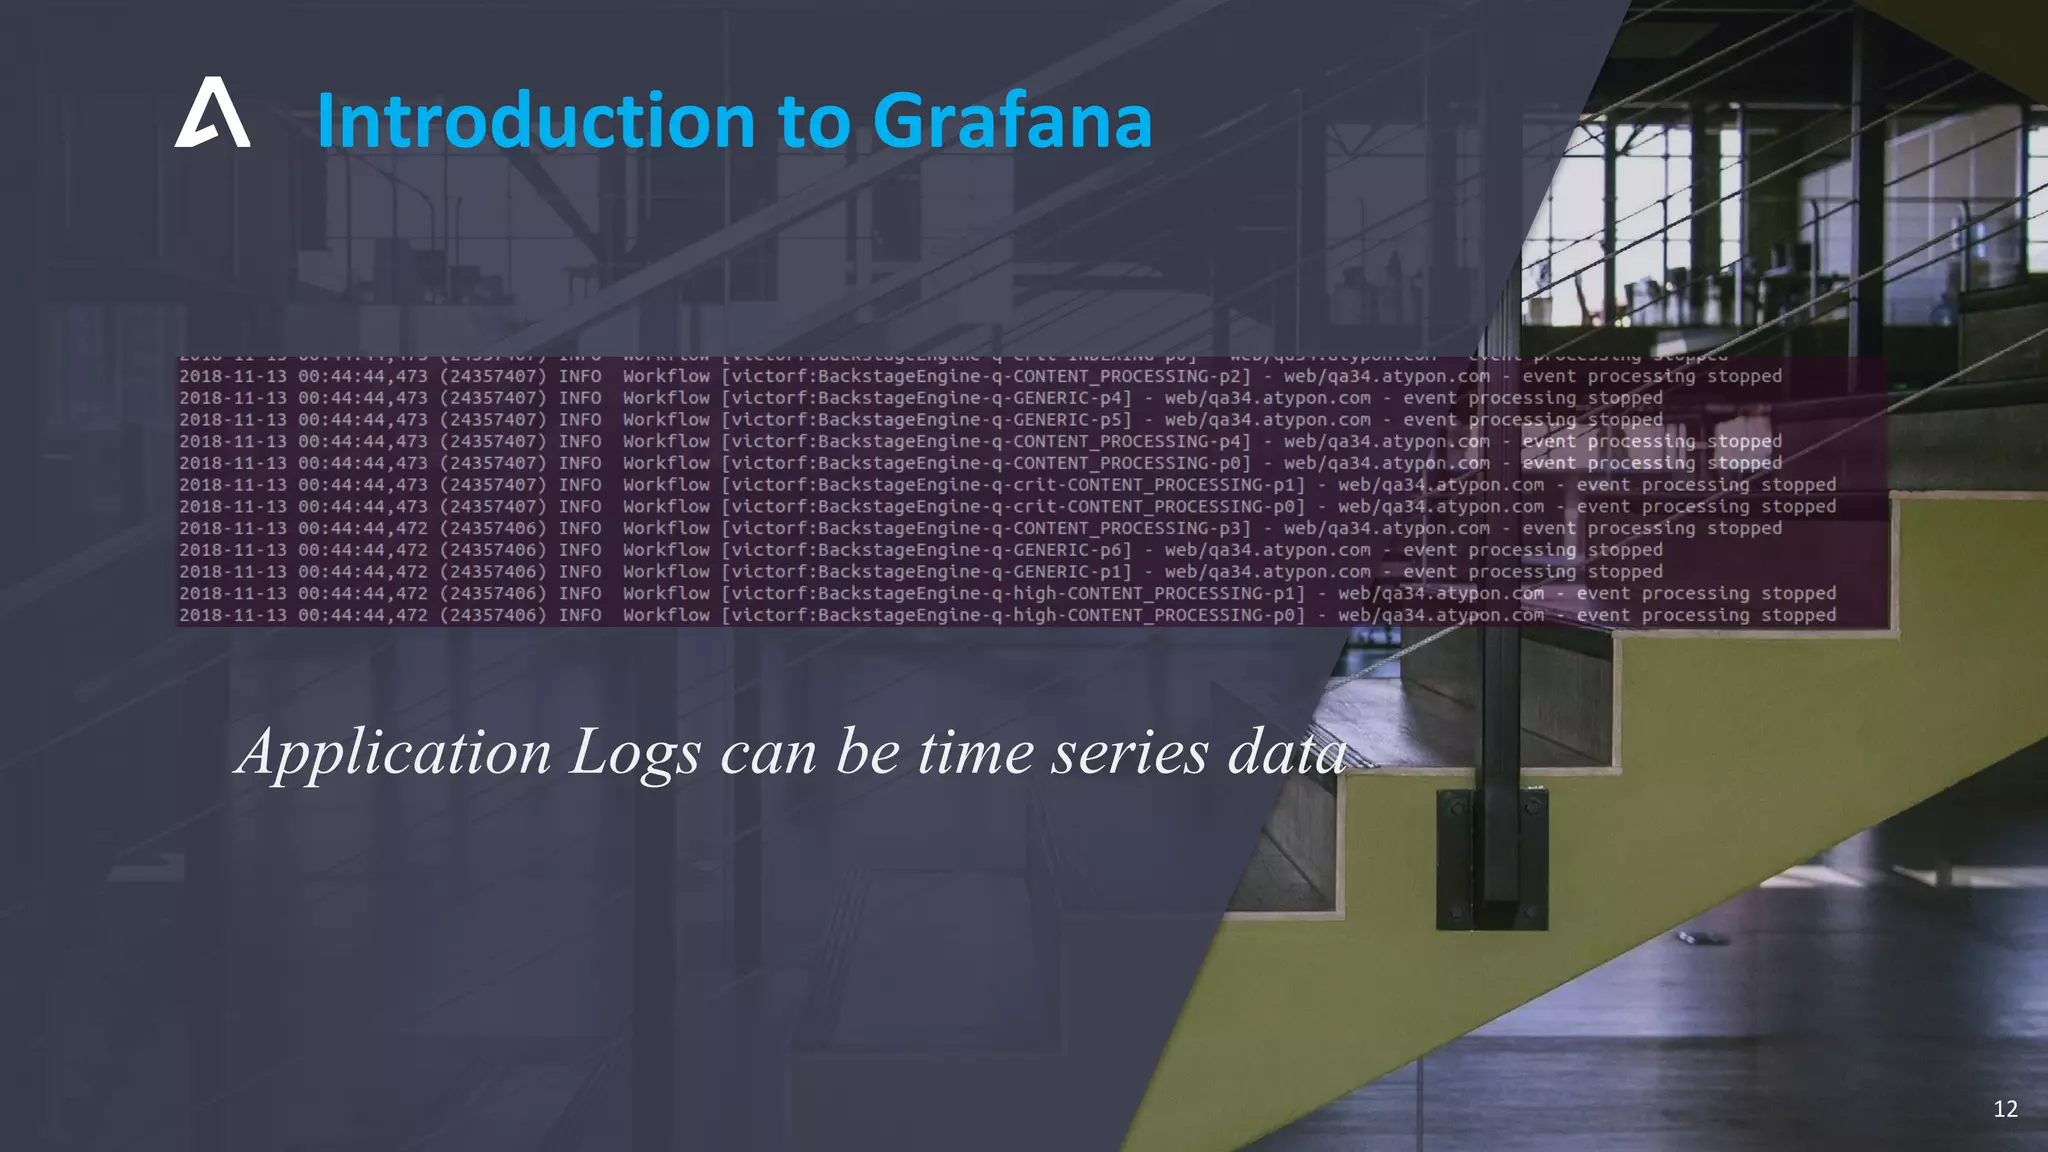
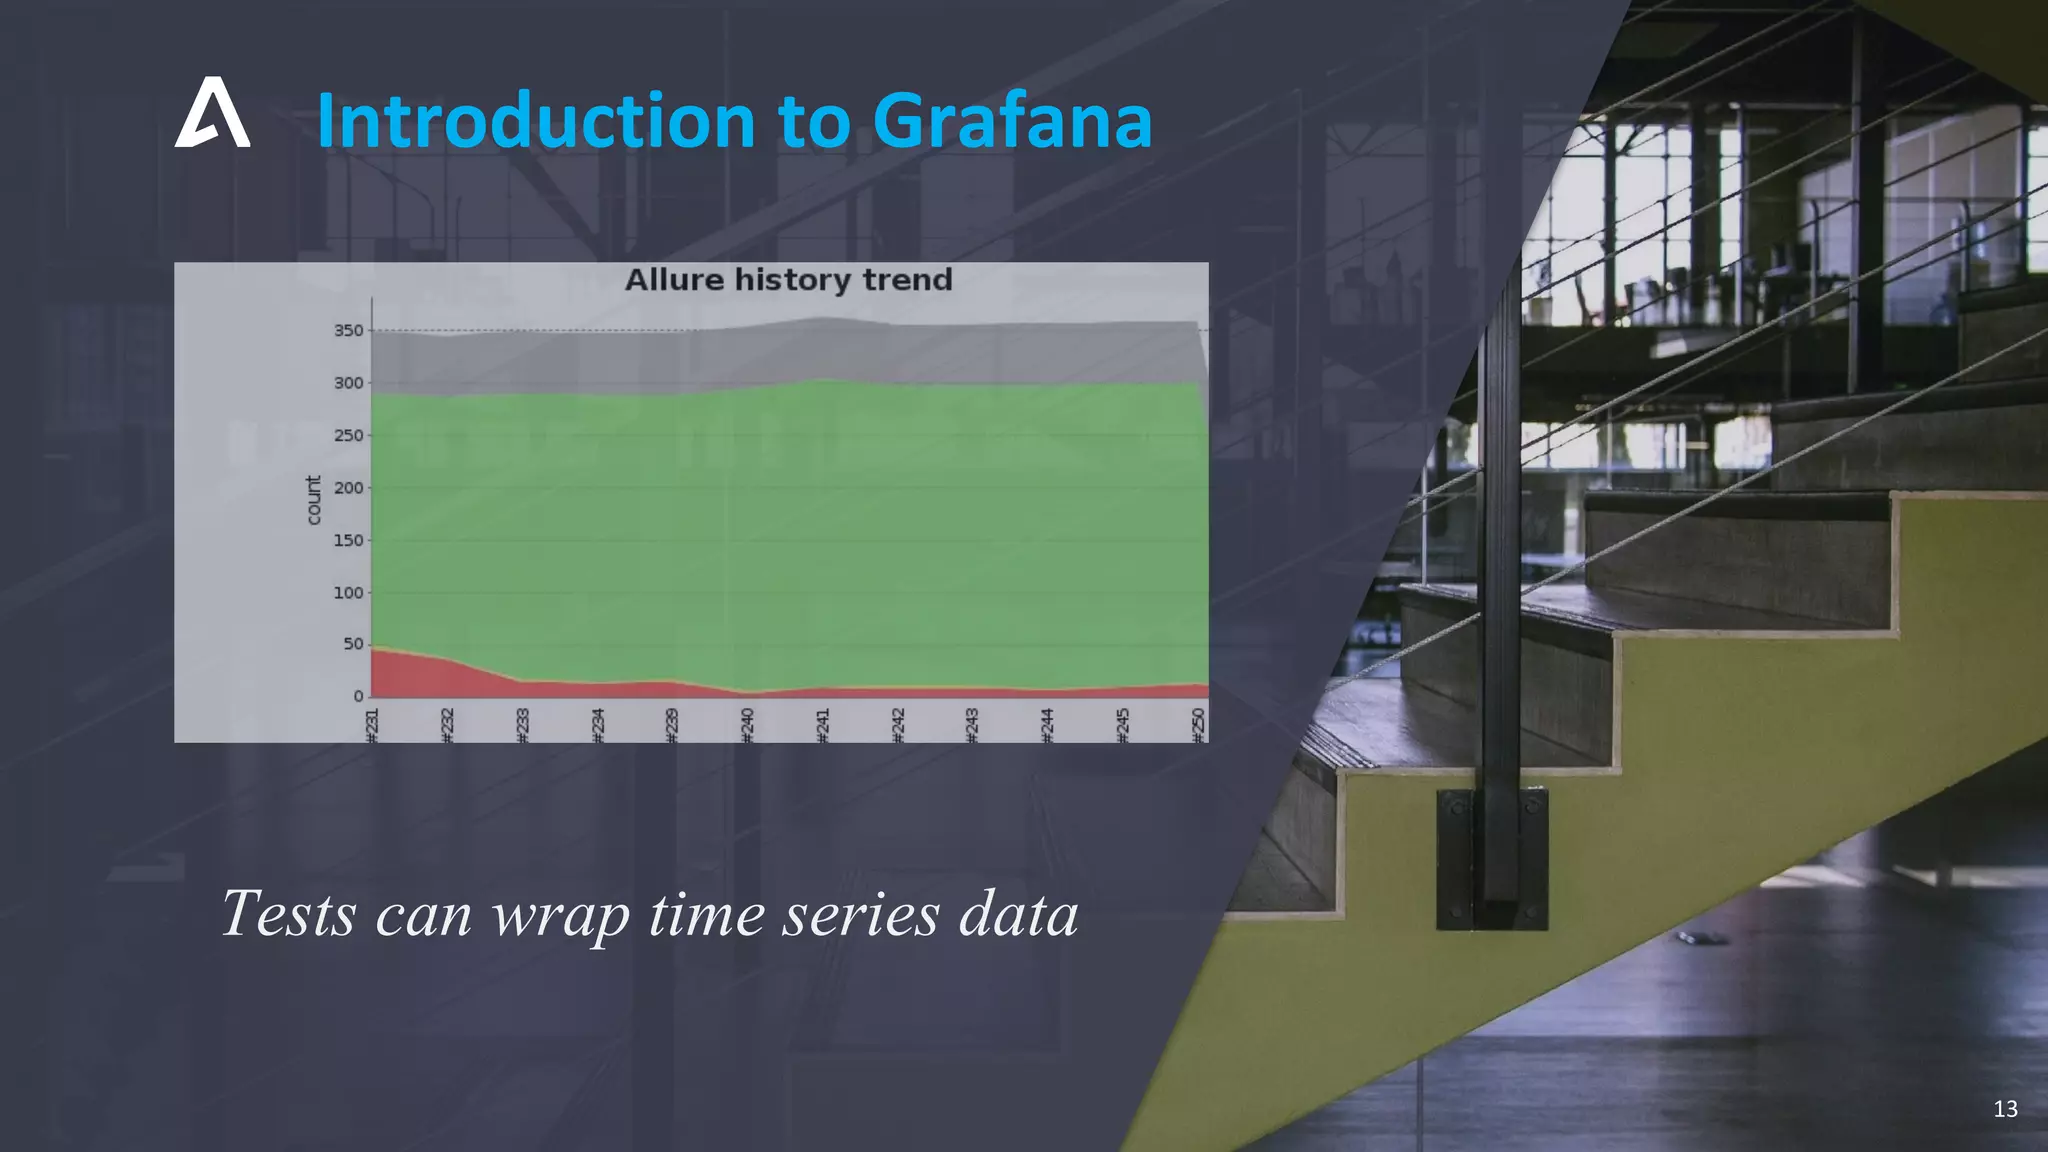
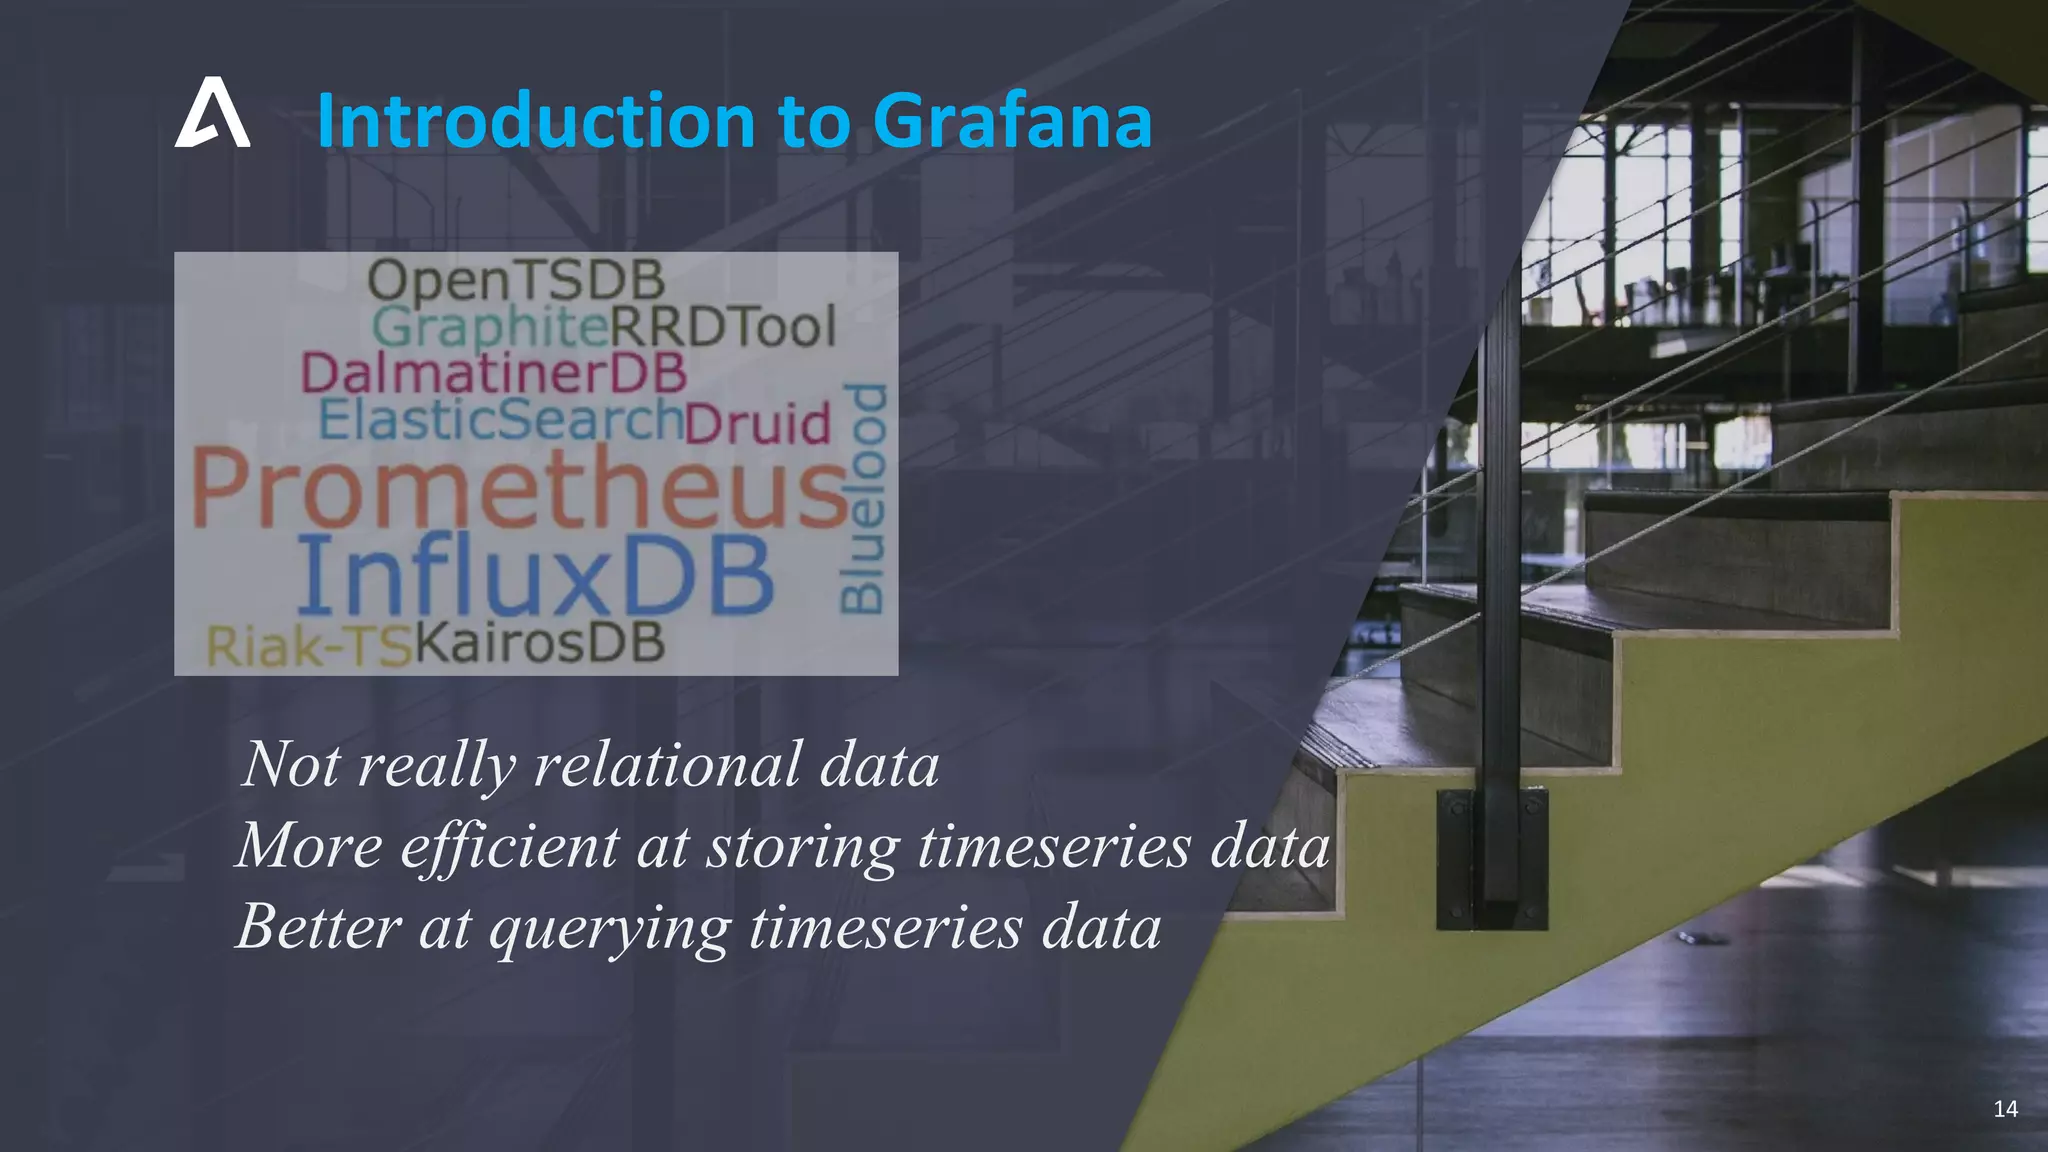

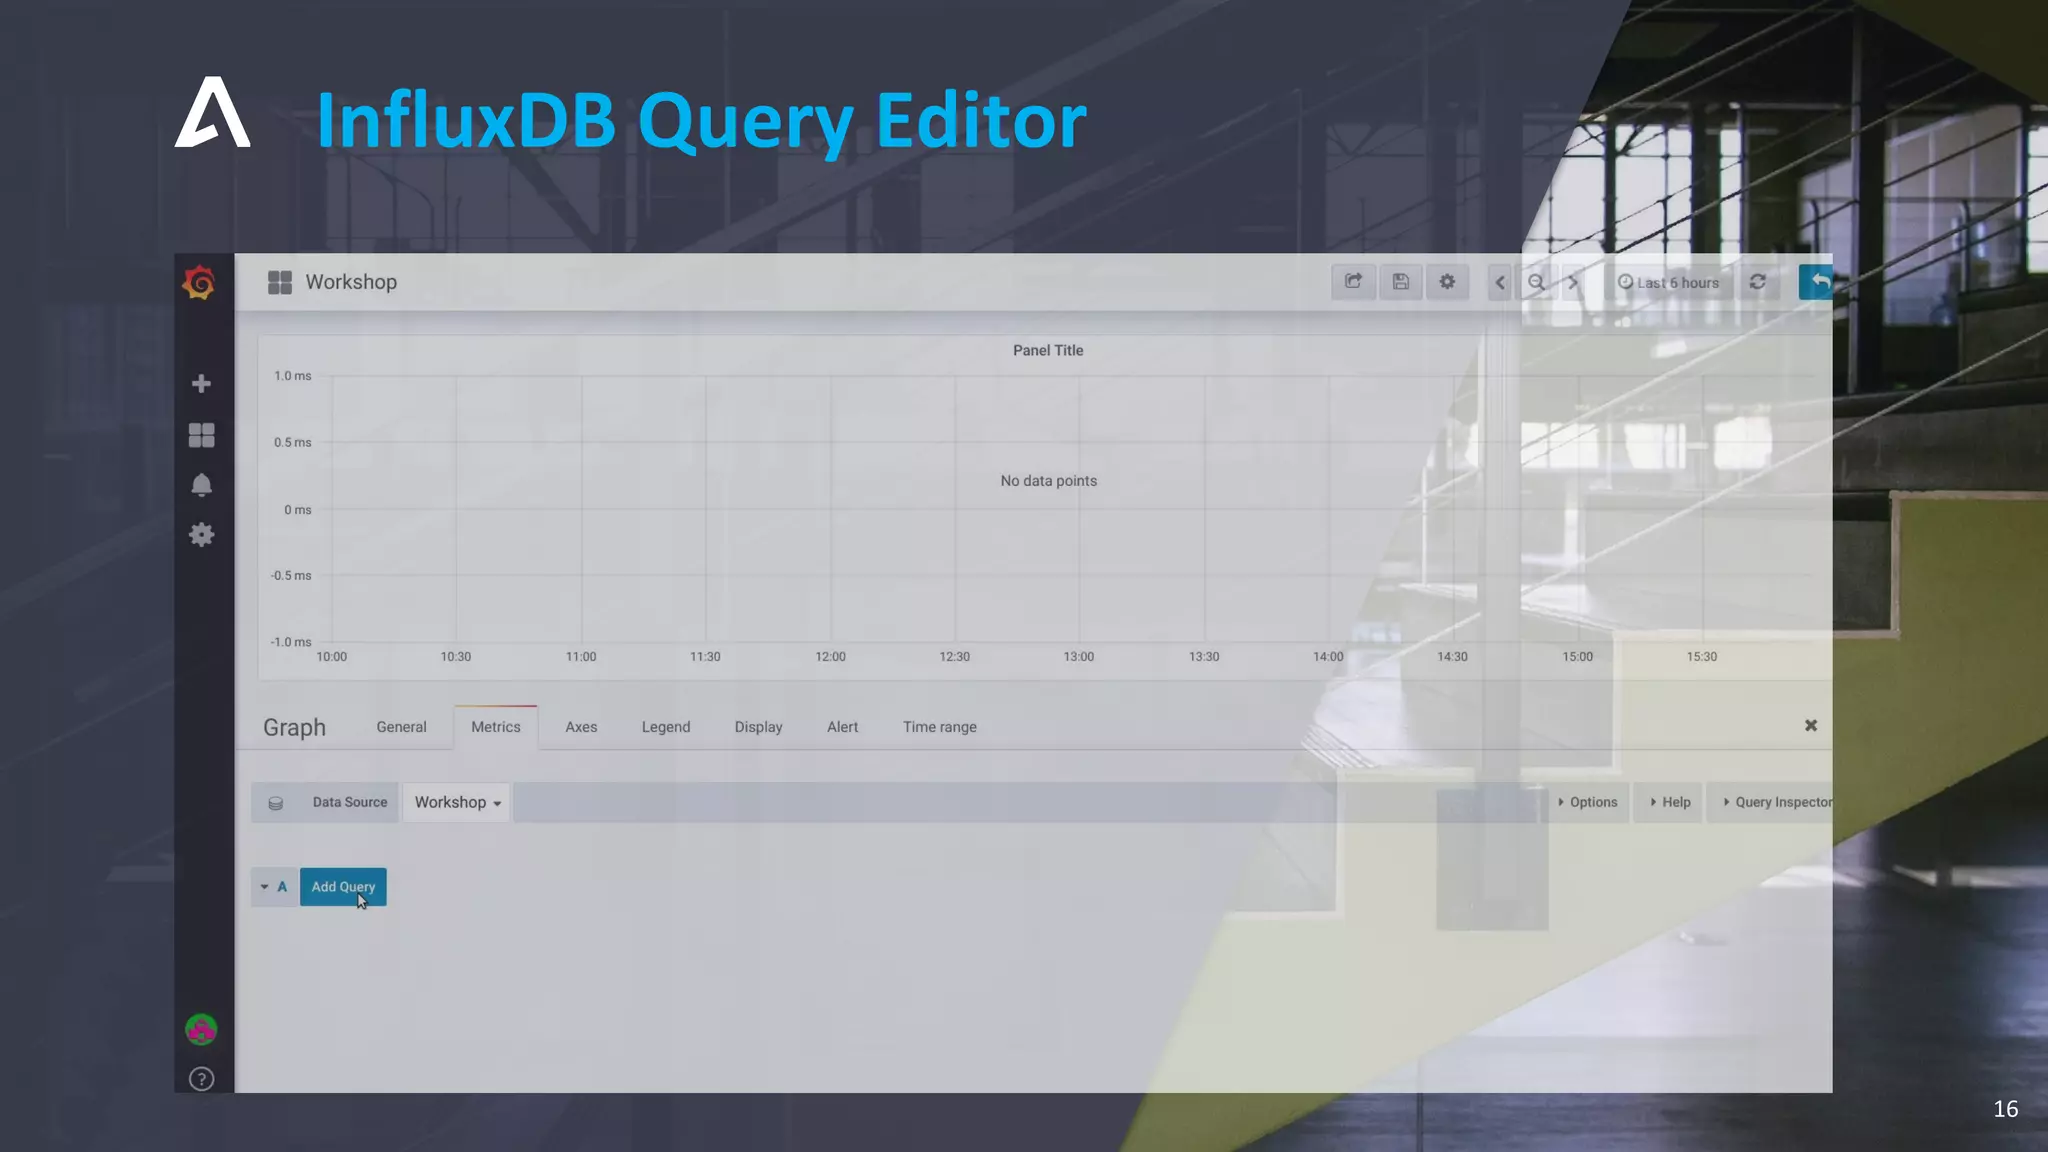
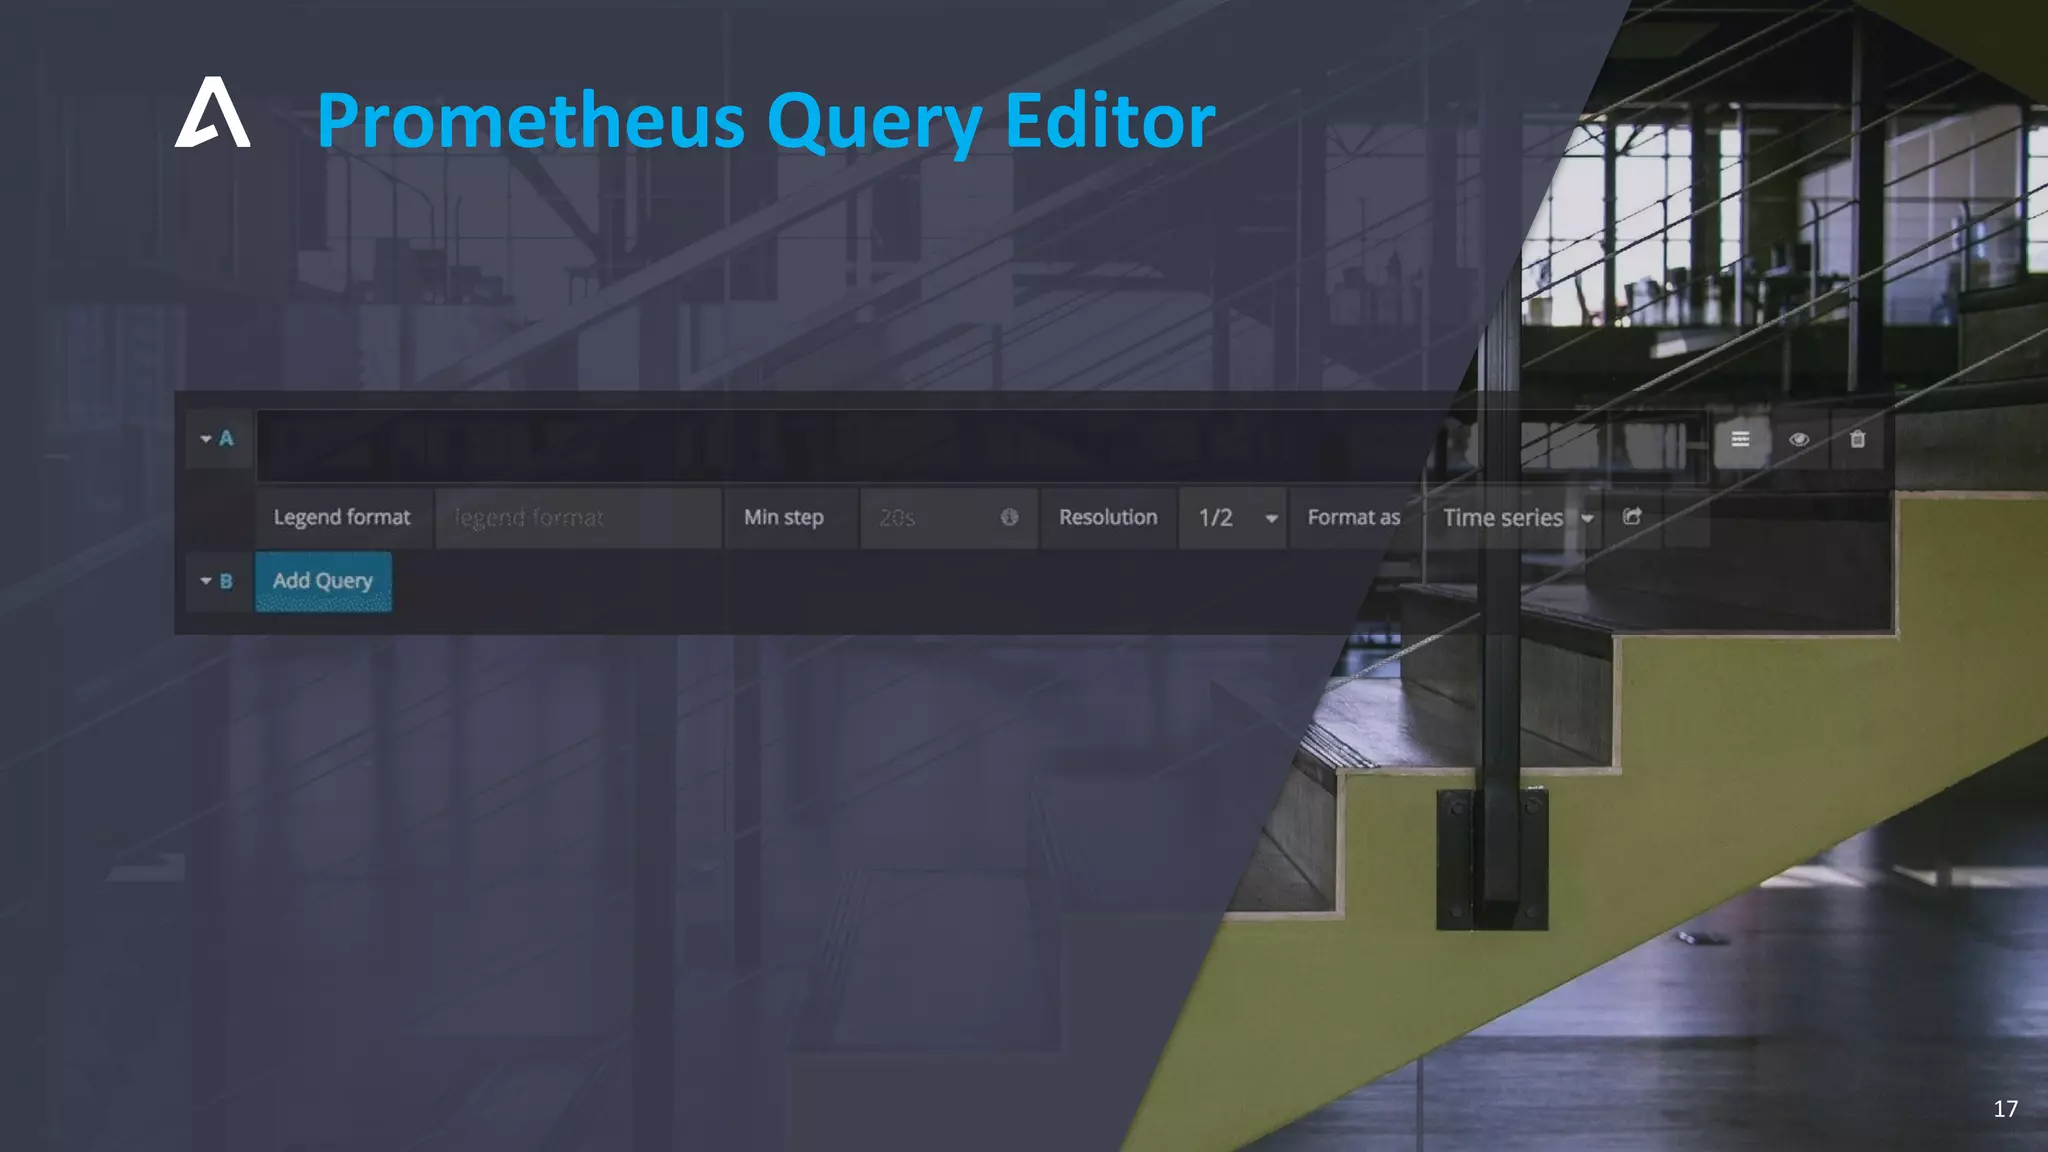
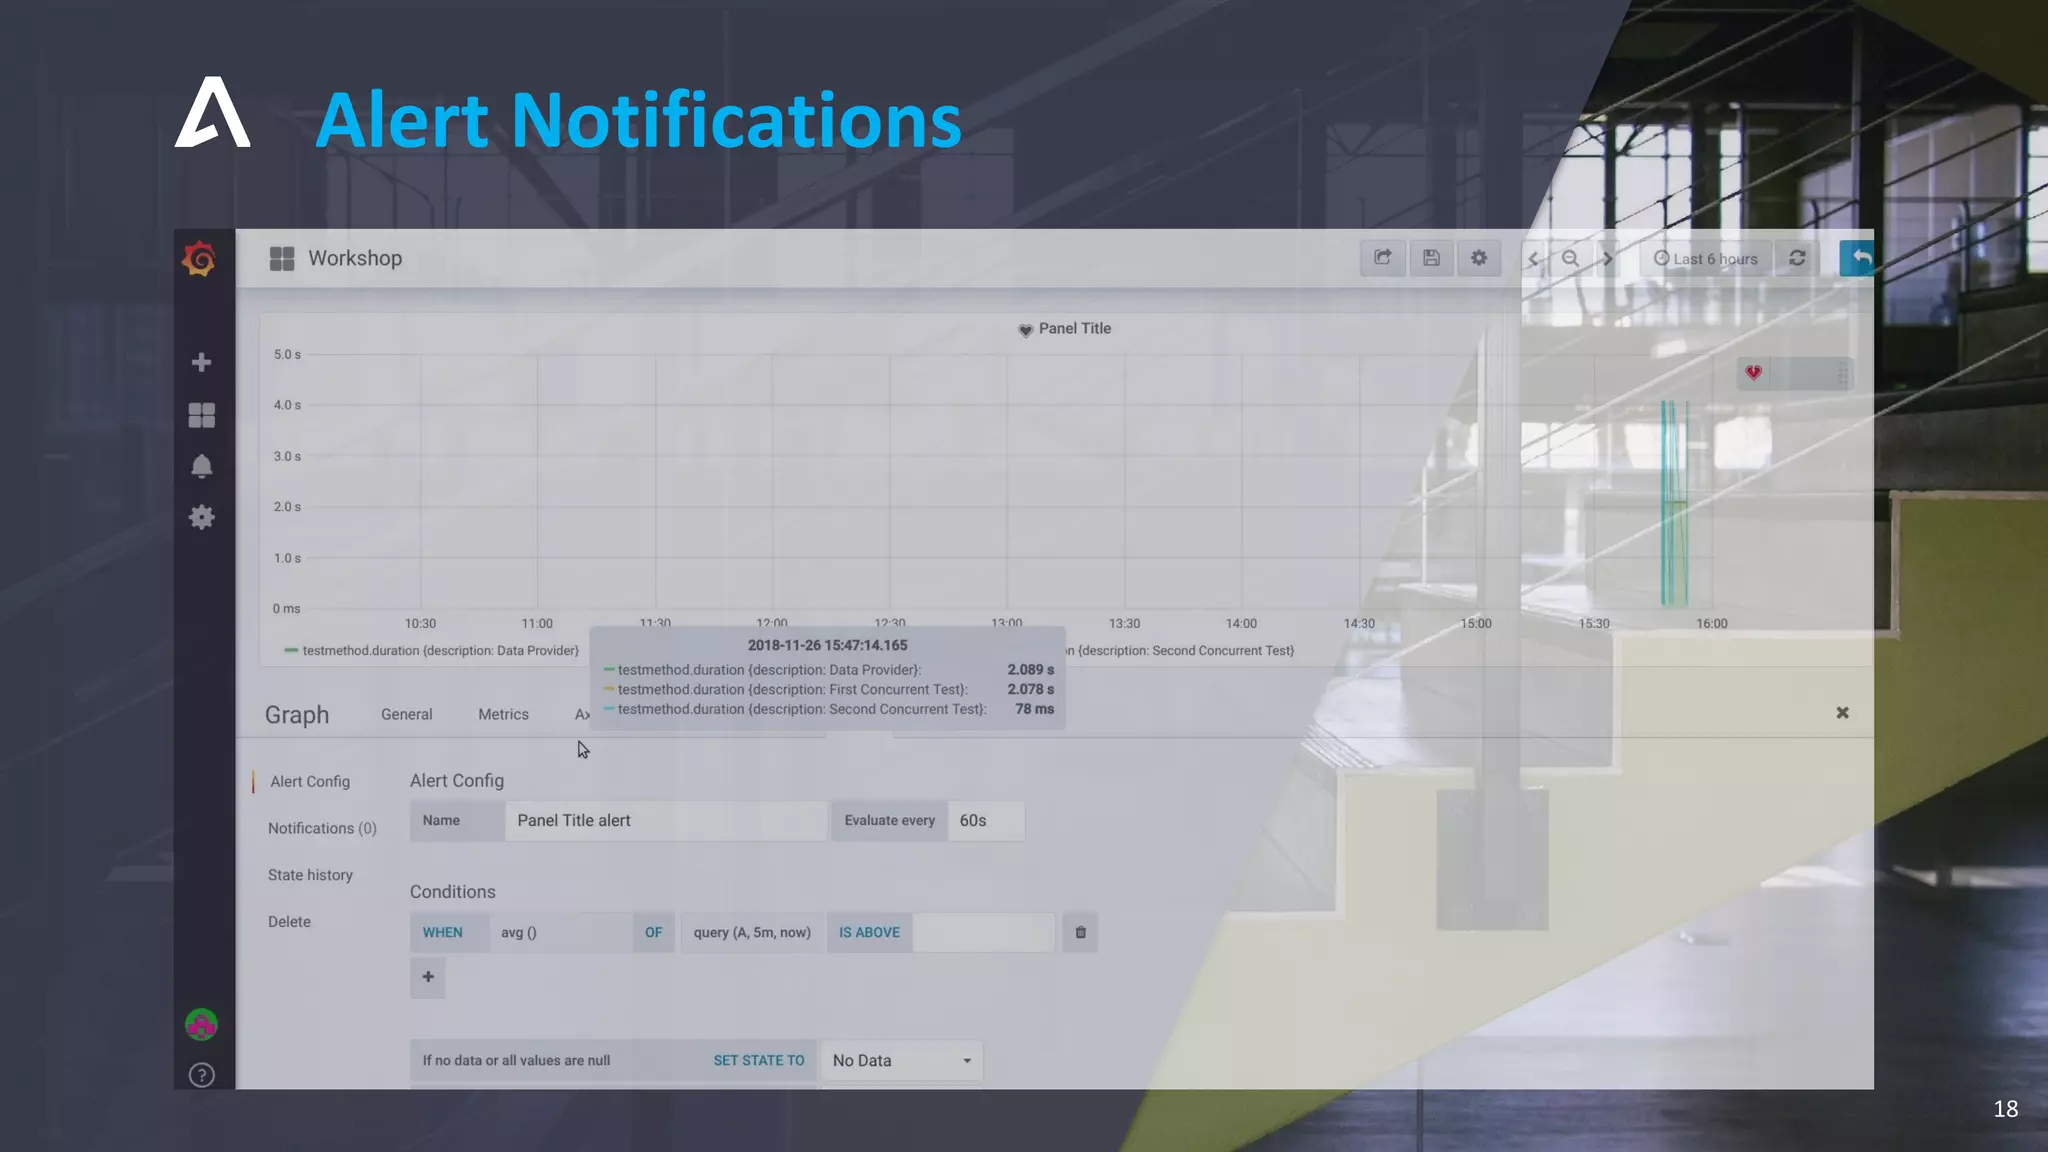
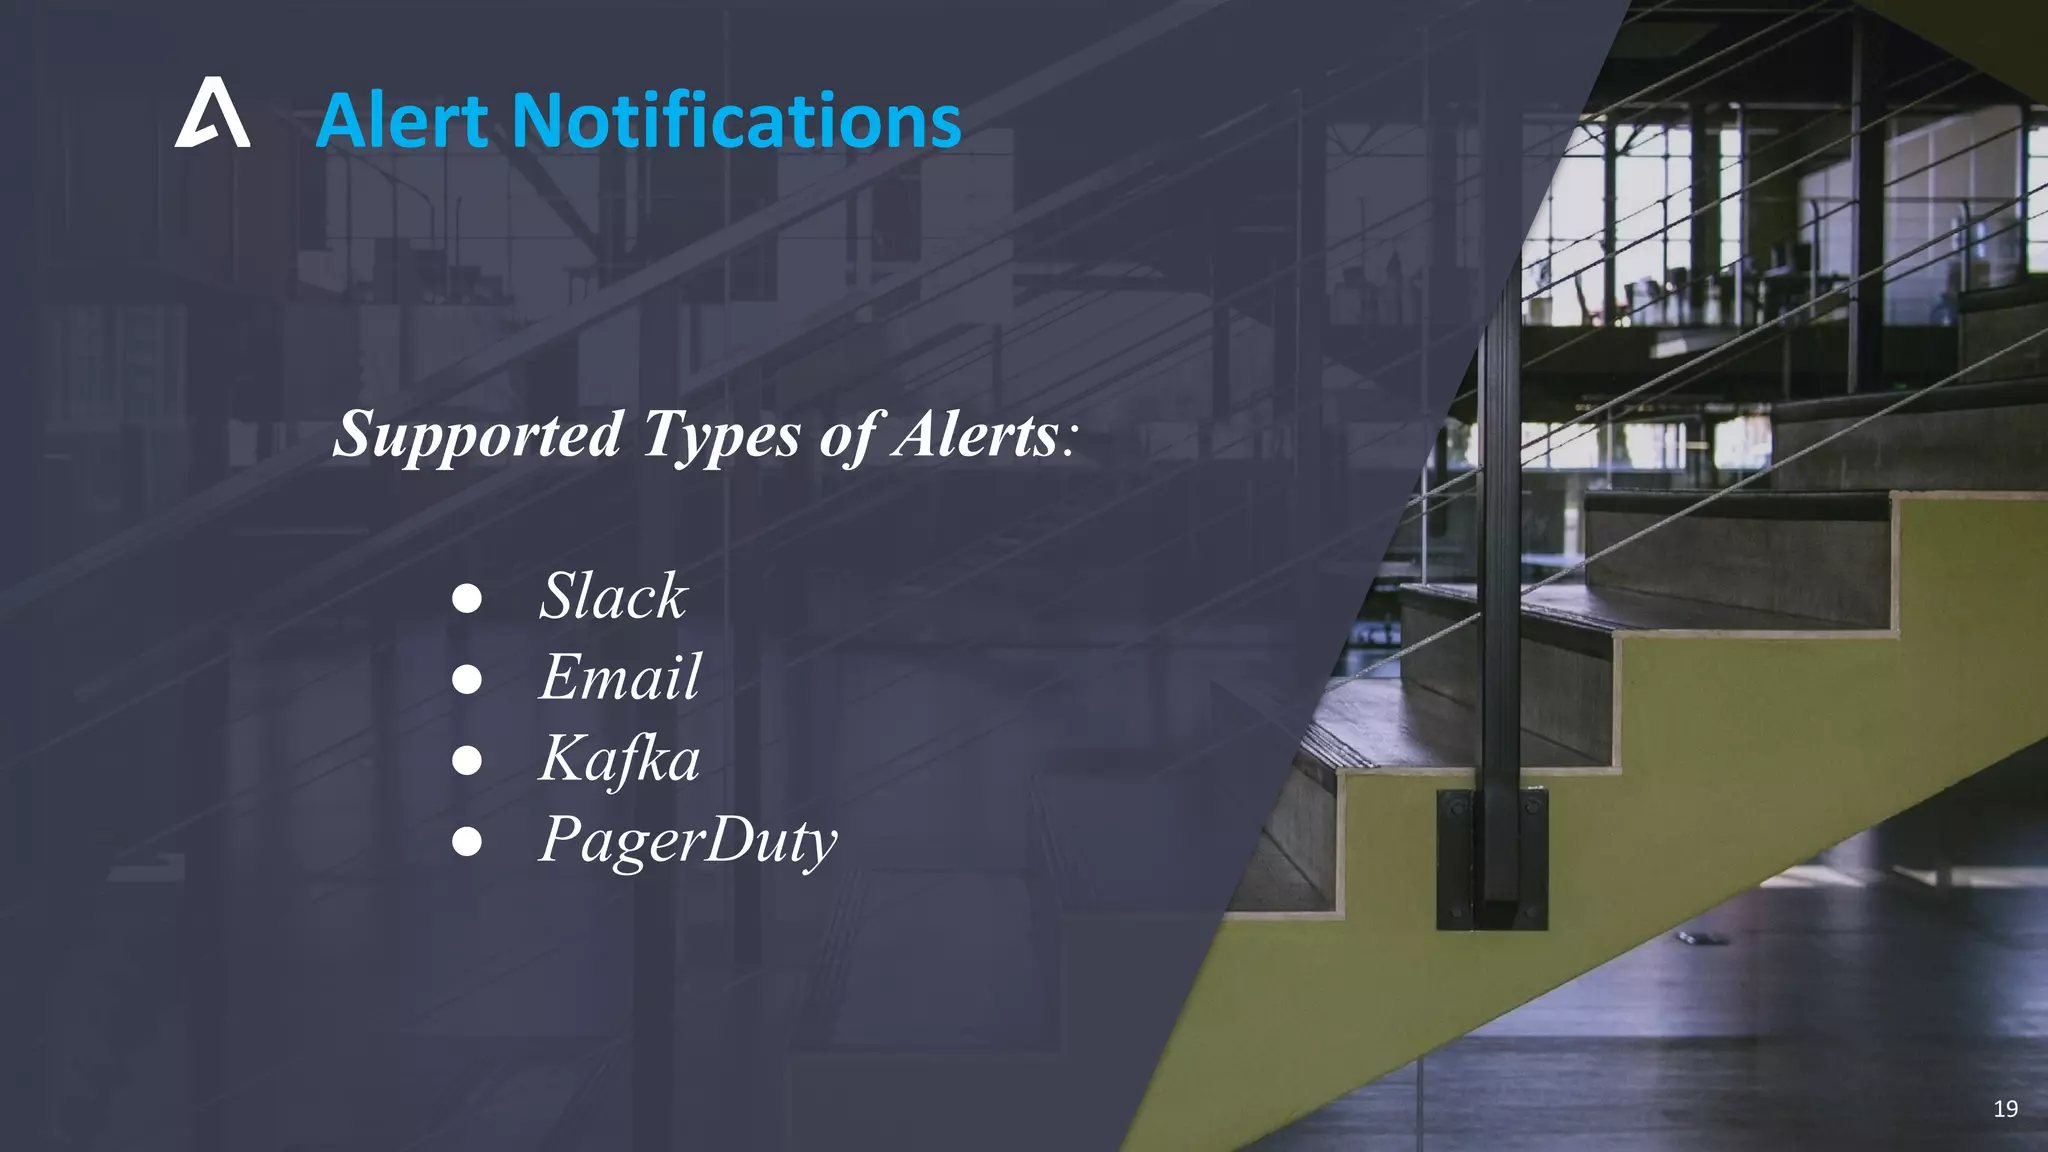
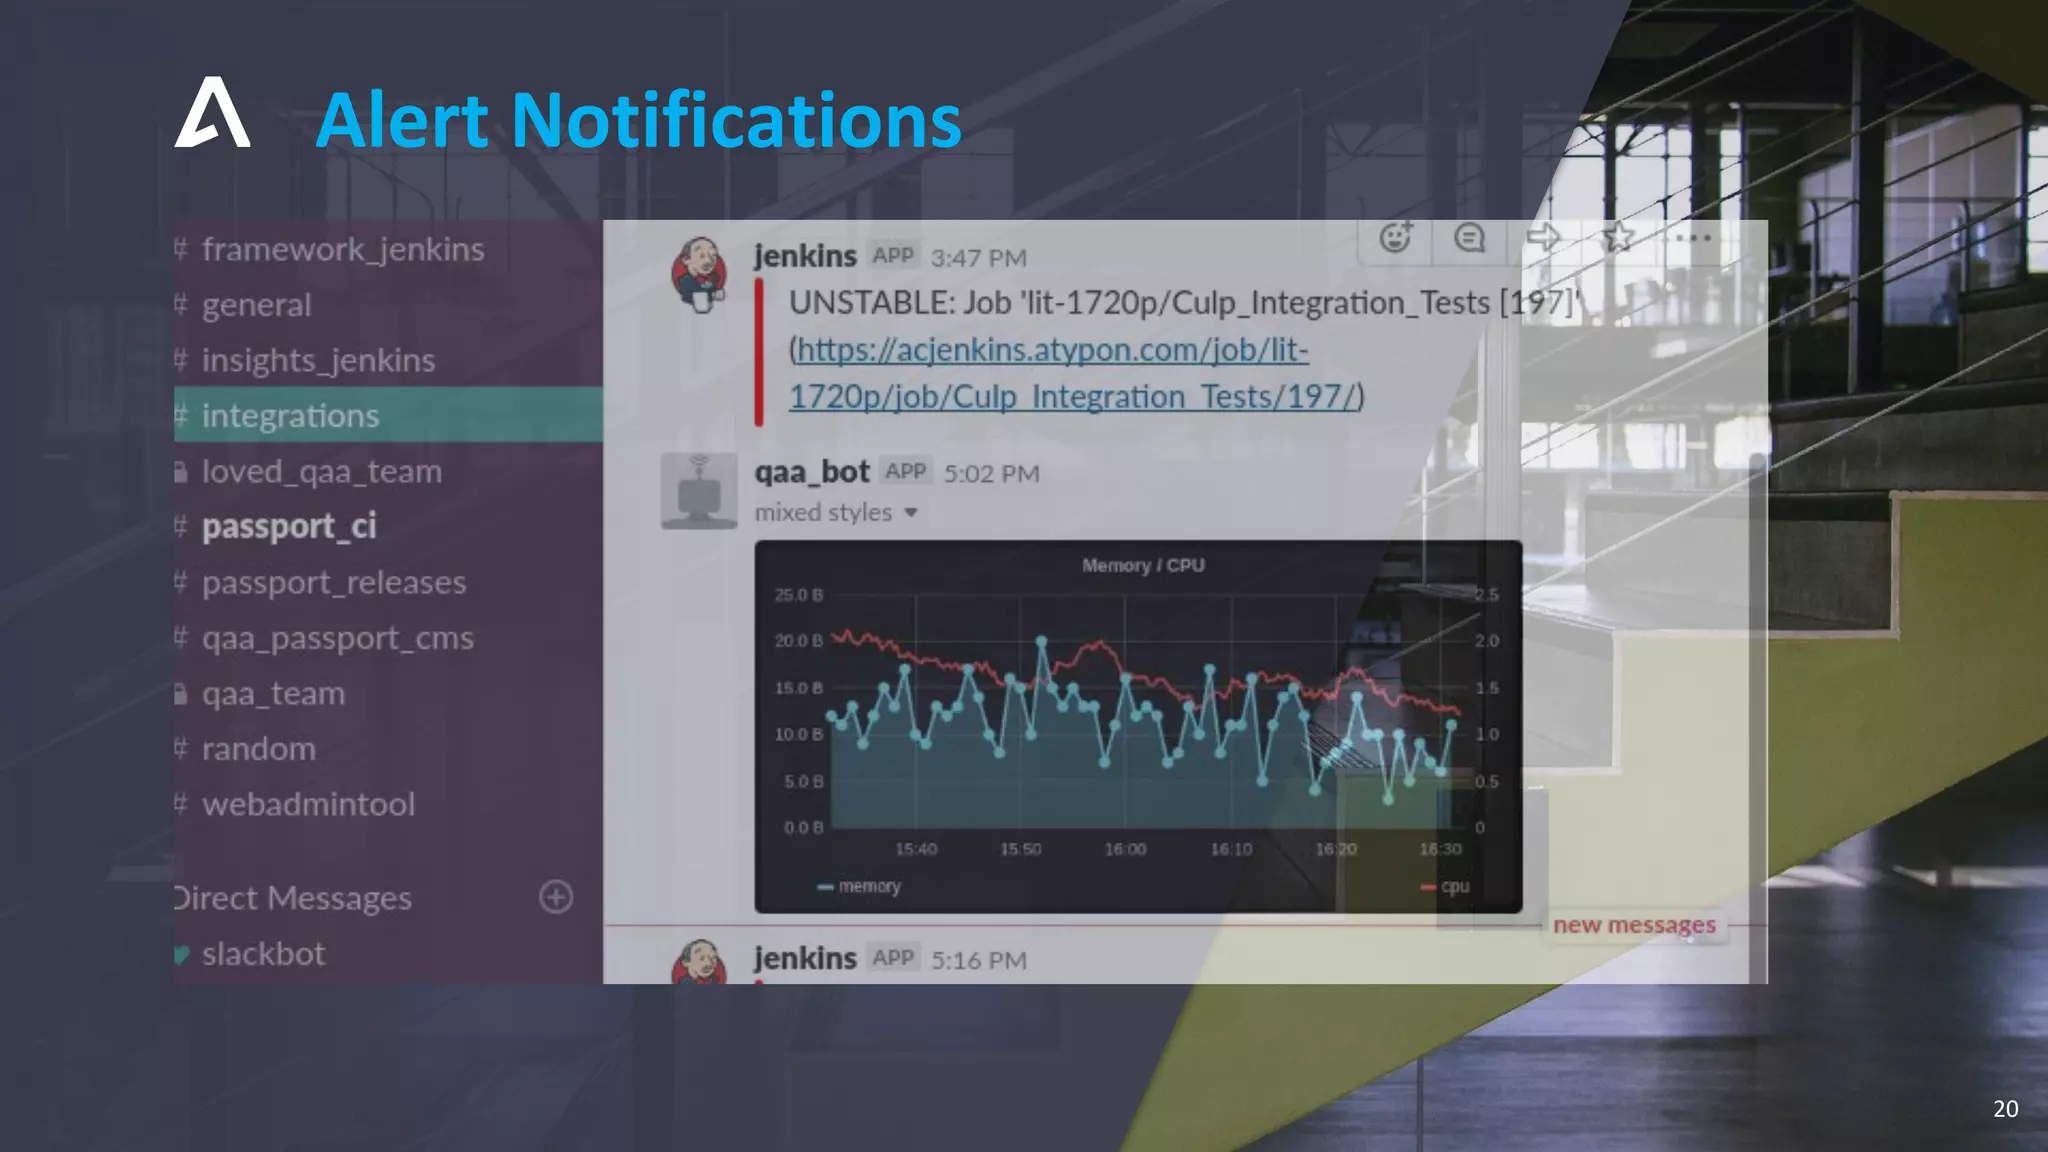
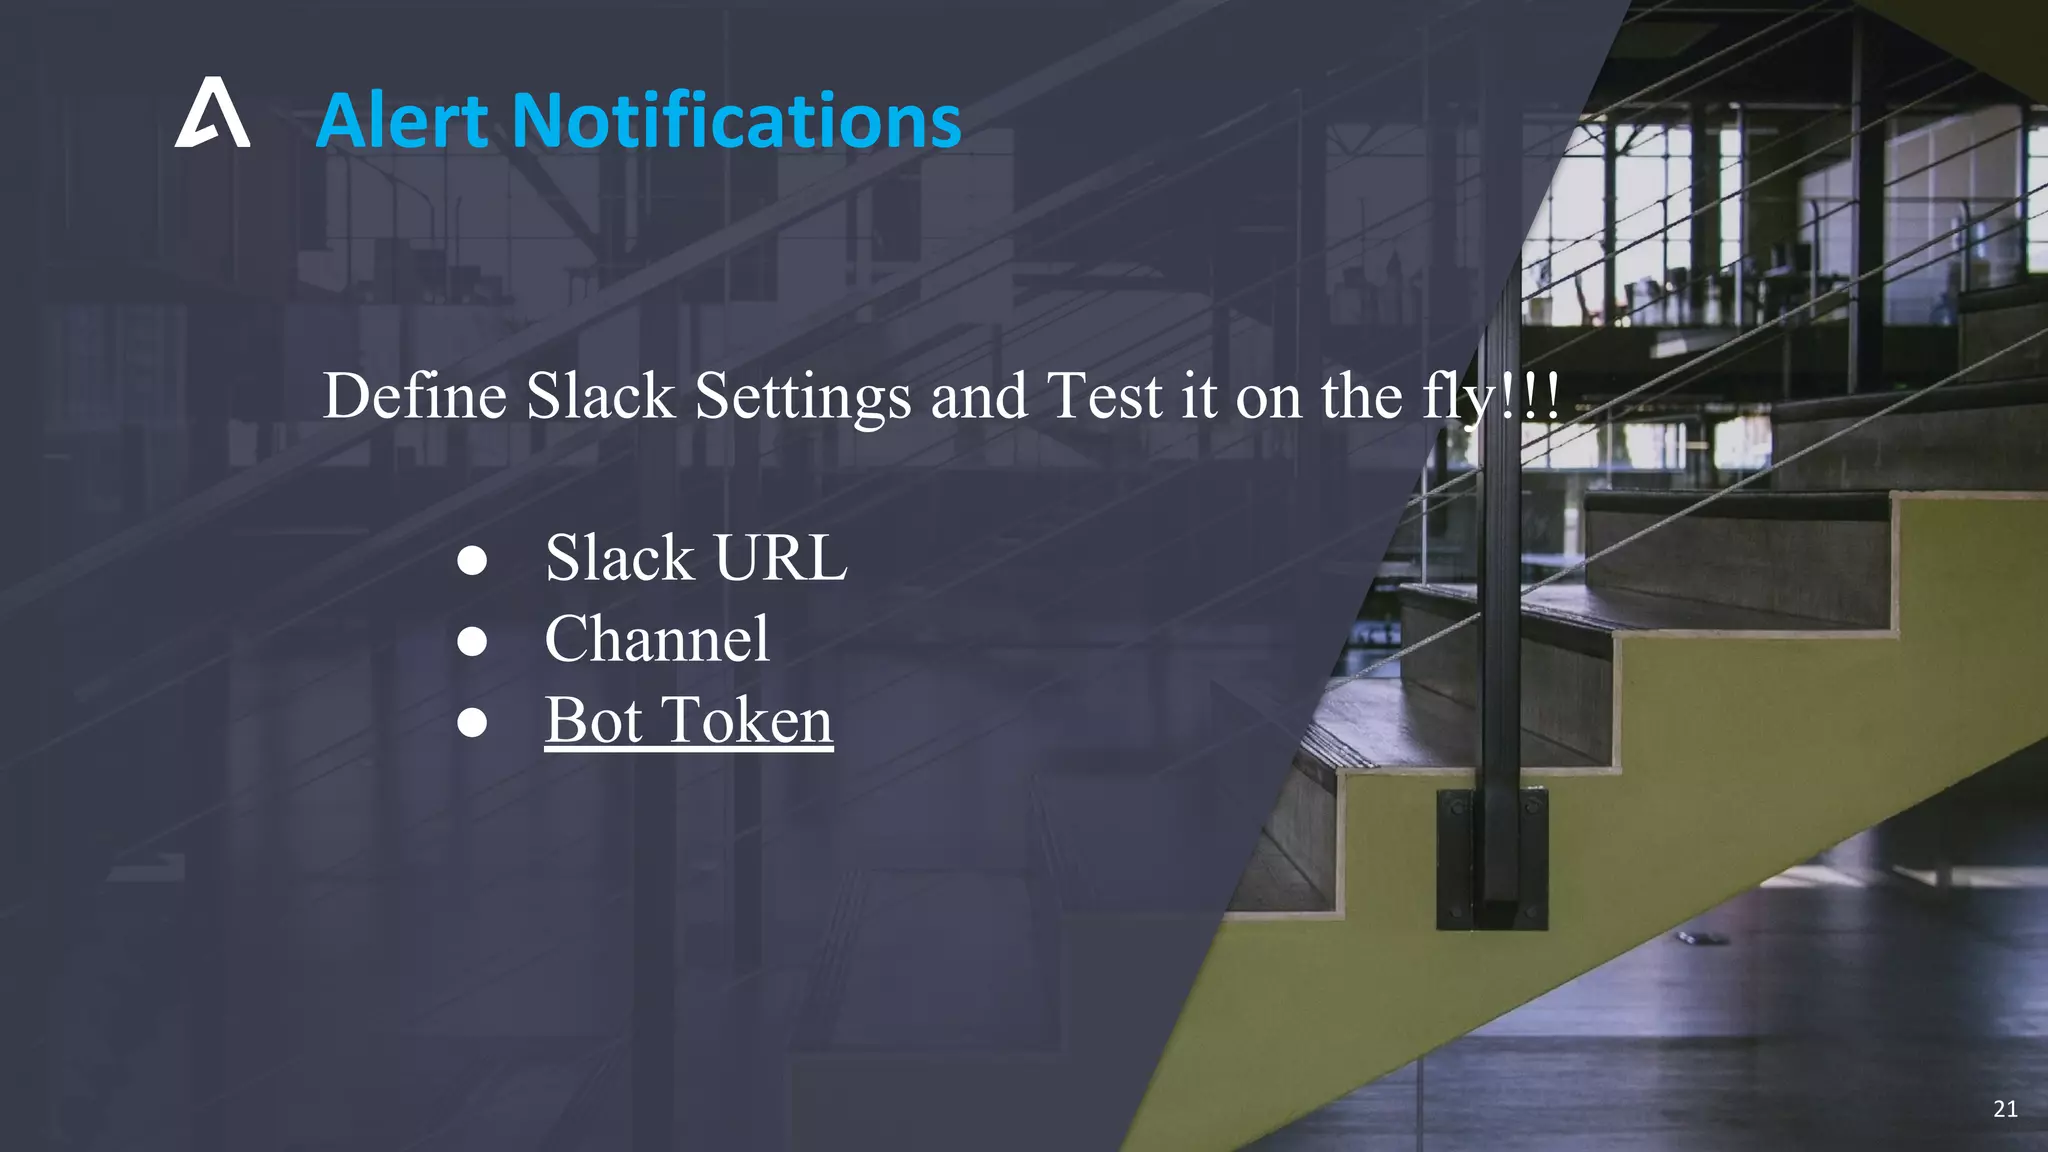
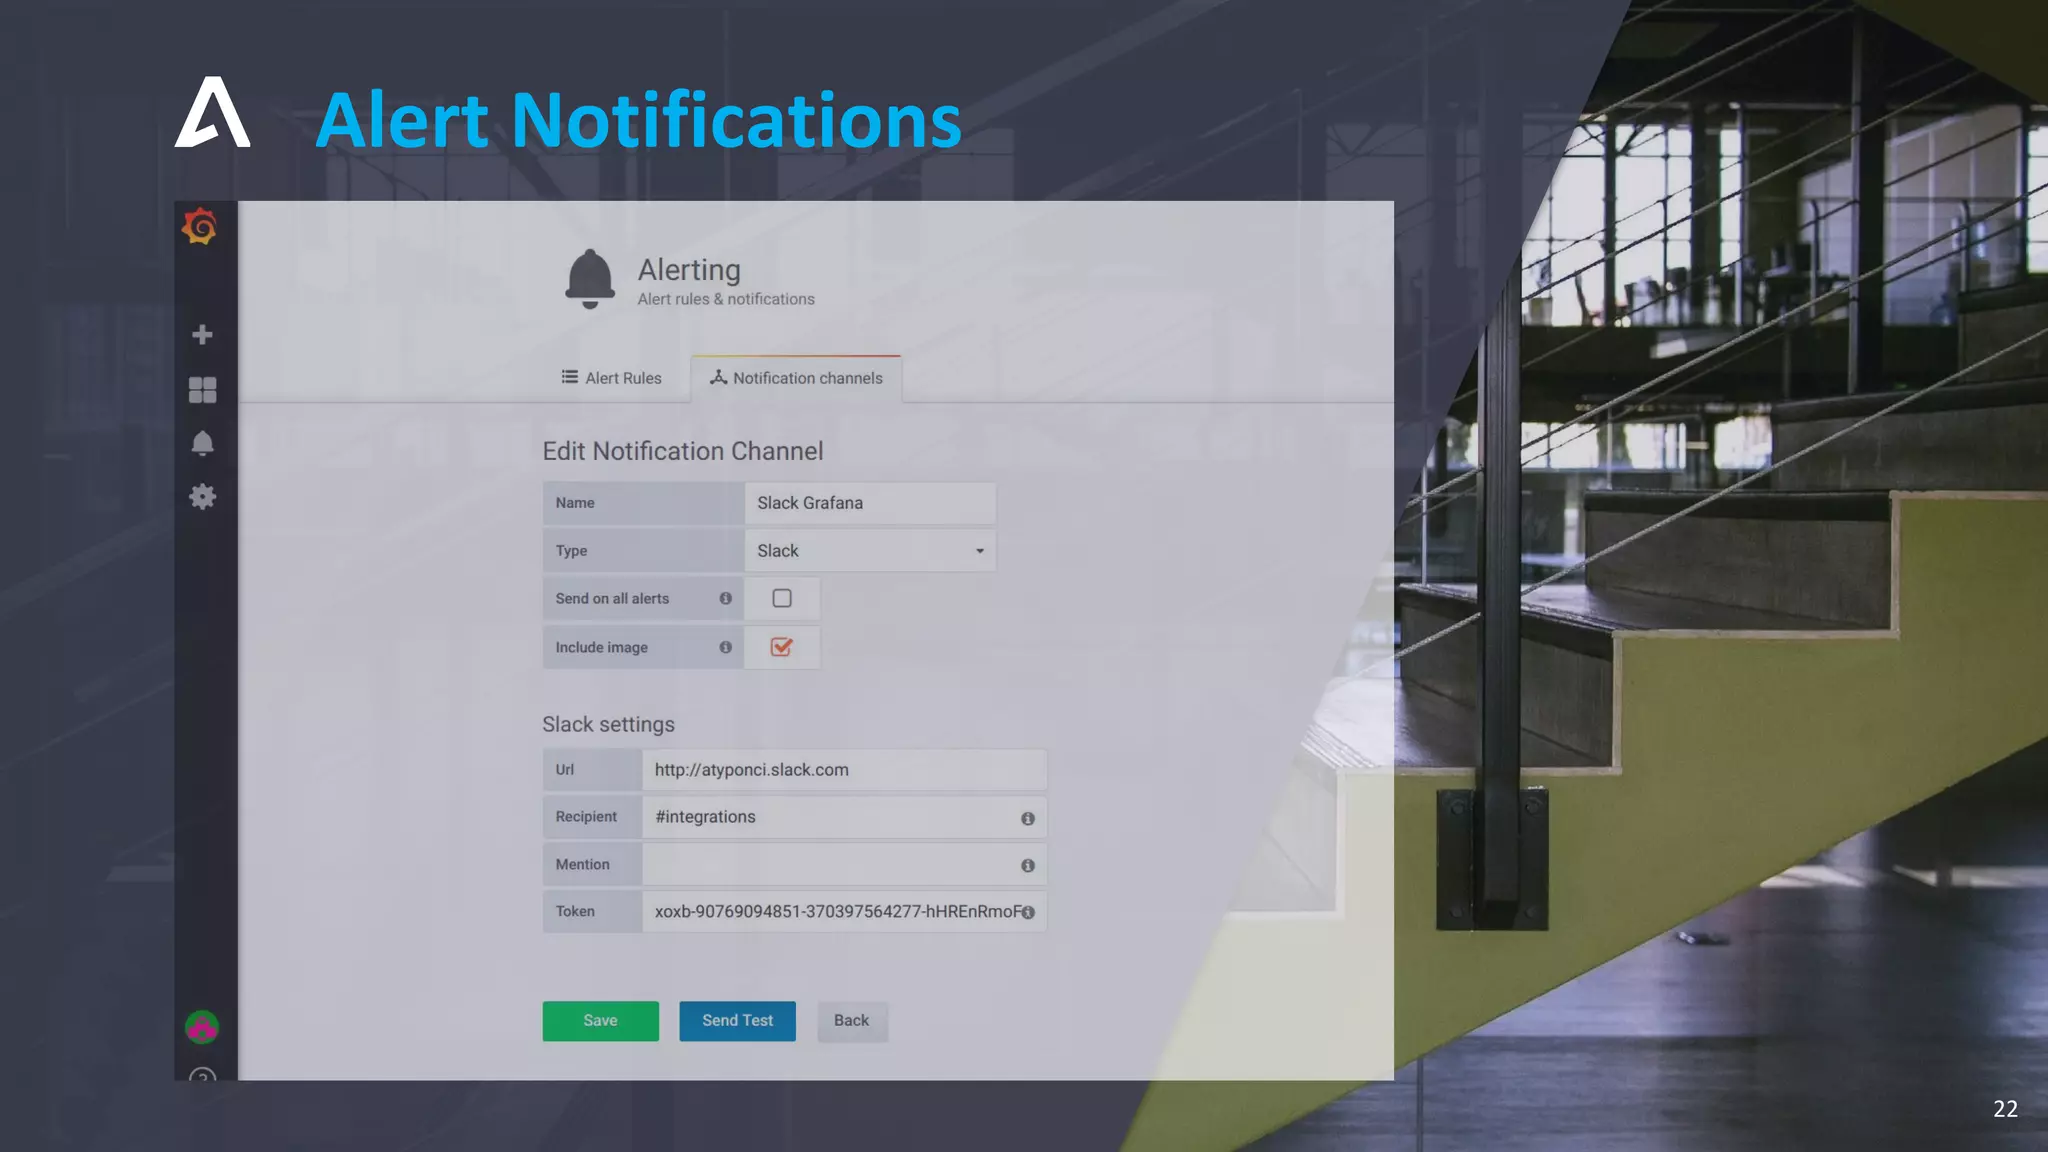

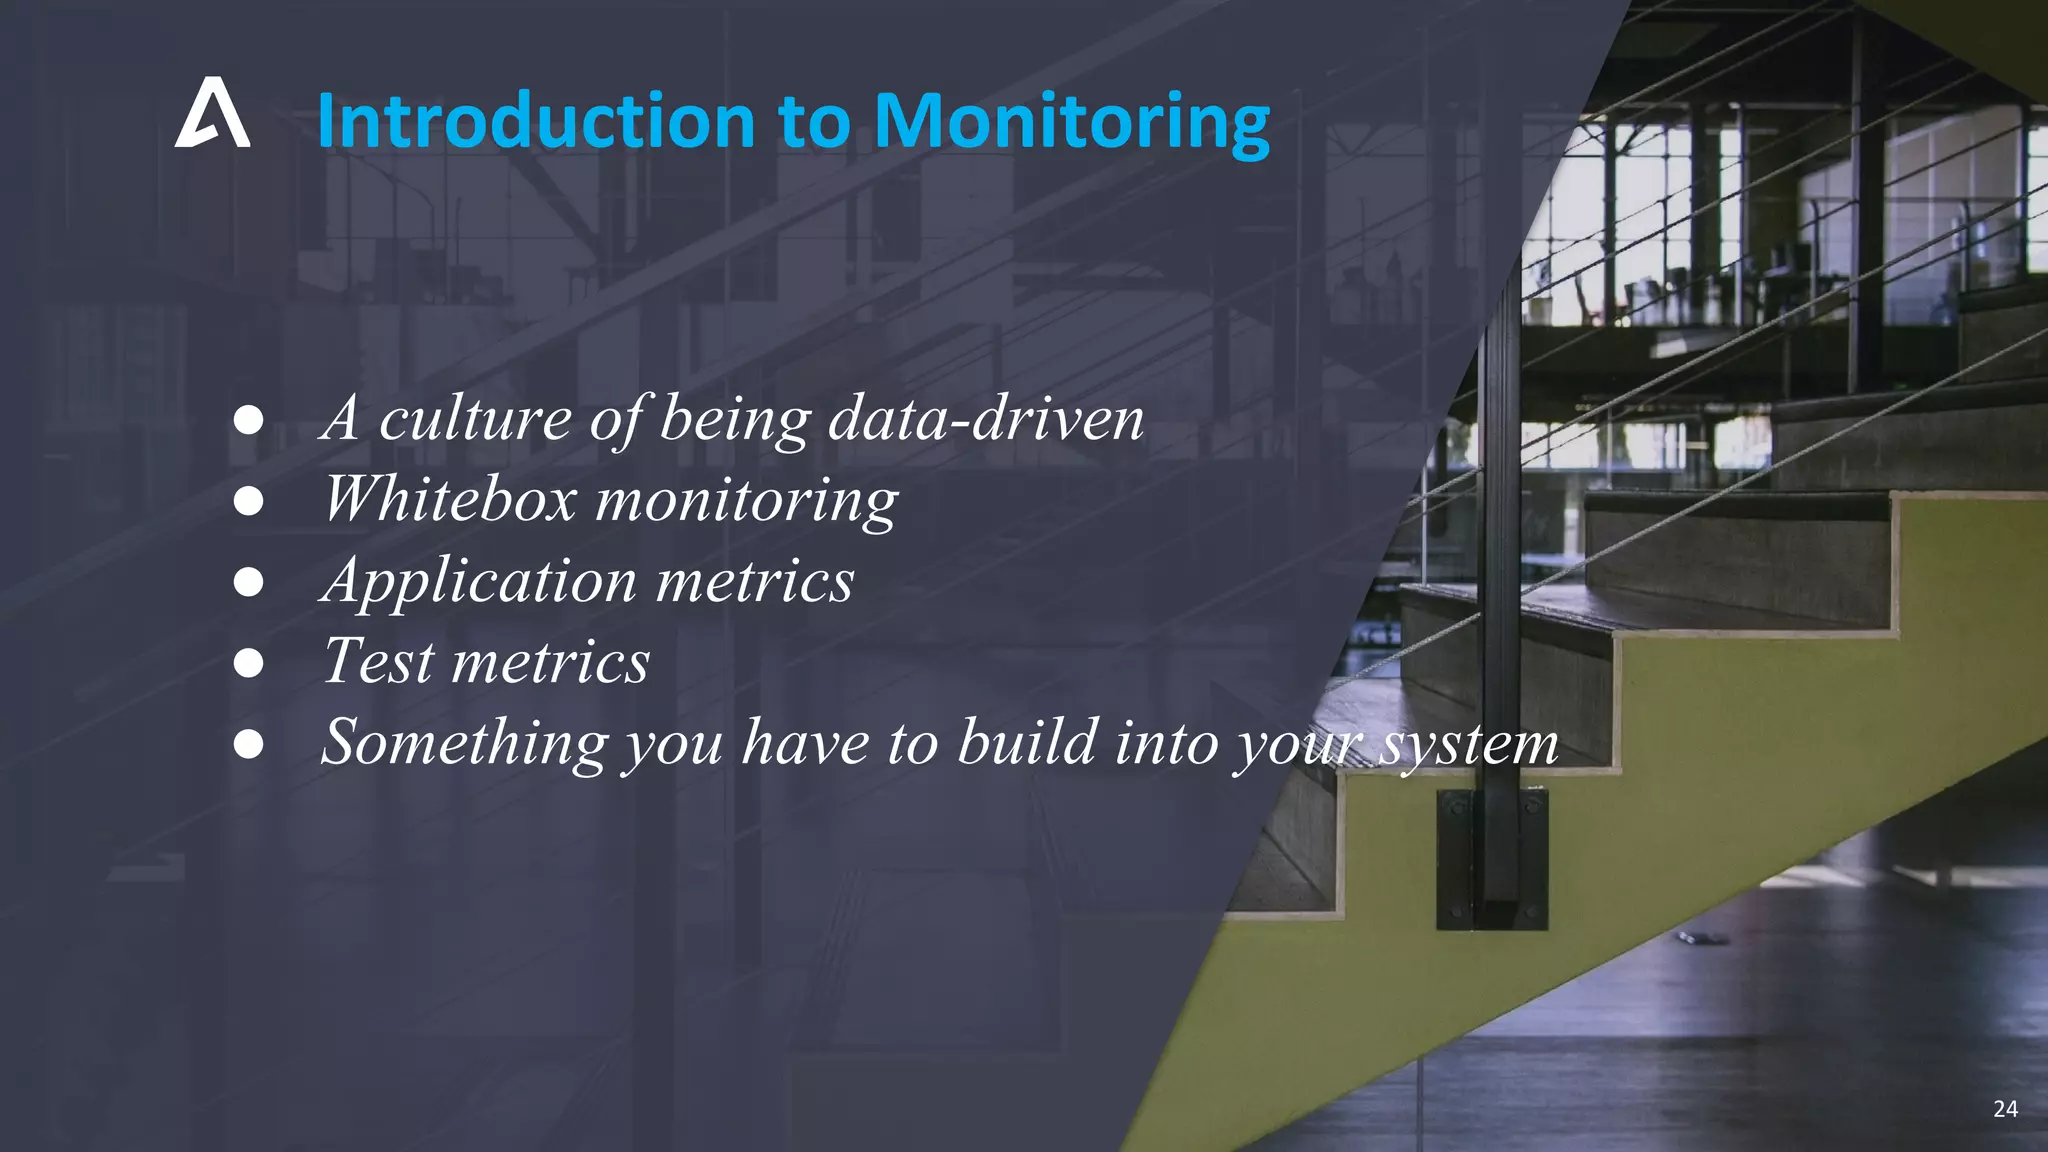
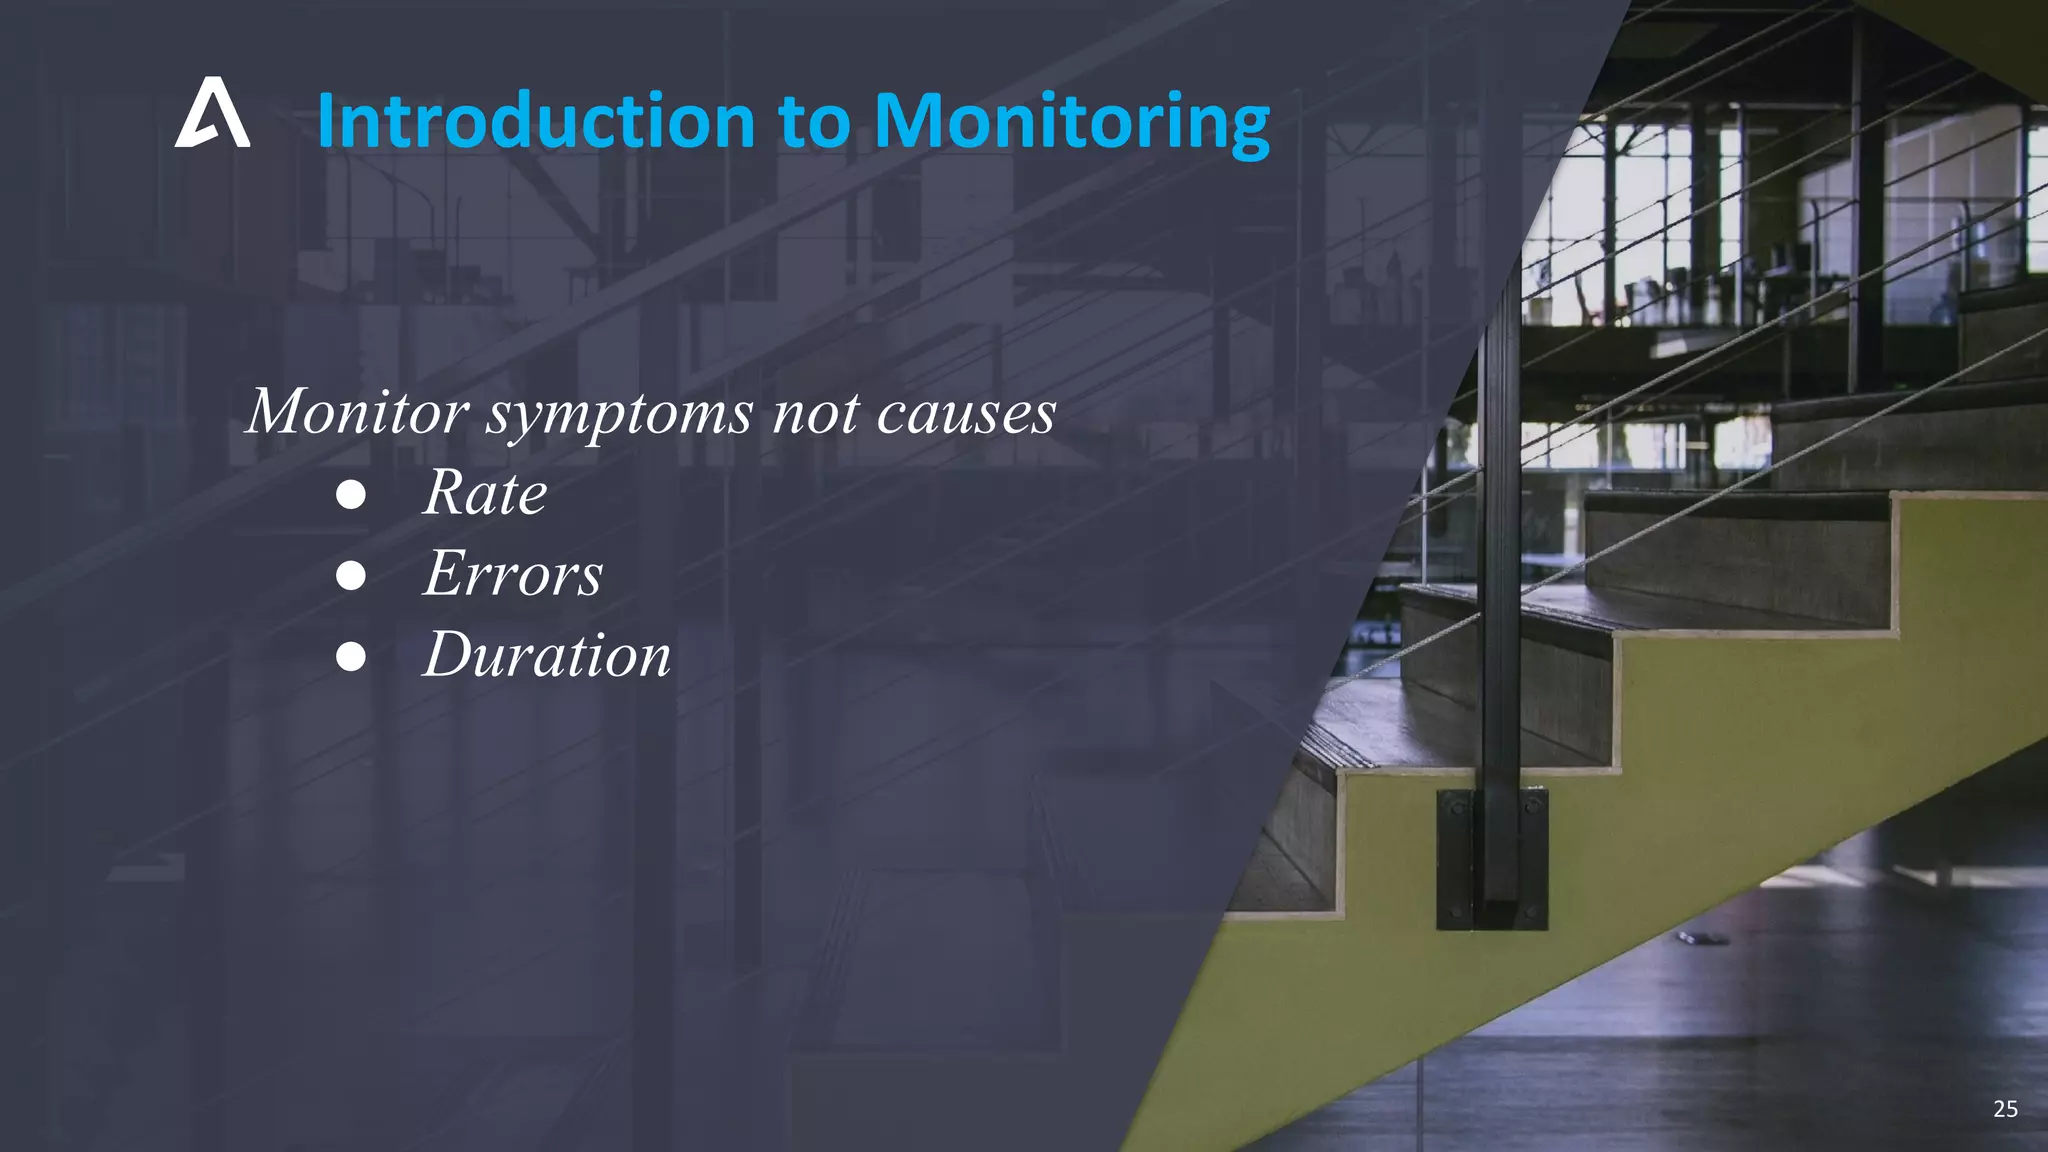
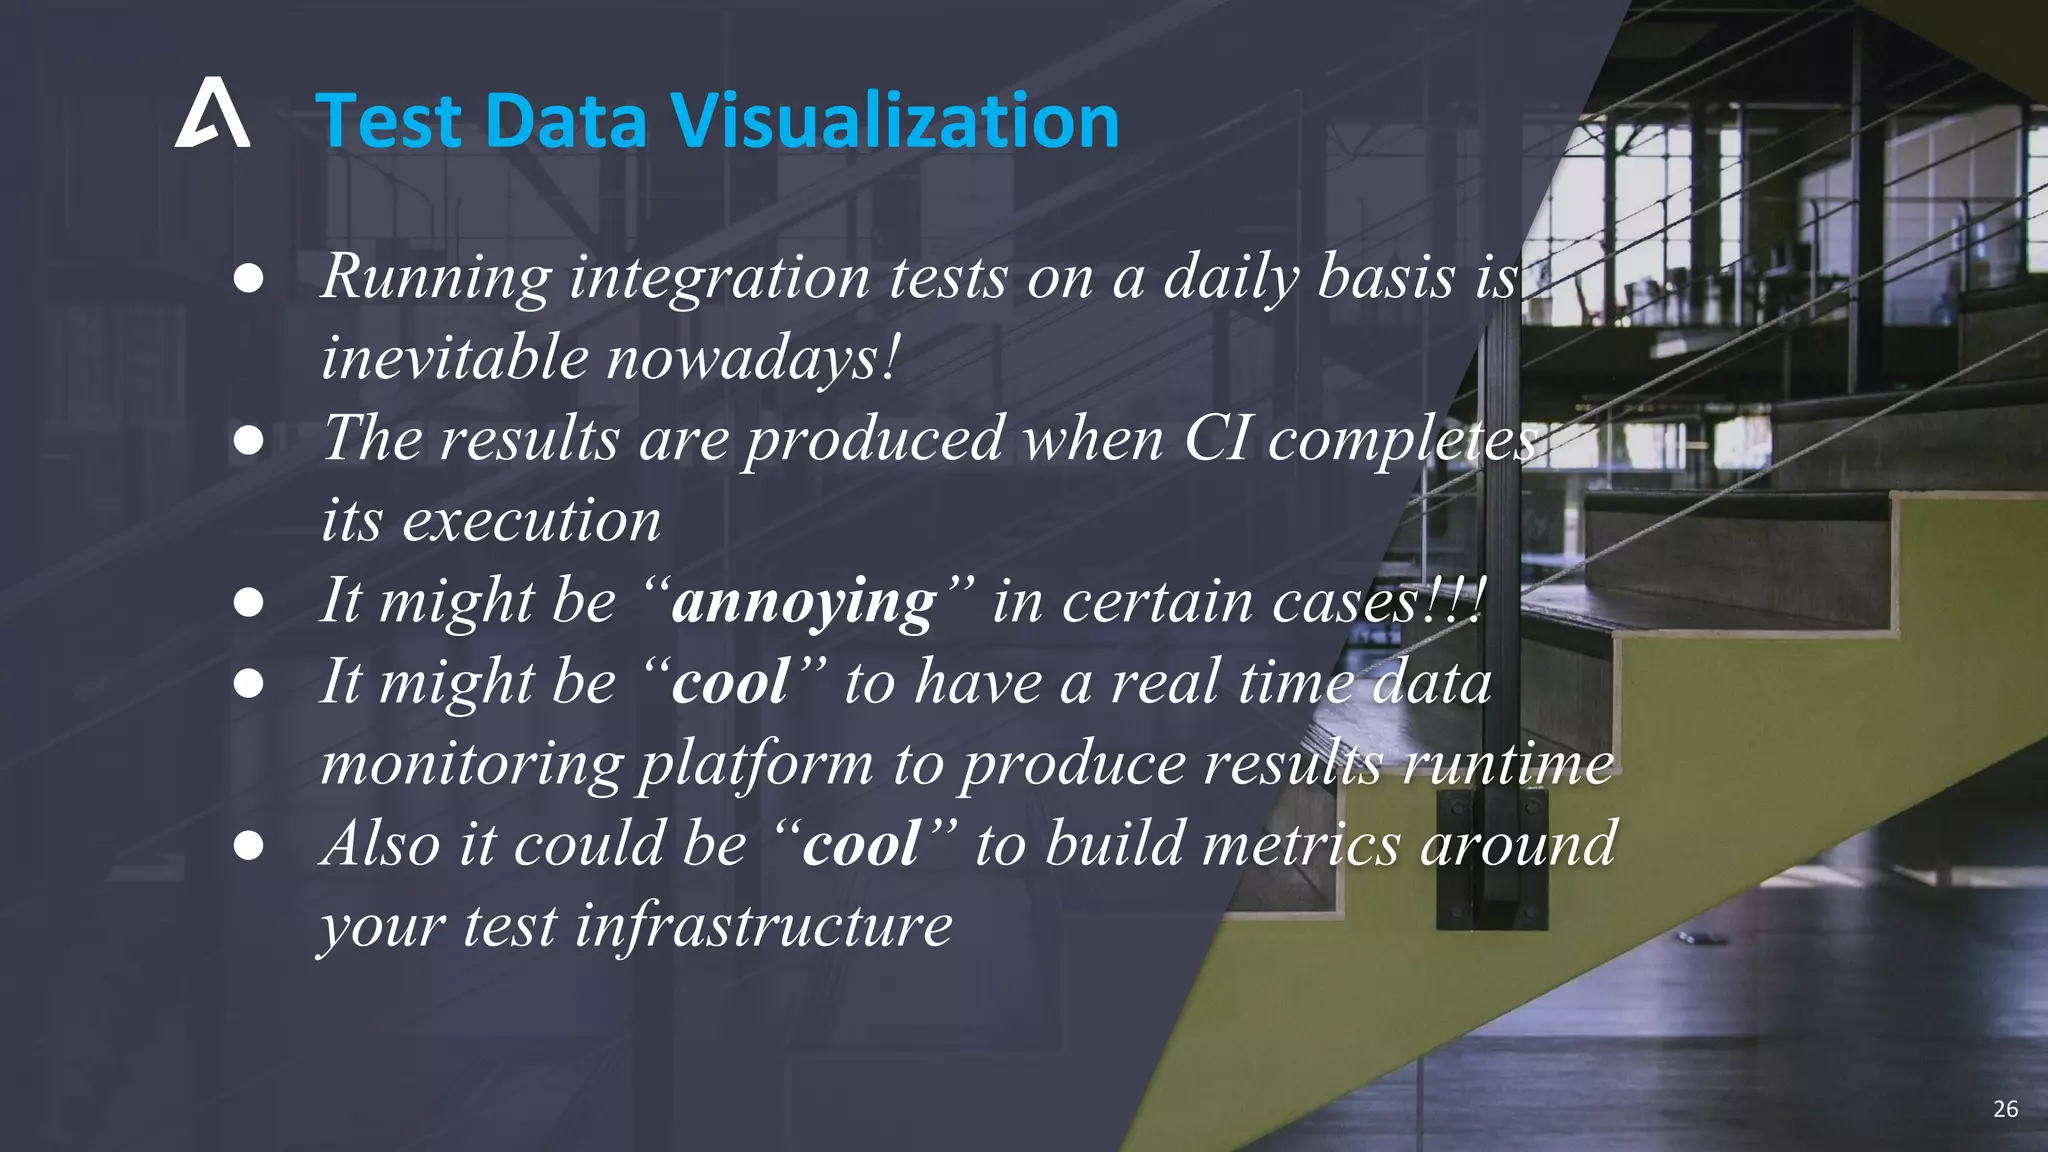

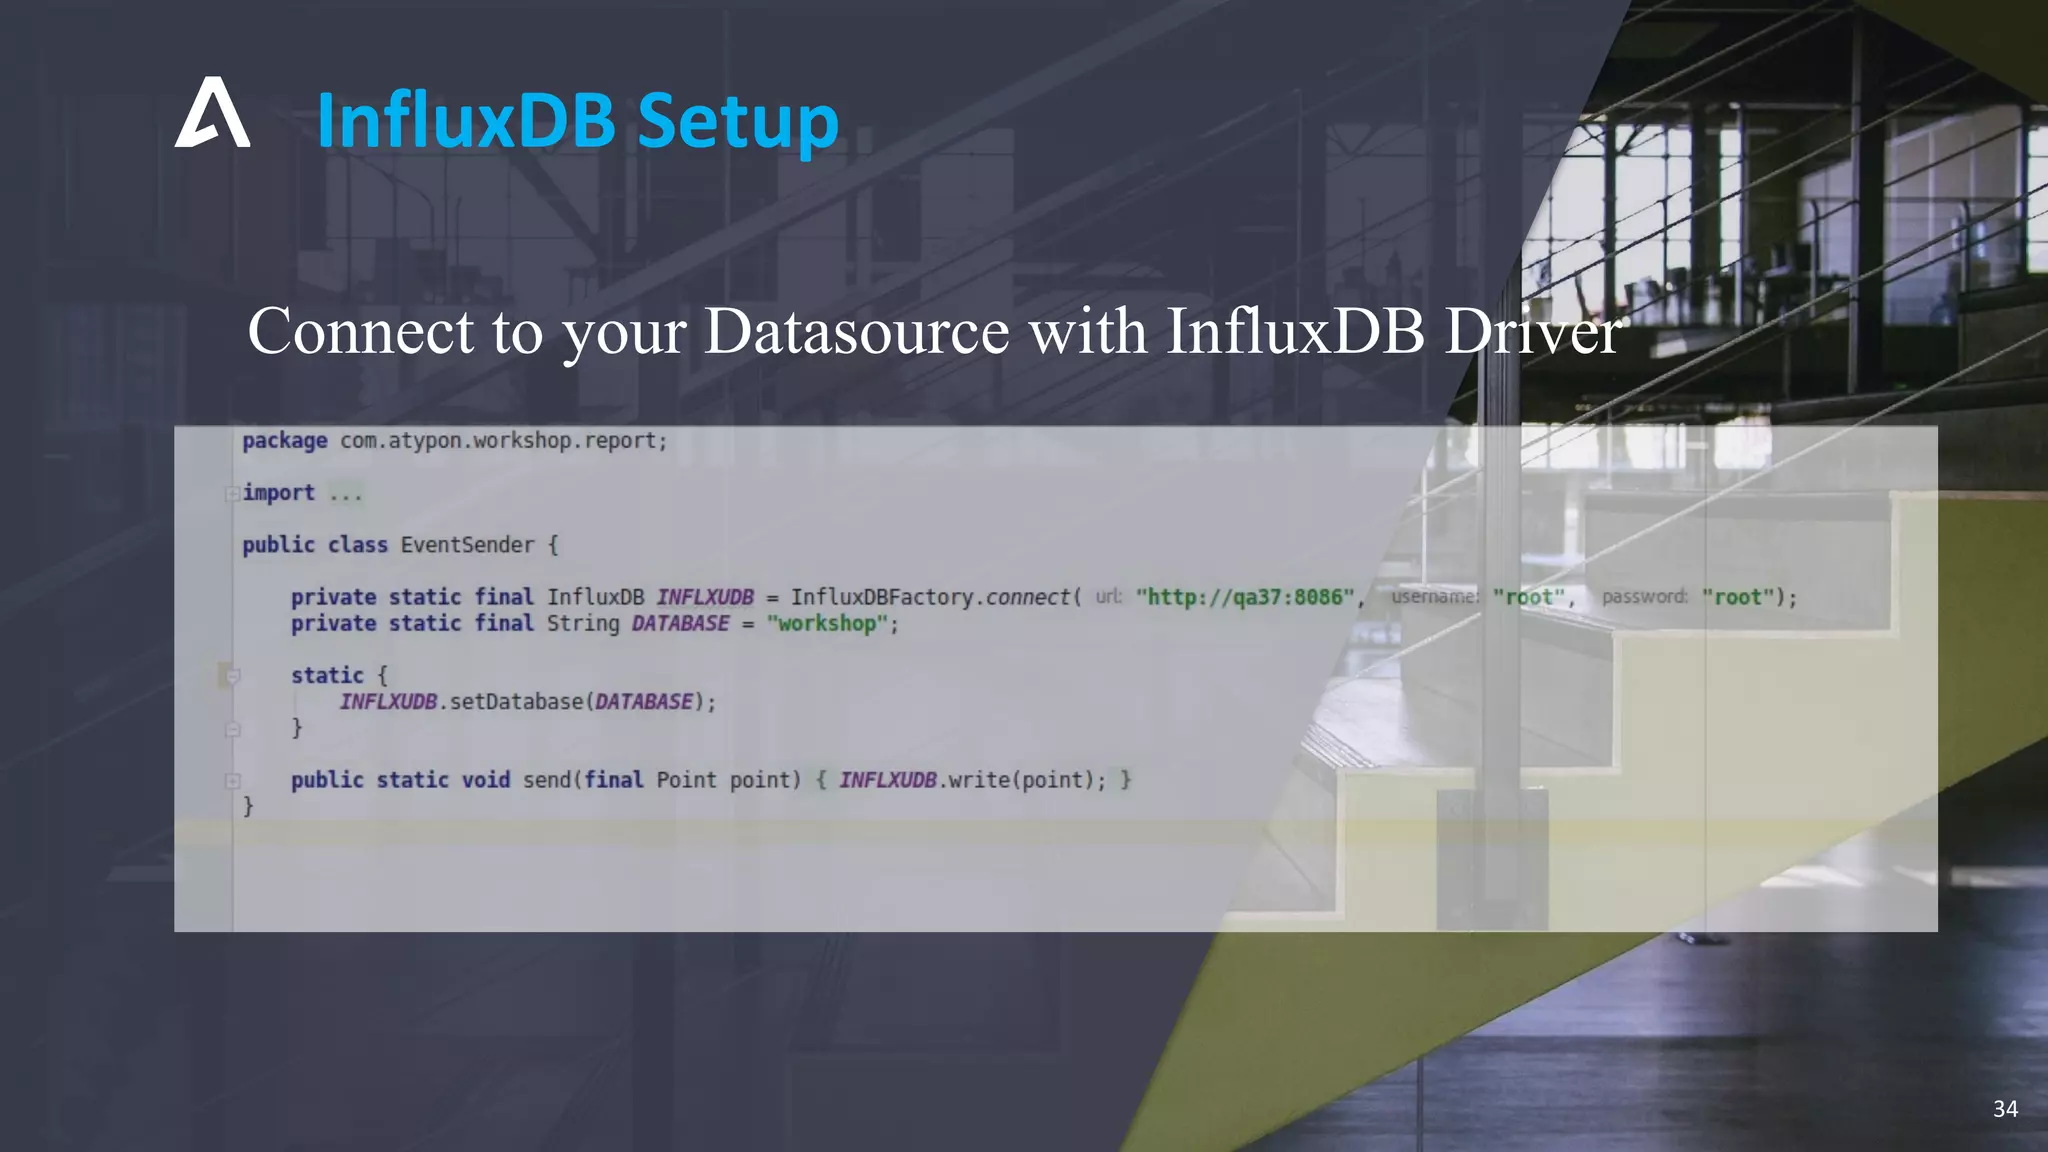
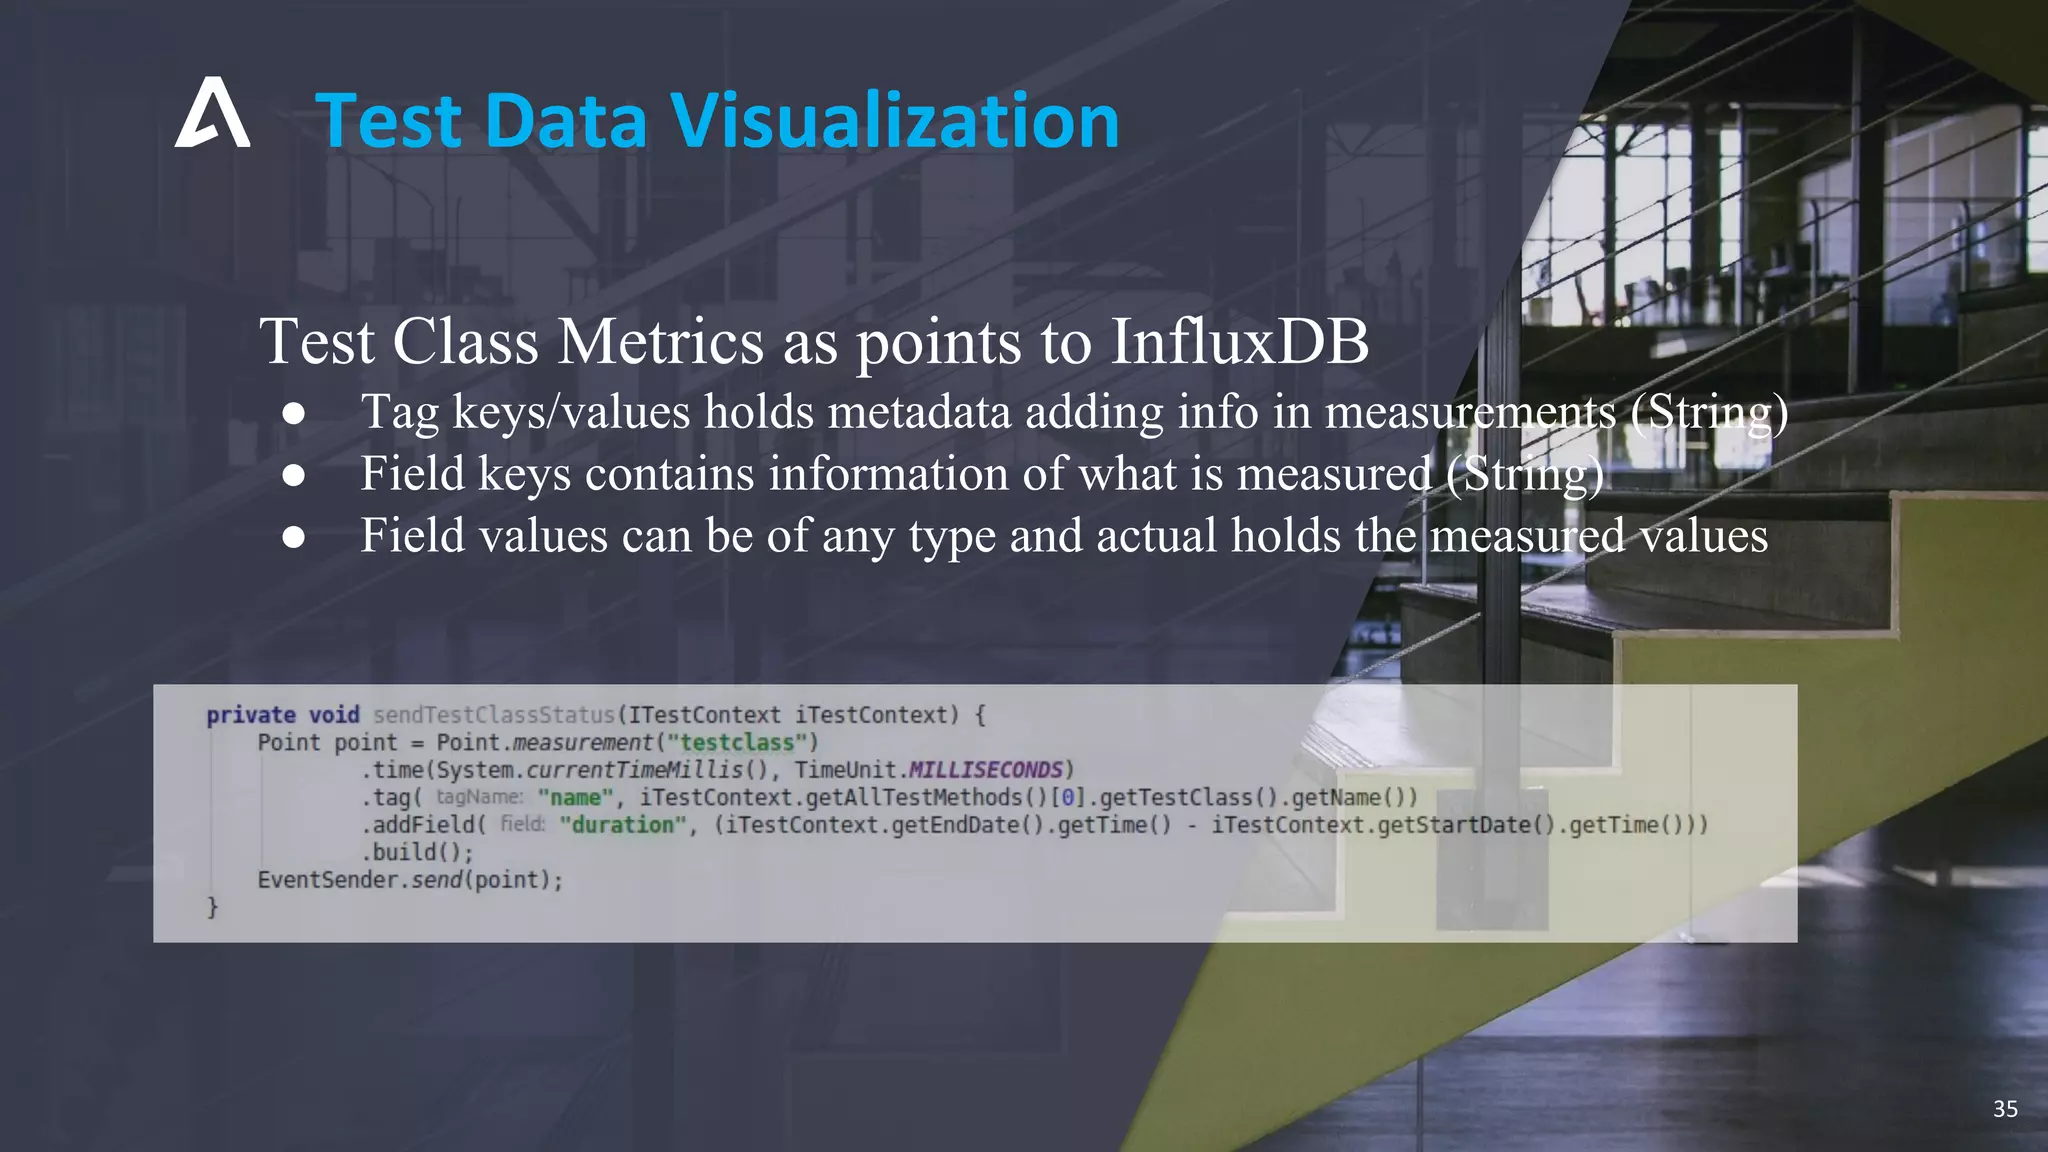
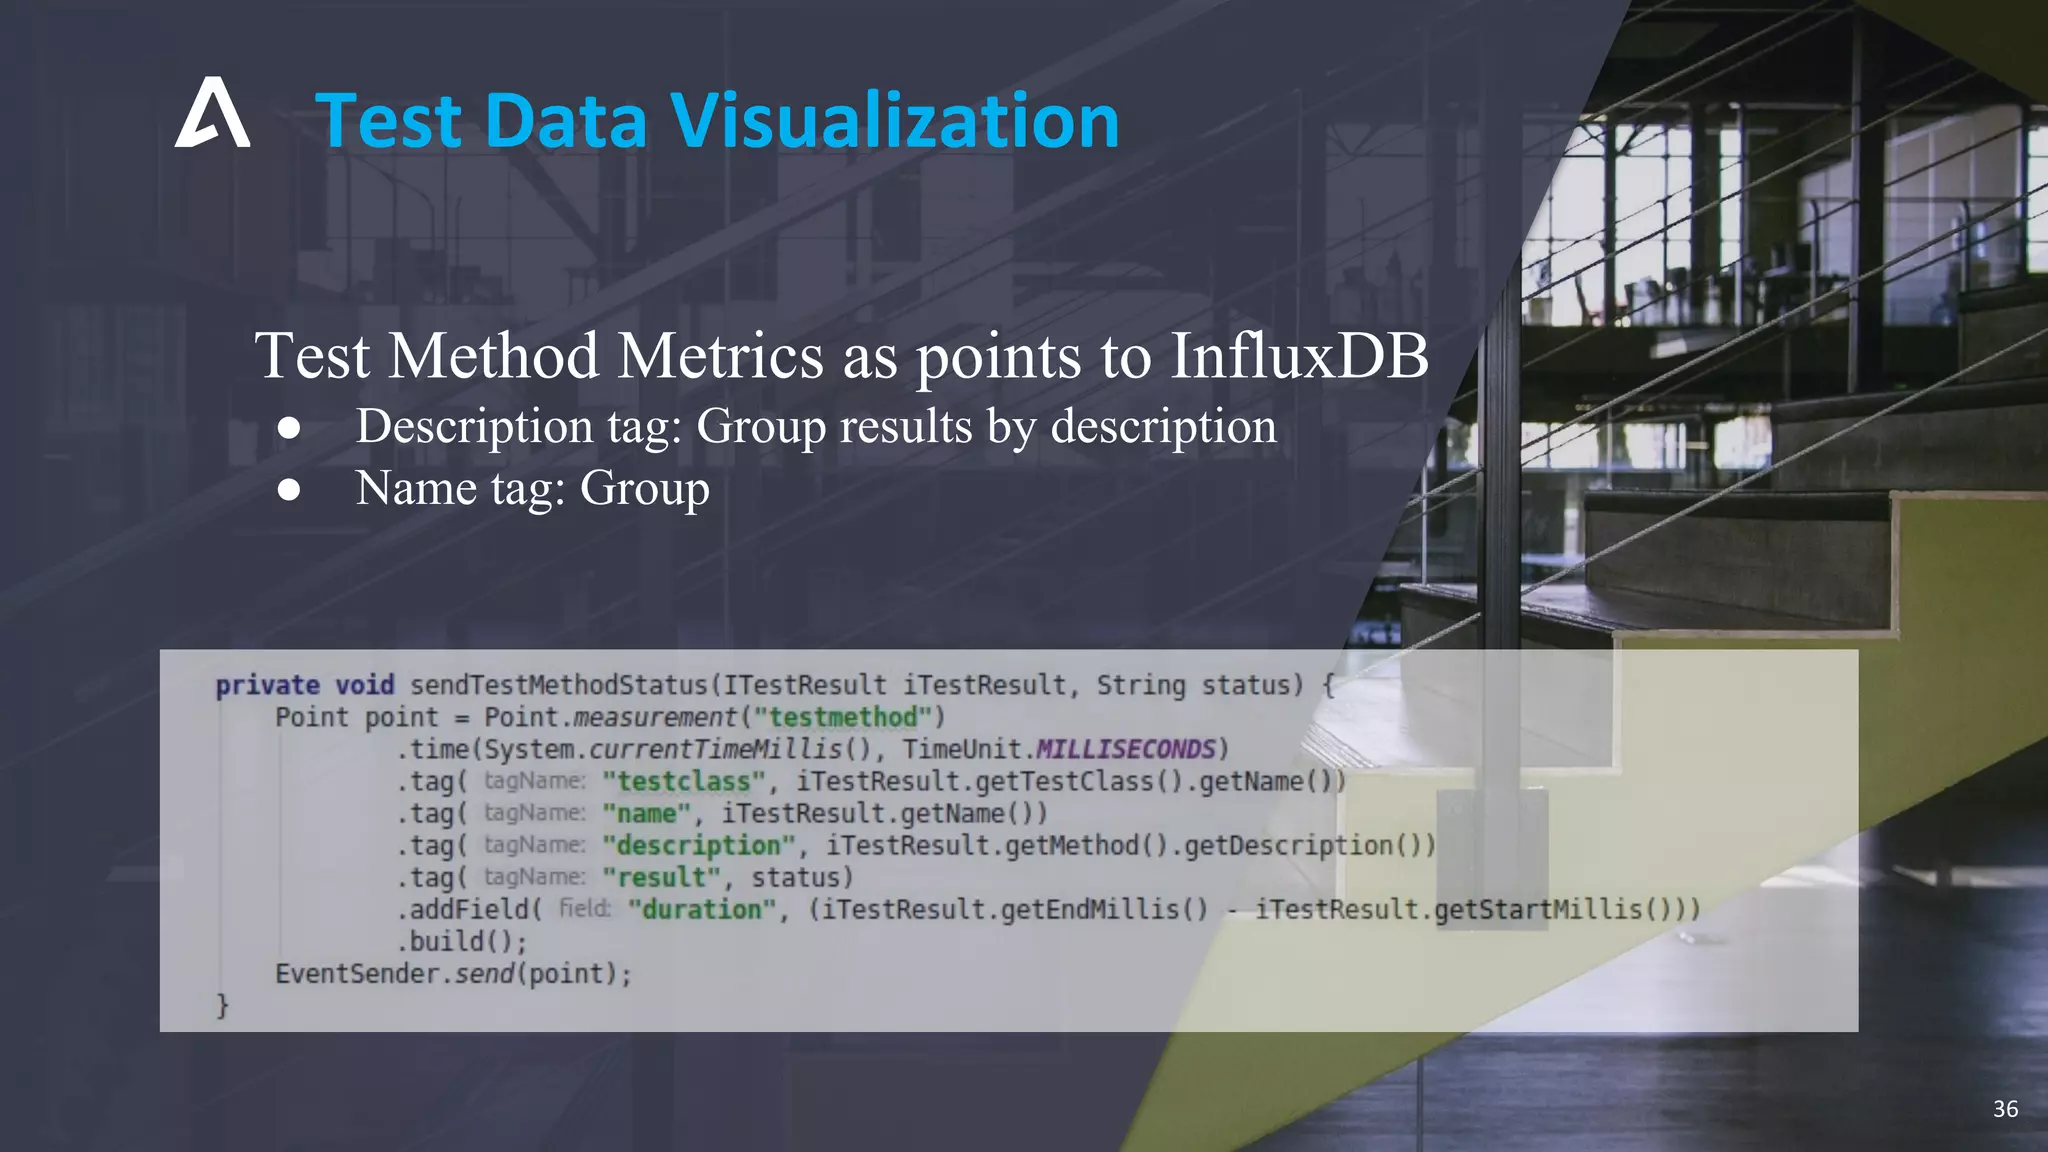
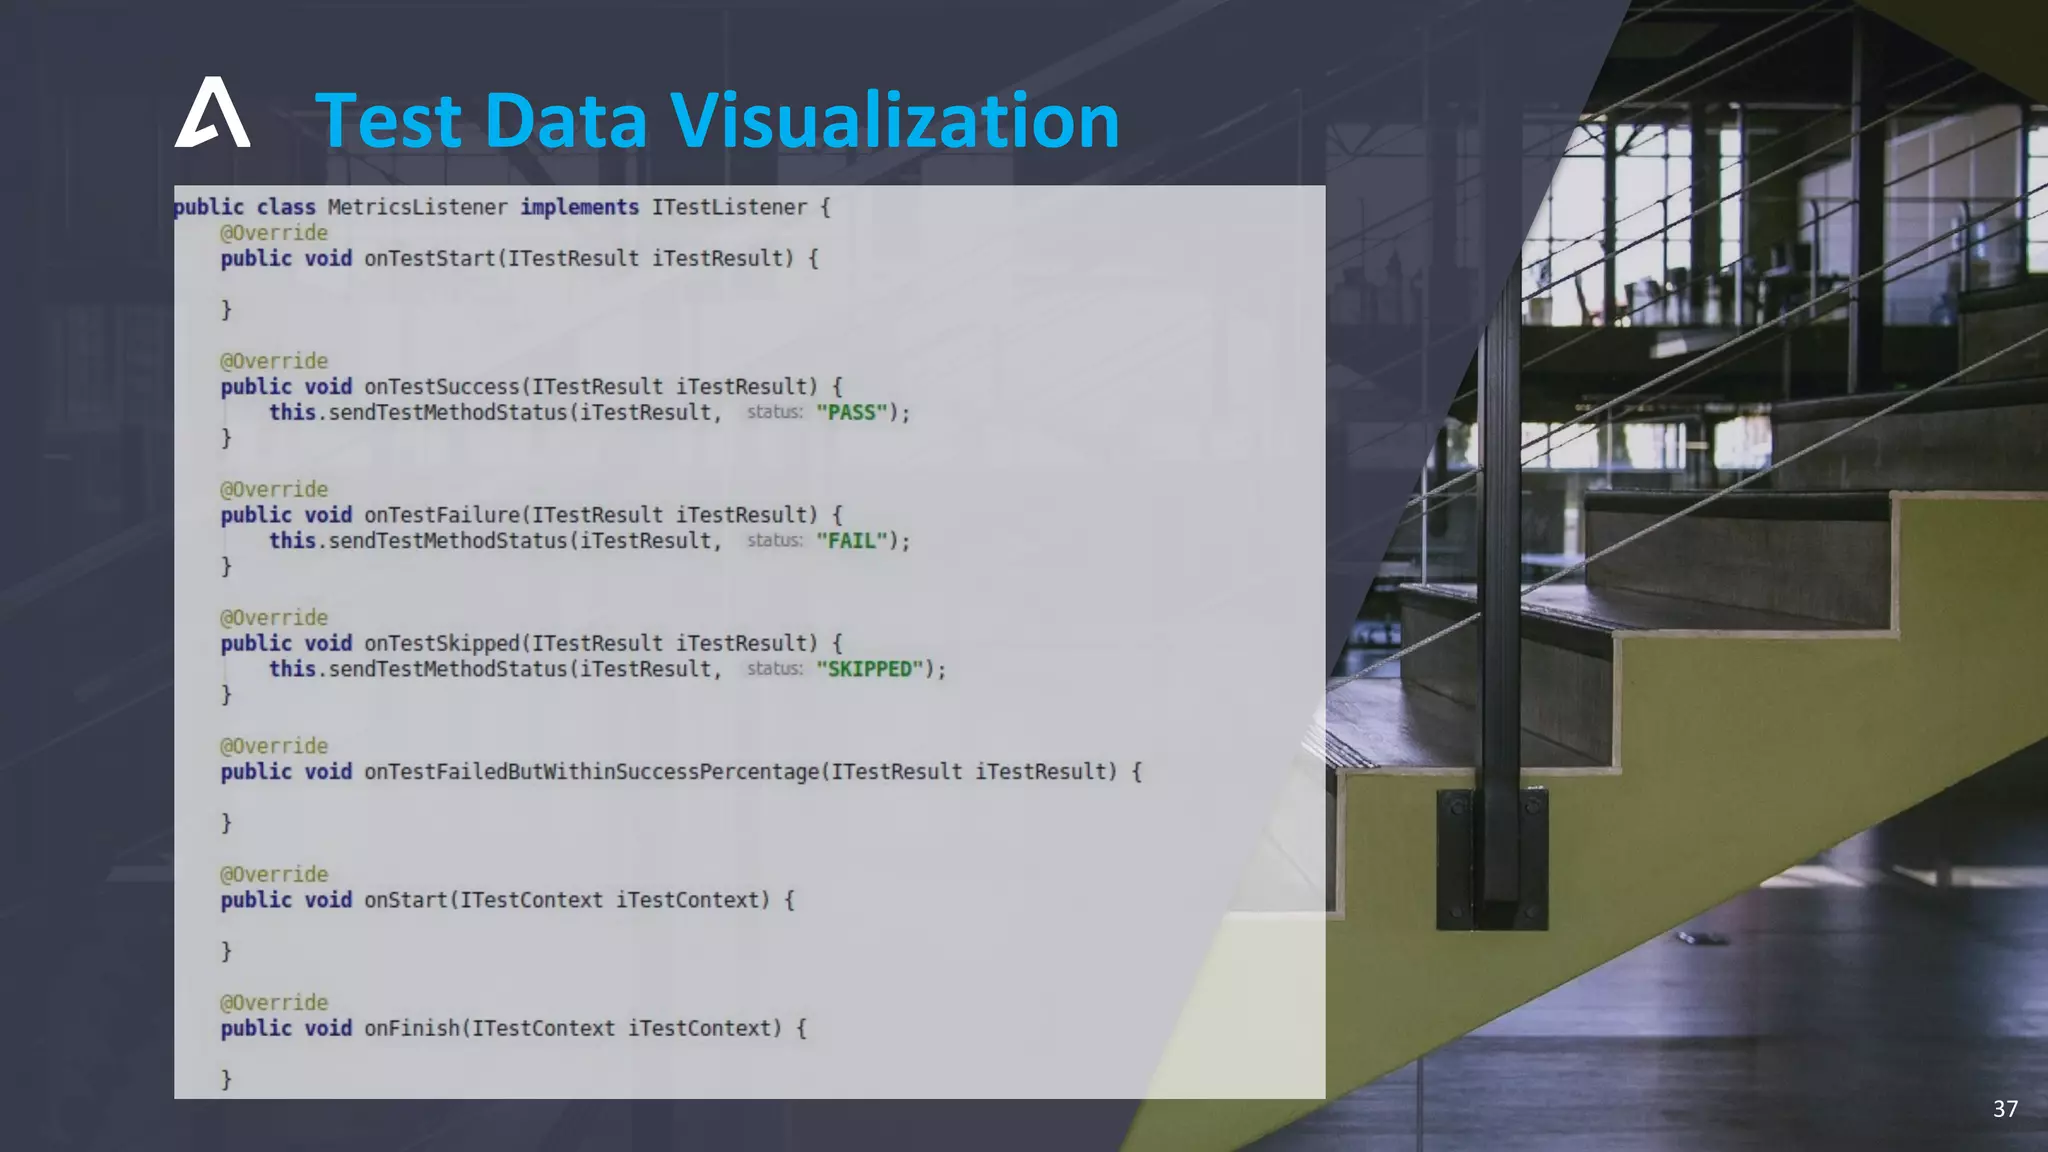
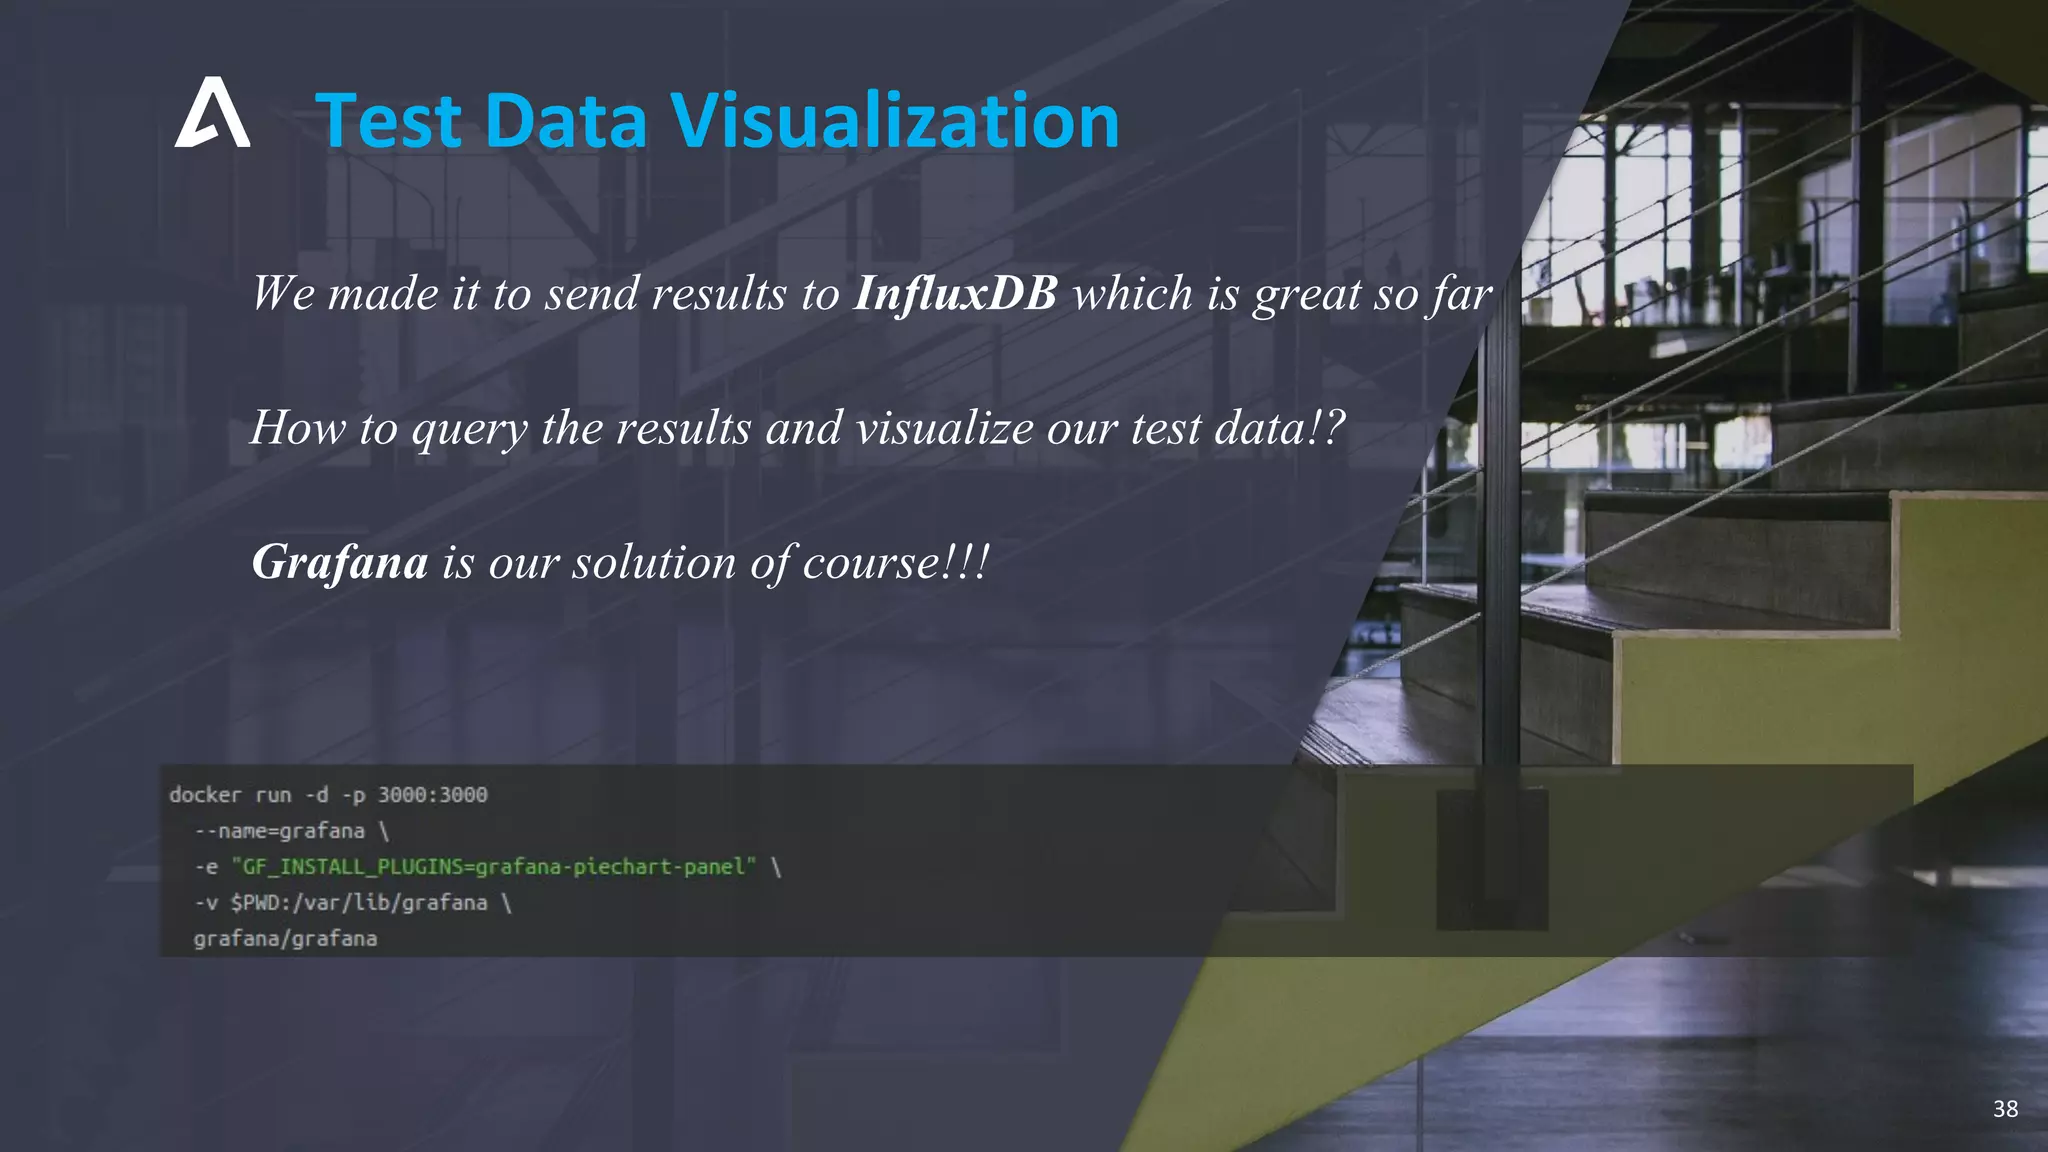
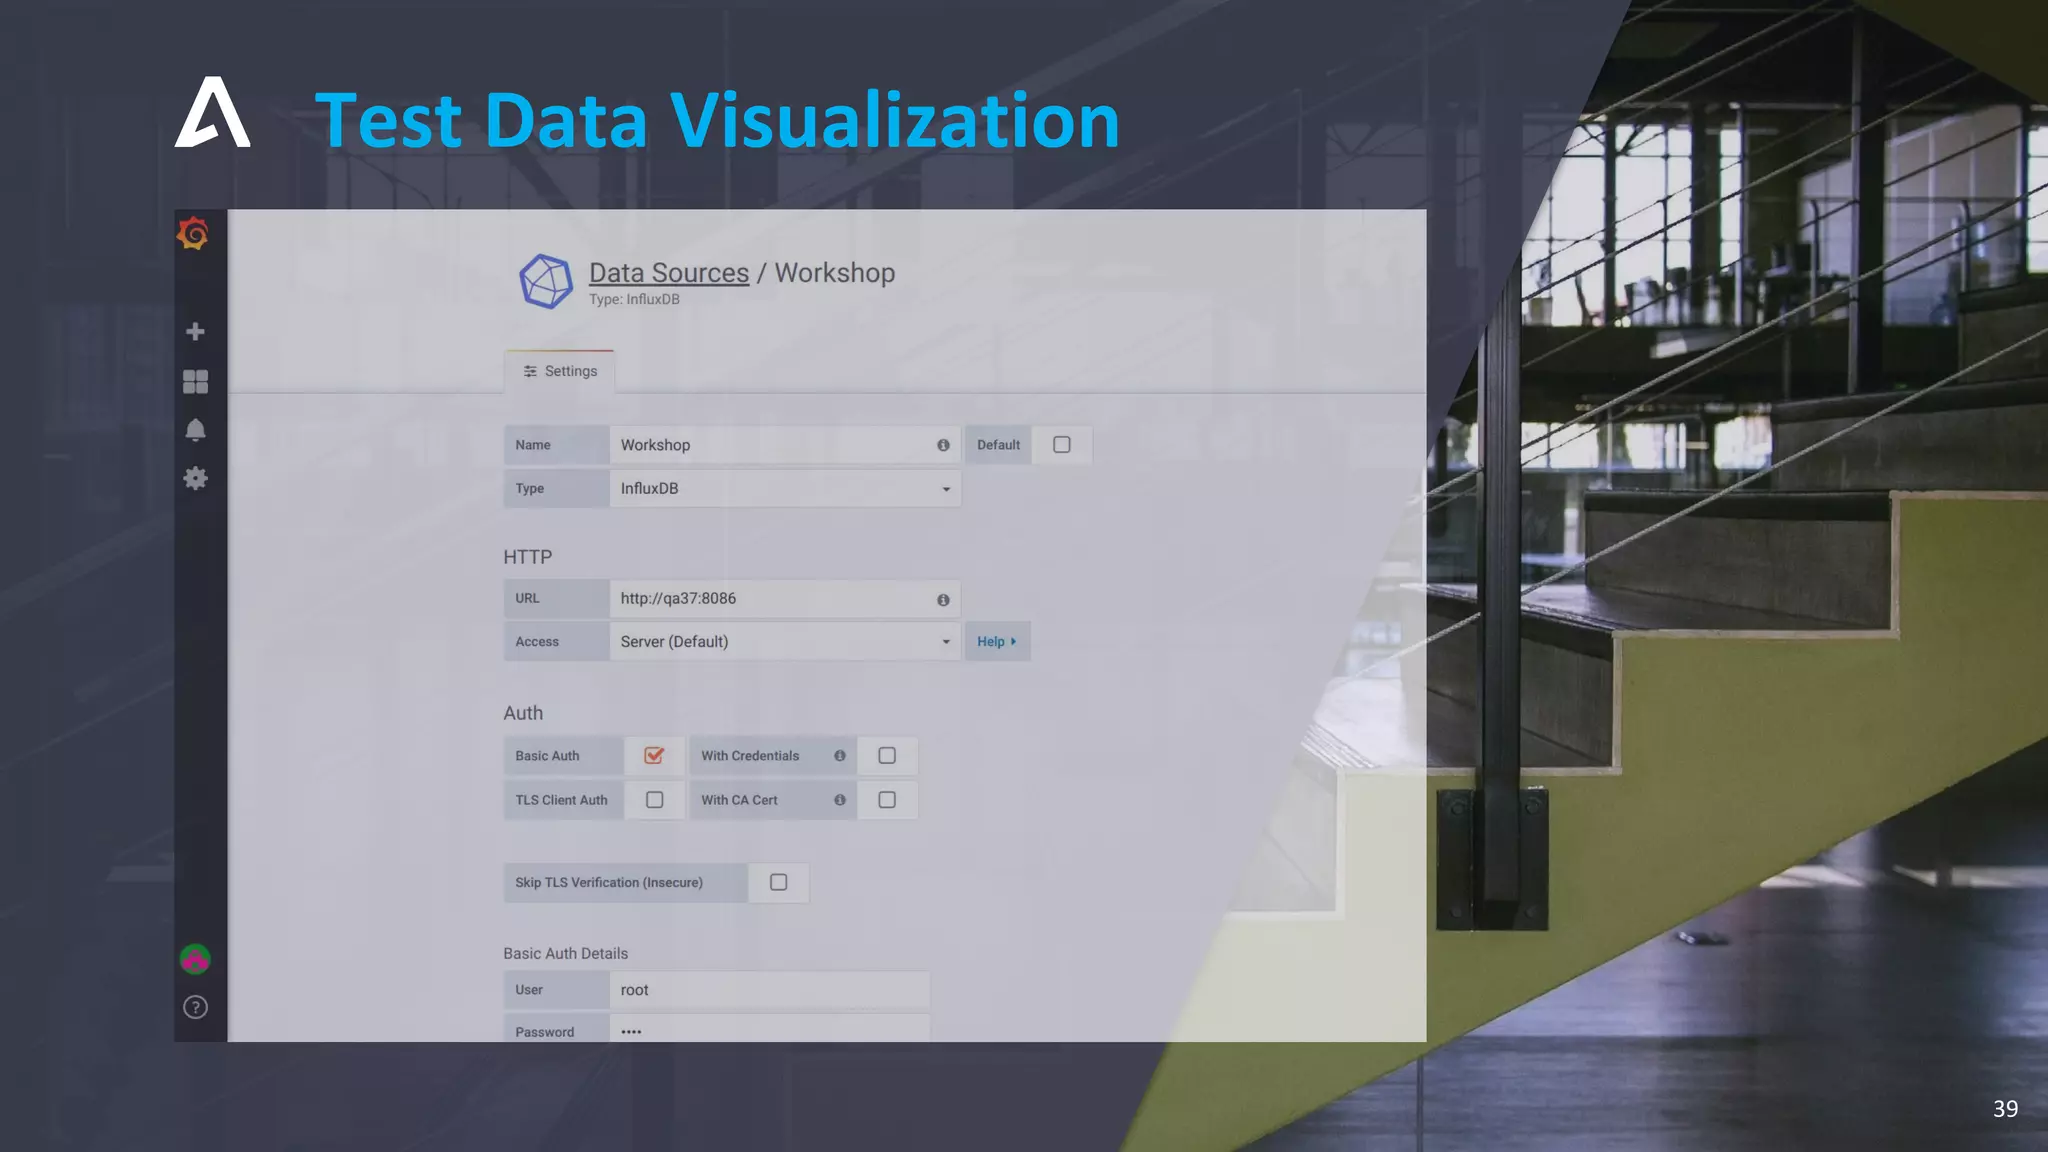
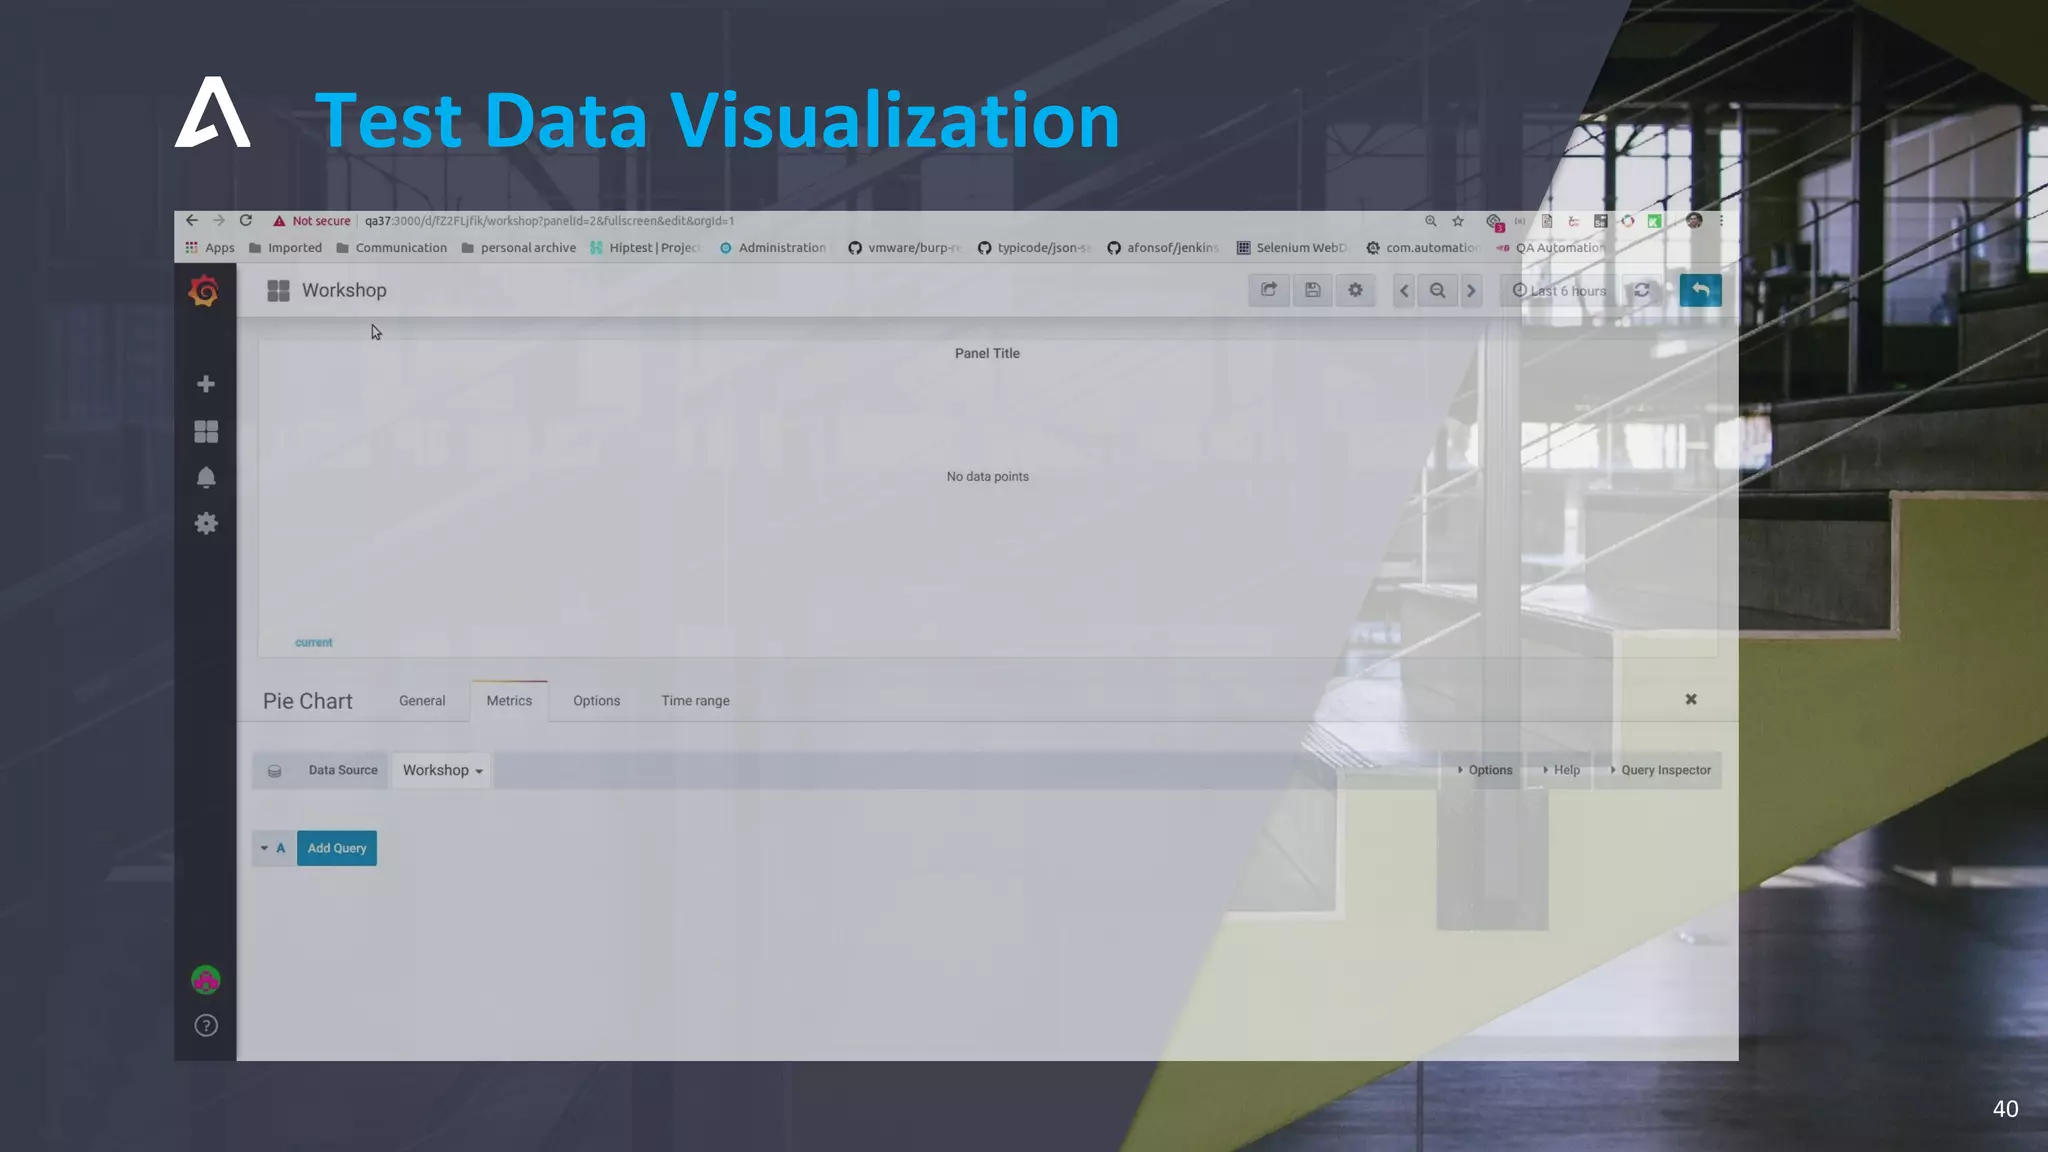
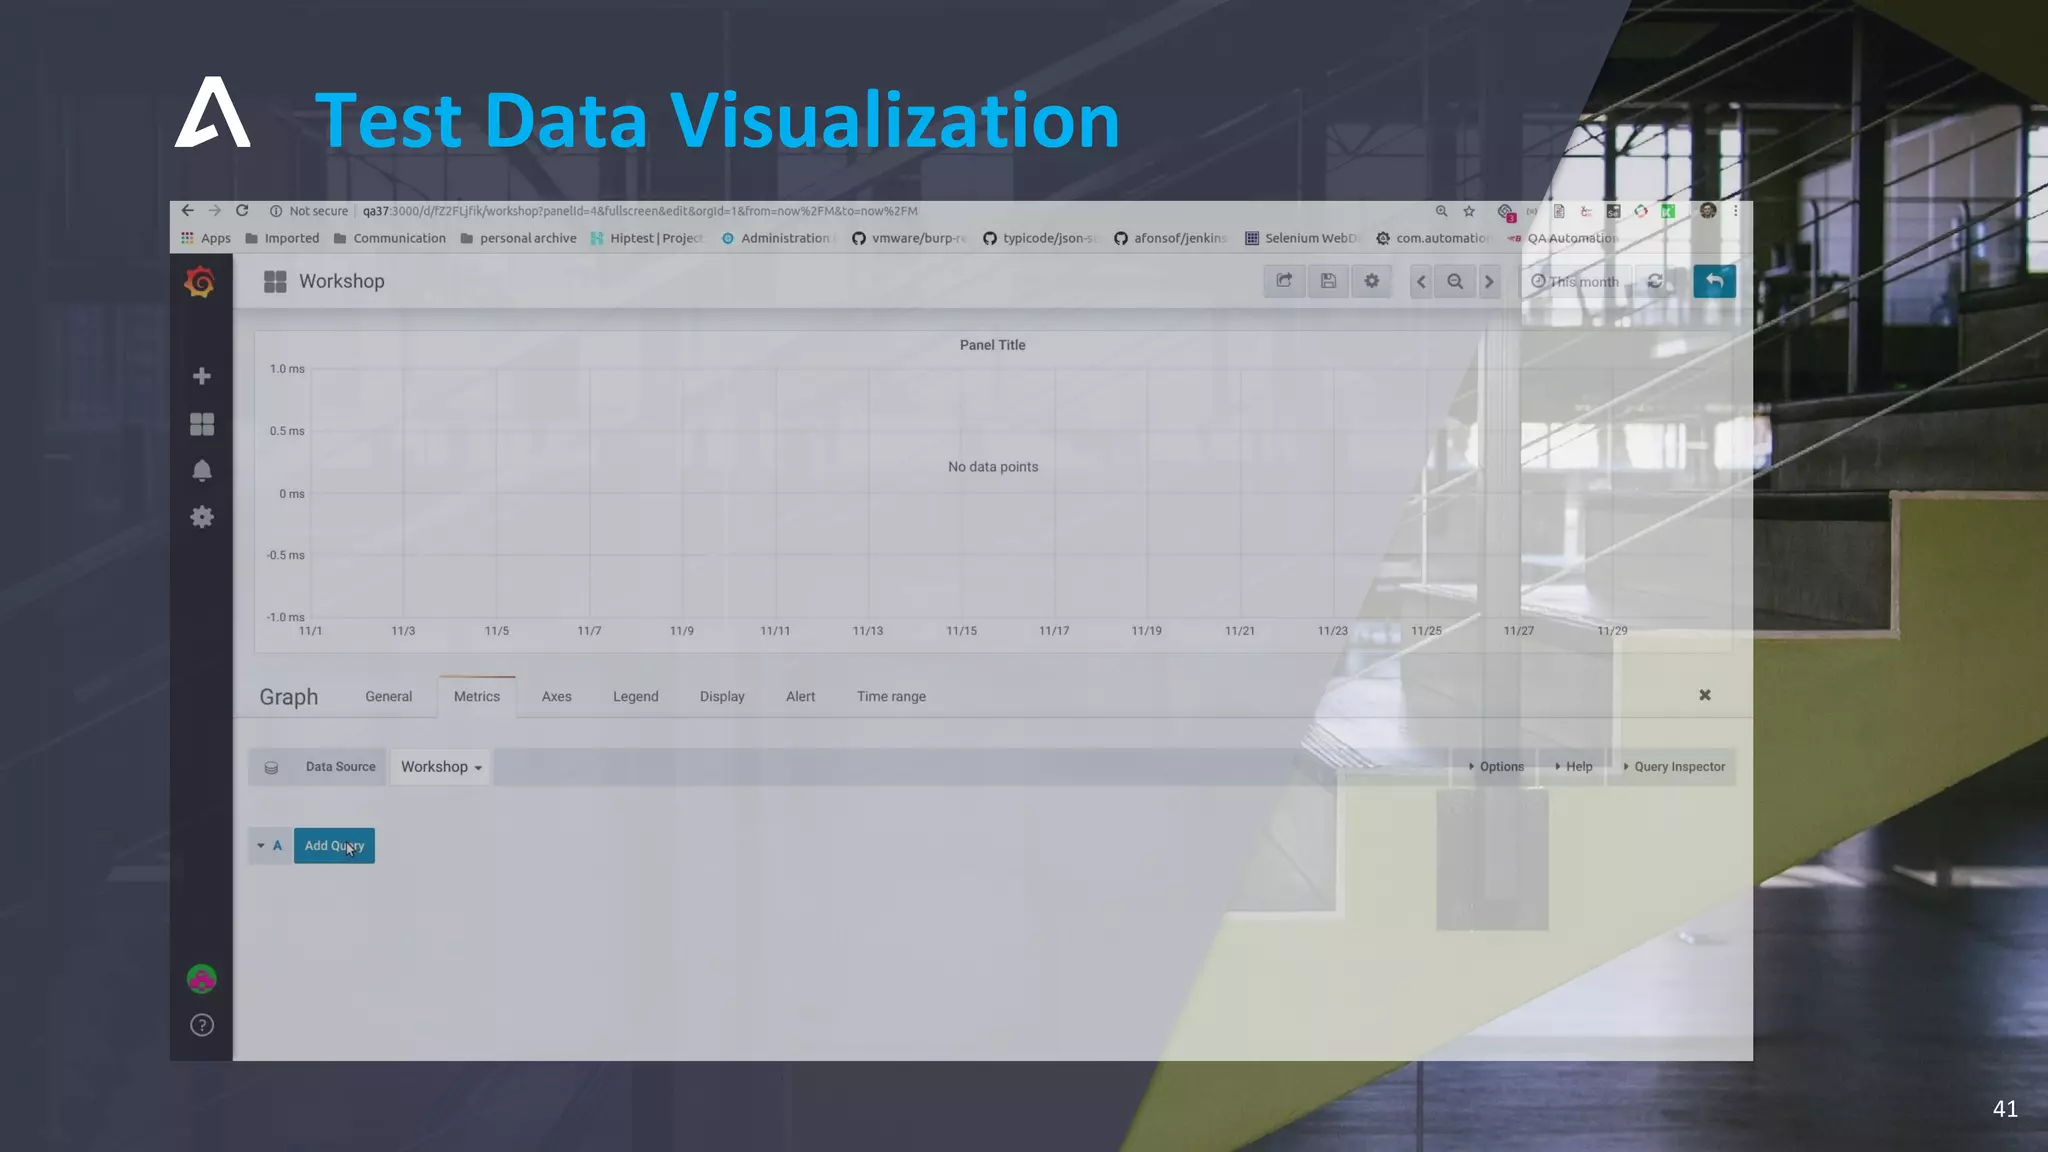
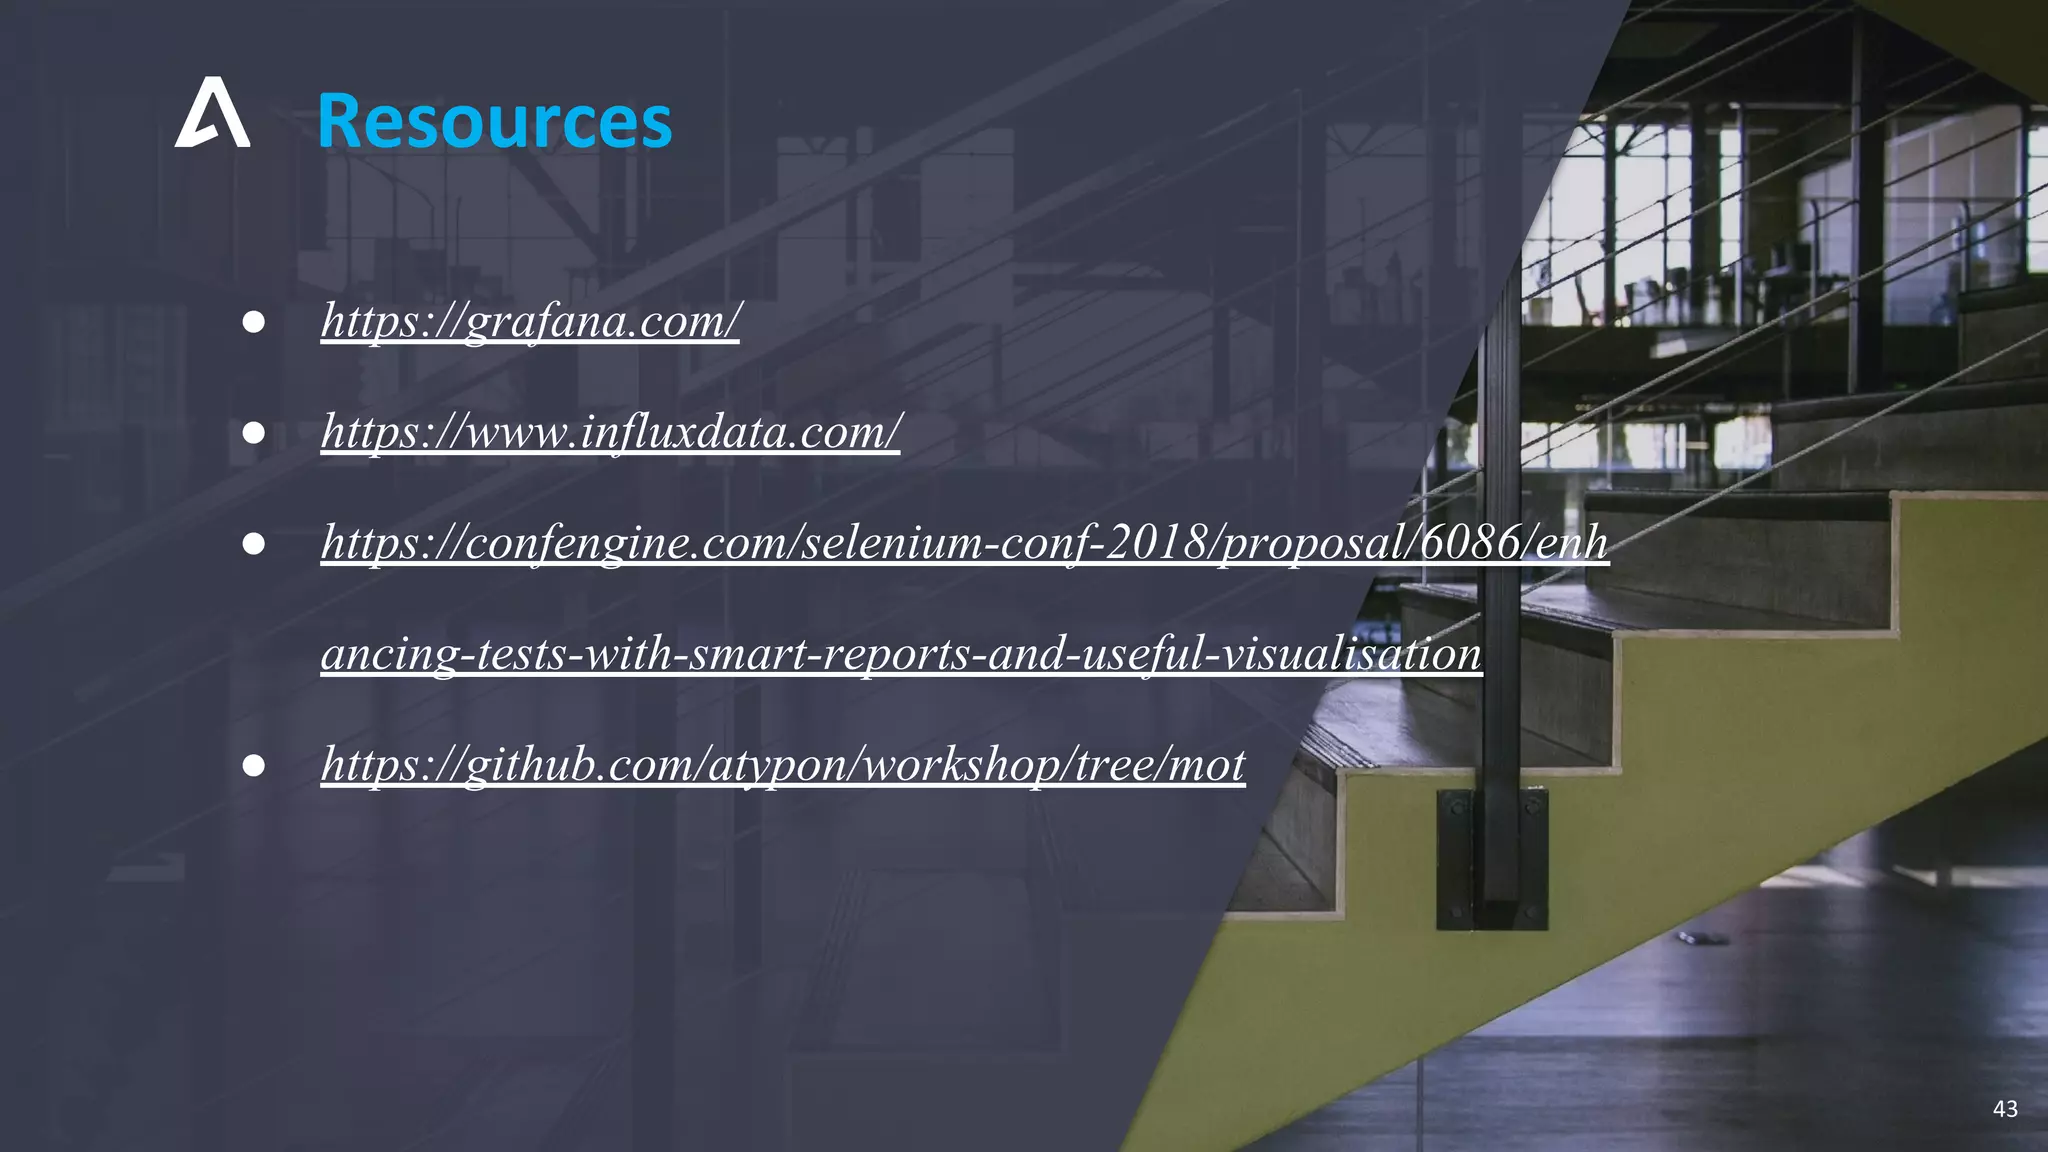


This document discusses using Grafana to visualize test data in real time. It provides an introduction to Grafana and monitoring. Test data can be represented as time series data and metrics can be built around test runtime and results. Grafana allows querying and visualizing metrics from various sources. The document demonstrates collecting test class and method results as time series data points in InfluxDB and then querying and visualizing the results in Grafana dashboards. This provides real-time monitoring of test data.


![Ronald McCollam [Grafana] | Flux Queries in Grafana 7 | InfluxDays Virtual Ex...](https://cdn.slidesharecdn.com/ss_thumbnails/2020november-influxdayspresentation-201026193856-thumbnail.jpg?width=640&height=640&fit=bounds)


![Aengus Rooney [Grafana] | What's New with Grafana and InfluxDB | InfluxDays E...](https://cdn.slidesharecdn.com/ss_thumbnails/aengusrooneyslides-210511204556-thumbnail.jpg?width=640&height=640&fit=bounds)


