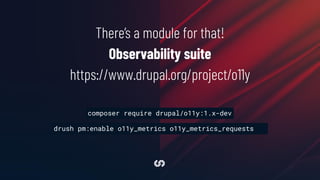
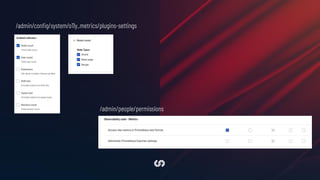
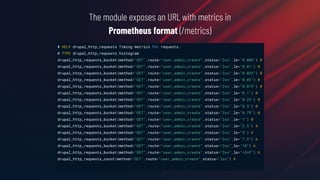
Download as PDF, PPTX


![services:
monolog.handler.rotating_file:
class: MonologHandlerRotatingFileHandler
arguments: ['private://logs/debug.log', 10, 'INFO']
First of all define a new service in the service container
sites/default/monolog.services.yml](https://image.slidesharecdn.com/doyouknowwhatyourdrupalisdoingobserveitdrupalconprague-220921065308-fe828d5b/85/Do-you-know-what-your-Drupal-is-doing-Observe-it-DrupalCon-Prague-2022-19-320.jpg)
![parameters:
monolog.channel_handlers:
default:
handlers:
- name: 'rotating_file'
formatter: 'json'
monolog.processors: [
'message_placeholder', 'current_user',
'request_uri', 'ip', 'referer',
'filter_backtrace', 'introspection'
]
Then define handlers, formatter
and processors using service
container parameters. Here we're
configuring the default channel to
catch all log messages and to save
them using the
monolog.handler.rotating_file
service, in json format and after
being processed by a set of
processors
sites/default/monolog.services.yml](https://image.slidesharecdn.com/doyouknowwhatyourdrupalisdoingobserveitdrupalconprague-220921065308-fe828d5b/85/Do-you-know-what-your-Drupal-is-doing-Observe-it-DrupalCon-Prague-2022-20-320.jpg)
![$settings['container_yamls'][] =
DRUPAL_ROOT . '/sites/default/monolog.services.yml';
Add monolog.services.yml to
the list of container’s yamls in settings.php file
sites/default/settings.php](https://image.slidesharecdn.com/doyouknowwhatyourdrupalisdoingobserveitdrupalconprague-220921065308-fe828d5b/85/Do-you-know-what-your-Drupal-is-doing-Observe-it-DrupalCon-Prague-2022-21-320.jpg)


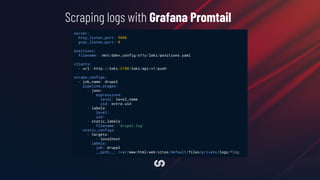


![scrape_configs:
- job_name: 'drupal'
scrape_interval: 5s
static_configs:
- targets: ['web:80']
Scraping and sending metrics to Grafana Prometheus](https://image.slidesharecdn.com/doyouknowwhatyourdrupalisdoingobserveitdrupalconprague-220921065308-fe828d5b/85/Do-you-know-what-your-Drupal-is-doing-Observe-it-DrupalCon-Prague-2022-37-320.jpg)

![$class_loader->addPsr4('Drupaltracer', [ __DIR__ . '/../../modules/contrib/tracer/src']);
$settings['container_base_class'] = 'DrupaltracerDependencyInjectionTraceableContainer';
$settings['tracer_plugin'] = 'o11y_tracer';
sites/default/settings.php
There should be only one module that instruments the code at a time. We need to replace a lot
of services and subsystems with traceable versions.
To avoid code duplication we create a third project: Tracer
(https://www.drupal.org/project/tracer) which both WebProfiler and Observability suite
depend on.
https://blog.sparkfabrik.com/en/webprofiler-updates](https://image.slidesharecdn.com/doyouknowwhatyourdrupalisdoingobserveitdrupalconprague-220921065308-fe828d5b/85/Do-you-know-what-your-Drupal-is-doing-Observe-it-DrupalCon-Prague-2022-47-320.jpg)

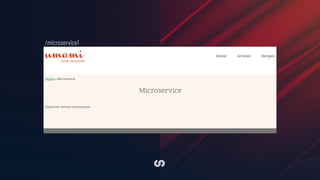
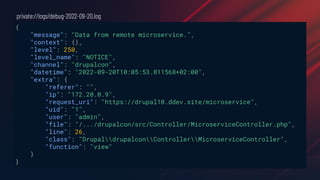
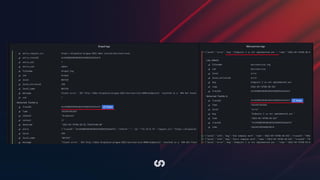
![class MicroserviceController extends ControllerBase {
private Client $httpClient;
public static function create(ContainerInterface $container) {
return new static(
$container->get('http_client')
);
}
final public function __construct(Client $httpClient) {
$this->httpClient = $httpClient;
}
public function view() {
$response = $this->httpClient->get('http://ddev-drupal10-microservice:8080/endpoint1');
$json = json_decode($response->getBody()->getContents());
$this->loggerFactory->get(drupalcon)->notice($json->message);
return [
'#theme => 'microservice',
'#message' => $json->message,
];
}
}](https://image.slidesharecdn.com/doyouknowwhatyourdrupalisdoingobserveitdrupalconprague-220921065308-fe828d5b/85/Do-you-know-what-your-Drupal-is-doing-Observe-it-DrupalCon-Prague-2022-51-320.jpg)
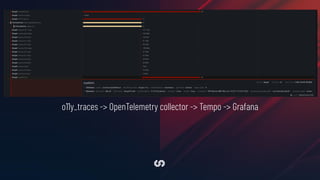
![receivers:
otlp:
protocols:
http:
processors:
batch:
exporters:
otlphttp:
endpoint: http://tempo:4318
service:
pipelines:
traces:
receivers: [otlp]
processors: [batch]
exporters: [otlphttp]
OpenTelemetry collector to send traces to a
Grafana Tempo instance](https://image.slidesharecdn.com/doyouknowwhatyourdrupalisdoingobserveitdrupalconprague-220921065308-fe828d5b/85/Do-you-know-what-your-Drupal-is-doing-Observe-it-DrupalCon-Prague-2022-52-320.jpg)
![class MicroserviceController extends ControllerBase {
public function view() {
$response =
$this->httpClient->get('http://ddev-drupal10-microservice:8080/endpoint2');
$json = json_decode($response->getBody()->getContents());
$this->someComplexMethod();
return [...];
}
private function someComplexMethod() {
$tracer = Drupal::service('tracer.tracer');
$span = $tracer->start('custom','someComplexMethod',
['someAttribute' => 'someValue']
);
sleep(1);
$tracer->stop($span);
}
}](https://image.slidesharecdn.com/doyouknowwhatyourdrupalisdoingobserveitdrupalconprague-220921065308-fe828d5b/85/Do-you-know-what-your-Drupal-is-doing-Observe-it-DrupalCon-Prague-2022-54-320.jpg)

![parameters:
monolog.channel_handlers:
default:
handlers:
- name: 'rotating_file'
formatter: 'json'
monolog.processors: [
'message_placeholder', 'current_user',
'request_uri', 'ip', 'referer',
'filter_backtrace', 'introspection', 'tracer'
]](https://image.slidesharecdn.com/doyouknowwhatyourdrupalisdoingobserveitdrupalconprague-220921065308-fe828d5b/85/Do-you-know-what-your-Drupal-is-doing-Observe-it-DrupalCon-Prague-2022-60-320.jpg)


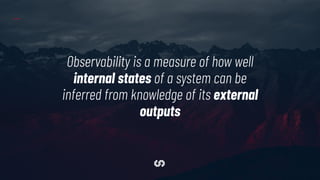
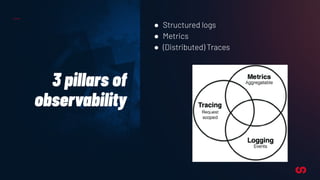
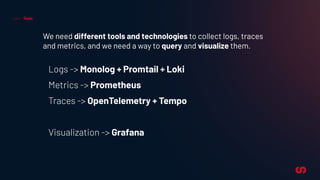
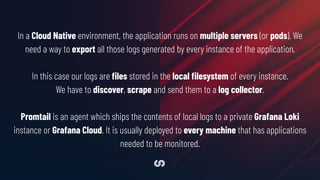
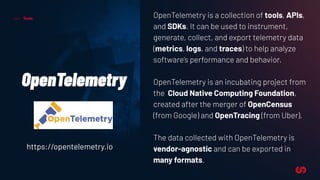
This document discusses observability tools for distributed systems like Drupal websites. It recommends using Monolog for structured logging, the Prometheus monitoring system for metrics collection, and OpenTelemetry with Tempo for distributed tracing. The Observability suite module can integrate all three for Drupal. Monolog logs are scraped by Promtail and sent to Loki. Metrics are exposed via Prometheus and scraped. OpenTelemetry instruments code and sends traces to Tempo. This provides insights across logs, metrics and traces for observability of distributed applications.