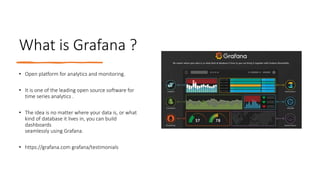
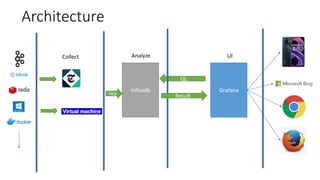
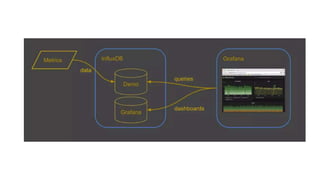
Grafana
Dashboard
Bhushan rane
What is Grafana ?
• Open platform for analytics and monitoring.
• It is one of the leading open source software for
time series analytics .
• The idea is no matter where your data is, or what
kind of database it lives in, you can build
dashboards
seamlessly using Grafana.
• https://grafana.com grafana/testimonials
Scope of Grafana ?
• Grafana has been the most utilized tool in the
market in various domains
• Grafana provided many visualization plugins.
• We can add our own customized plugin.
Why Grafana??
Advanced visualization and rich metrics dashboard
Reporting and monitoring server.
Alert Notification feature
Scope of Grafana ?
• Grafana has been the most utilized tool
in the market in various domains.
• Grafana provided many visualization
plugins.
• We can add our own customized
plugin.
Architecture
Collect
Influxdb
UI
http
Grafana
QL
Result
Analyze
Influxdb
• InfluxDB is an open-source time series database
(TSDB)
• Self contained binary
• No, External dependency
• Support for cluster
• Provide HTTP Native support by doing read/write,
manage data via http
• Security
• SQL style quries
Ports
8083 - UI
8086 -
API - Send and query data
- Cluster management raft
8090
8099
- Cluster management protobuf
What is Time-
Series Data
• A time-series is a sequence of data
points, consisting of successive
measurement made over a time
interval.
• Major type: Regular and Irregular
• They are used in statistics,
mathematical finance, pattern
recognition, IoT..
Down-sampling
and Data Retention
• Working with much data over a long
period of time can create storage
concerns.
• Solution : Down sampling or expire
• InfluxDB offers two mechanisms for
dealing with this issue: Continuous
Quires and Retention Policies
Other interesting feature:
Clustering
Grafana.pptx

Grafana.pptx

  • 1.
  • 2.
    What is Grafana? • Open platform for analytics and monitoring. • It is one of the leading open source software for time series analytics . • The idea is no matter where your data is, or what kind of database it lives in, you can build dashboards seamlessly using Grafana. • https://grafana.com grafana/testimonials
  • 3.
    Scope of Grafana? • Grafana has been the most utilized tool in the market in various domains • Grafana provided many visualization plugins. • We can add our own customized plugin. Why Grafana?? Advanced visualization and rich metrics dashboard Reporting and monitoring server. Alert Notification feature
  • 4.
    Scope of Grafana? • Grafana has been the most utilized tool in the market in various domains. • Grafana provided many visualization plugins. • We can add our own customized plugin.
  • 5.
  • 7.
    Influxdb • InfluxDB isan open-source time series database (TSDB) • Self contained binary • No, External dependency • Support for cluster • Provide HTTP Native support by doing read/write, manage data via http • Security • SQL style quries Ports 8083 - UI 8086 - API - Send and query data - Cluster management raft 8090 8099 - Cluster management protobuf
  • 8.
    What is Time- SeriesData • A time-series is a sequence of data points, consisting of successive measurement made over a time interval. • Major type: Regular and Irregular • They are used in statistics, mathematical finance, pattern recognition, IoT..
  • 9.
    Down-sampling and Data Retention •Working with much data over a long period of time can create storage concerns. • Solution : Down sampling or expire • InfluxDB offers two mechanisms for dealing with this issue: Continuous Quires and Retention Policies Other interesting feature: Clustering