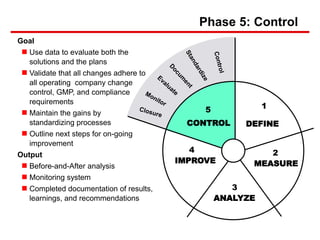
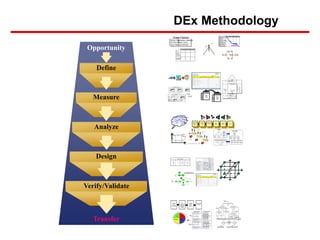
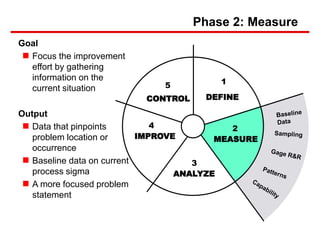
Six Sigma is a data-driven approach to process improvement that aims to reduce defects. It uses statistical methods and the DMAIC framework (Define, Measure, Analyze, Improve, Control) to identify and address root causes of defects. The document provides an overview of Six Sigma, including its goals of reducing costs and improving customer experience. It also describes the five steps of DMAIC and some of the tools used in each step, such as process mapping in Define and data collection/analysis in Measure and Analyze to identify problems and root causes.


![Design of Experiment
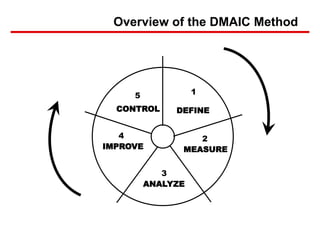
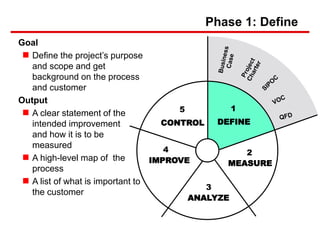
AnalyzeMeasure Improve ControlDefine
Hi
Lo0.00000
D
New
Cur
d = 0.00000
Maximum
Burst Va
y = 94.6429
2.0
3.0
55.0
90.0
245.0
260.0
Pressure TimeTemp
[245.0] [75.0] [3.0]](https://image.slidesharecdn.com/dmaic-150818162610-lva1-app6891/85/Dmaic-24-320.jpg)