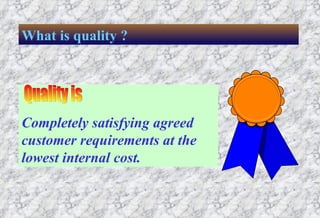
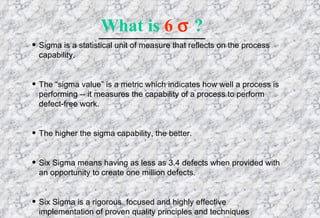
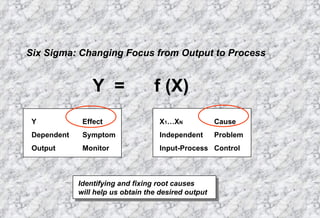
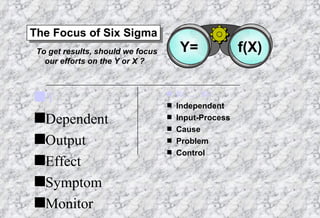
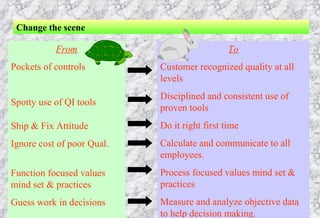
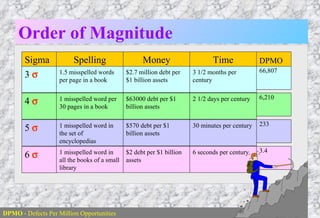
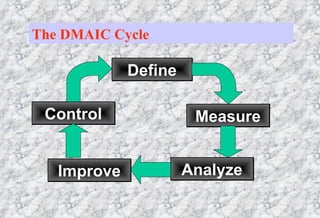
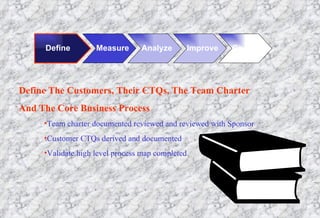
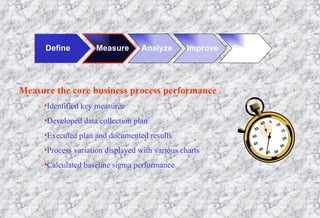
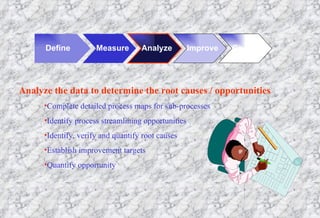
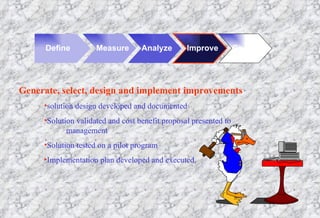
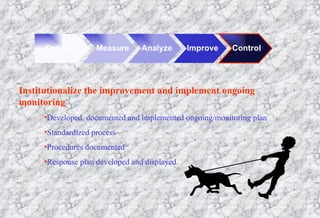
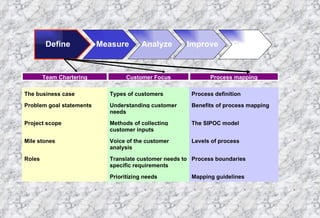
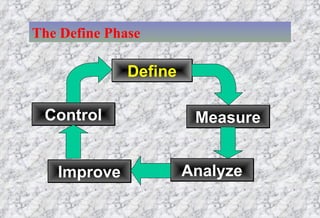
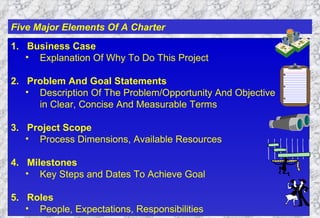
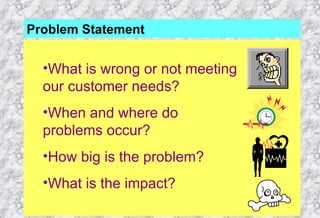
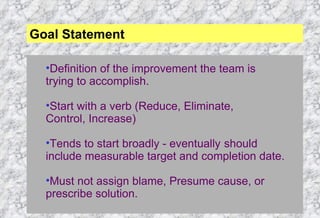
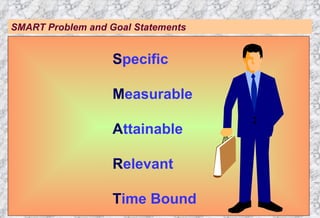
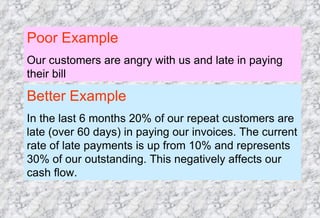
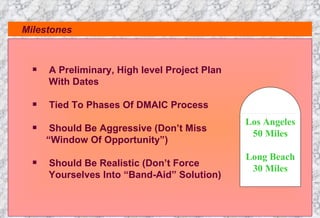
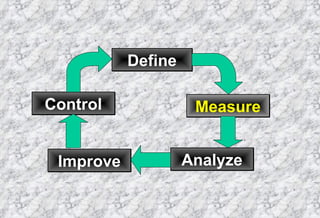
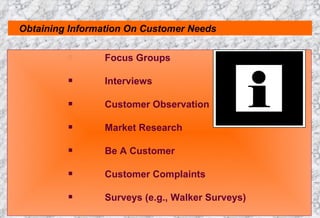
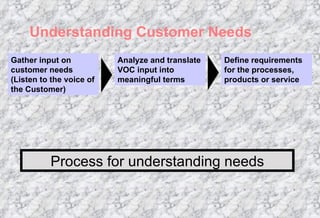
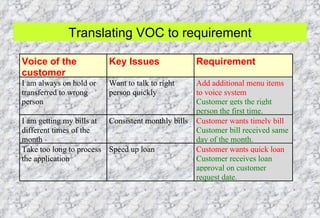
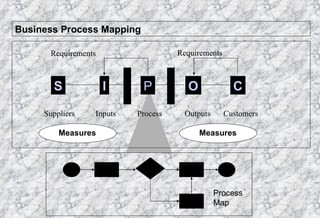
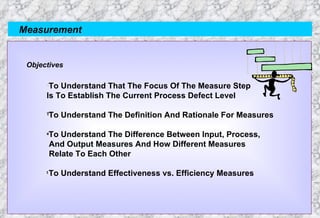
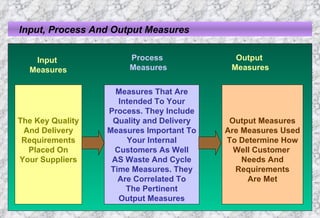
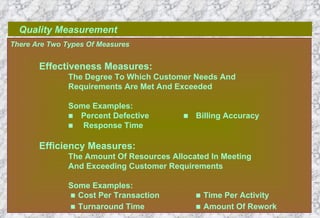
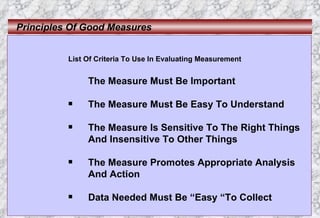
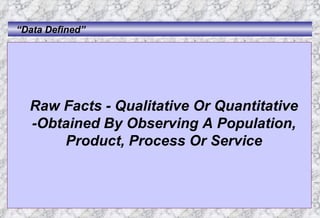
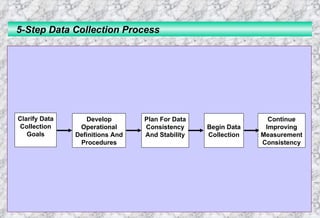
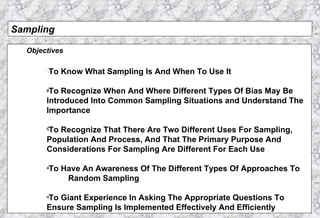
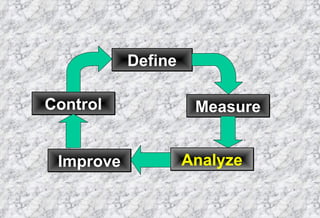
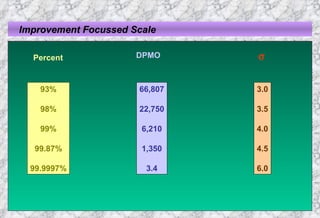
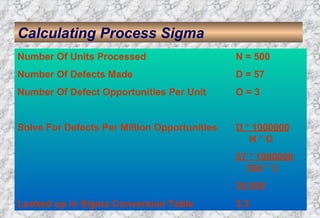
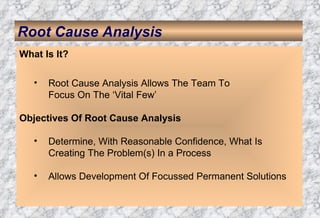
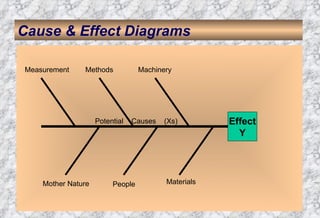
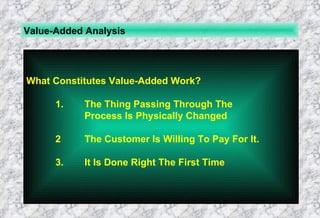
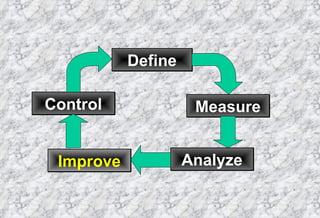
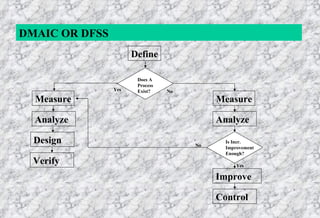
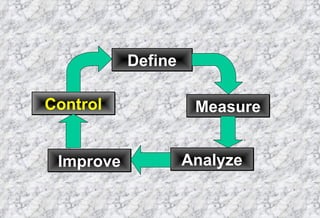
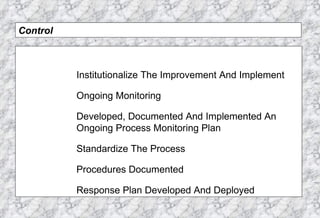
Six Sigma Awareness Programme
Contents What is Quality Why Six Sigma What is Six Sigma Variation, and Six Sigma basics The DMAIC cycle
Completely satisfying agreed customer requirements at the lowest internal cost. What is quality ? Quality is
Customer Focus Meeting customer requirements Achieve complete customer satisfaction Measure level of achievement Customer is the ultimate judge Customer Centric Quality
View quality externally Customer Perspective Meet all customer commitments Continuous improvement Systematic Scientific Fact based Attitude & Discipline Quality Culture
ISO 9000 Total Quality Management Robust Designs CMM  Six Sigma Popular Quality Initiatives
What does our customer want from us? On Time Delivery Quality Reliability  Competitive Product Six sigma - the most effective tool to drive customer  benefits
Why  Six Sigma ?
Why Pursue Six Sigma? Proven Motorola (1987) Texas Instruments (1988) Asea Brown Boveri (1993) Allied Signal (1993) GE Comprehensive Philosophy Tools Business Metrics Flexible Finance / Information Management Manufacturing / Design Sales / Service Consistent Six Sigma Is A Journey ……. Not A Destination
What is  Six Sigma ?
Sigma is a statistical unit of measure that reflects on the process capability. The “sigma value” is a metric which indicates how well a process is performing -- it measures the capability of a process to perform defect-free work. The higher the sigma capability, the better. Six Sigma means having as less as 3.4 defects when provided with an opportunity to create one million defects. Six Sigma is a rigorous, focused and highly effective implementation of proven quality principles and techniques What is  6     ?
Six Sigma: Changing Focus from Output to Process Y  =  f (X) Y Effect Dependent Symptom Output Monitor X 1 …X N Cause Independent Problem Input-Process Control Identifying   and fixing root causes  will help us obtain the desired output
Y Dependent Output Effect Symptom Monitor X 1  . . . X N Independent Input-Process Cause Problem Control f(X) Y= To get results, should we focus our efforts on the Y or X ? The Focus of Six Sigma
From Pockets of controls Spotty use of QI tools Ship & Fix Attitude Ignore cost of poor Qual. Function focused values mind set & practices Guess work in decisions Change the scene To Customer recognized quality at all levels Disciplined and consistent use of proven tools Do it right first time Calculate and communicate to all employees. Process focused values mind set & practices Measure and analyze objective data to help decision making.
Eighty-Five percent of the reasons for failure to meet customer expectations are related to deficiencies in  systems and processes  … Rather than the  Employee. The role of Management is to change the  process  rather than  badgering individuals  to do better. So says Deming To
Target X X X X X X X X X X X X X X X X X X X X X X X X X X X X X X X X X X X X X X X X X X X Every Human Activity Has Variability... Six Sigma Concept Understanding Variability  & Customer Specification  Is The Essence of Six Sigma Customer Specification defects
6      Key Terms Concept Critical to Quality characteristics (CTQs) Unit Defect Defect Opportunities Definition Customer Performance req. of a product or service. The Item Produced Or Processed Any event that does not meet the specification of CTQ Any event that can be measured that provides a chance of not meeting a customer requirement.
DPMO  - Defects Per Million Opportunities Order of Magnitude Sigma 3   Spelling 1.5 misspelled words per page in a book Money $2.7 million debt per $1 billion assets Time 3 1/2 months per century DPMO 66,807 4   1 misspelled word per 30 pages in a book $63000 debt per $1 billion assets 2 1/2 days per century 6,210 5   1 misspelled word in the set of encyclopedias $570 debt per $1 billion assets 30 minutes per century 233 6   1 misspelled word in all the books of a small library $2 debt per $1 billion assets 6 seconds per century 3.4
6   Metric BenchMark Vision Philosophy Tool Method Goal Value Symbol
Leaders Team coaches Team leaders Team Members All Associates Champions Master Black Belt Black Belt Improvement Team Awareness Skills are differentiated for each audience Skill Levels
Design Design for six sigma Improvement DMAIC Management Process management Two Ways About it
Define Measure Analyze Improve Control The DMAIC Cycle
Define Measure Analyze Improve Control Define The Customers, Their CTQs, The Team Charter And The Core Business Process Team charter documented reviewed and reviewed with Sponsor Customer CTQs derived and documented Validate high level process map completed
Define Measure Analyze Improve Control Measure the core business process performance Identified key measures Developed data collection plan Executed plan and documented results Process variation displayed with various charts Calculated baseline sigma performance
Define Measure Analyze Improve Control Analyze the data to determine the root causes / opportunities Complete detailed process maps for sub-processes Identify process streamlining opportunities Identify, verify and quantify root causes  Establish improvement targets Quantify opportunity
Define Measure Analyze Improve Control Generate, select, design and implement improvements  solution design developed and documented Solution validated and cost benefit proposal presented to  management Solution tested on a pilot program  Implementation plan developed and executed.
Define Measure Analyze Improve Control Institutionalize the improvement and implement ongoing monitoring  Developed, documented and implemented ongoing/monitoring plan Standardized process Procedures documented  Response plan developed and displayed.
Define Measure Analyze Improve Control
Define Measure Analyze Improve Control The Define Phase
What is A Charter? A Charter is A Document That Provides Purpose And Goals For An  Improvement Team
Five Major Elements Of A Charter 1. Business Case Explanation Of Why To Do This Project 2. Problem And Goal Statements Description Of The Problem/Opportunity And Objective in Clear, Concise And Measurable Terms 3. Project Scope Process Dimensions, Available Resources 4. Milestones Key Steps and Dates To Achieve Goal 5. Roles People, Expectations, Responsibilities
Problem And Goal Statements The Purpose Of The Problem Statement Is To Describe What Is Wrong The Goal Statement Then Defines The Team’s Improvement Objective
What is wrong or not meeting our customer needs? When and where do problems occur? How big is the problem? What is the impact? Problem Statement
Definition of the improvement the team is trying to accomplish. Start with a verb (Reduce, Eliminate, Control, Increase) Tends to start broadly - eventually  should include measurable target and completion date. Must not assign blame, Presume cause, or prescribe solution. Goal Statement
SMART Problem and Goal Statements S pecific M easurable A ttainable R elevant T ime   Bound
Poor Example Our customers are angry with us and late in paying their bill Better Example In the last 6 months 20% of our repeat customers are late (over 60 days) in paying our invoices. The current rate of late payments is up from 10% and represents 30% of our outstanding. This negatively affects our cash flow.
Project Scope What Process Will the Team Focus On? What Are The Boundaries Of the Process We Are To Improve?  Start Point? Stop Point? What Resources Are Available To The Team? What (If Anything) Is Out Of Bounds For The Team? What (If Any) Constraints Must The Team Work Under? What Is The Time Commitment Expected Of Team Members?  What Will Happen To Our “Regular Jobs”  While We are Doing The Project?
Roles How Do You Want The Champion To Work With The Team? Is The Team’s Role To Implement Or Recommend? When Must The Team Go To The Champion For Approval? What Authority Does The Team Have To Act Independently? What And How Do You Want To Inform The Champion About  The Team’s Progress? What Is The Role Of The Team Leader(Black Belt) And The  Team Coach (Master Black Belt)? Are The Right Members On The Team? Functionally?  Hierarchically?
Milestones A Preliminary, High level Project Plan With Dates  Tied To Phases Of DMAIC Process Should Be Aggressive (Don’t Miss  “ Window Of Opportunity”) Should Be Realistic (Don’t Force  Yourselves Into “Band-Aid” Solution) Los Angeles 50 Miles Long Beach 30 Miles
Define Measure Analyze Improve Control
Obtaining Information On Customer Needs Focus Groups Interviews Customer Observation Market Research Be A Customer Customer Complaints Surveys (e.g., Walker Surveys)
Voice Of The Customer Sample Comments/Data “ I’m Tired Of Having To Write A Check For This Loan Every Two Weeks” “ The Survey Shows 47% Of Customers Rate Our Response Time As  ‘ Fair’ Or ‘Poor’ “ Why Don’t You Guys Get Your Act Together?!” “ The Phone Must Have Rung Six Times Before I Got An Answer” “ I’m Not That Satisfied With Your Service” How Do We Take Action On VOC Input?
Understanding Customer Needs Gather input on customer needs (Listen to the voice of the Customer) Analyze and translate VOC input into meaningful terms Define requirements for the processes, products or service Process for understanding needs
Translating VOC to requirement
Definition Of A Process A Process Is A Collection Of Activities That Takes One Or More Kinds Of  Input  And Creates  Output  That Is Of Value  To The  Customer
Process Mapping Objectives Learn The Definition Of Process Mapping Understand Business Processing Mapping And Its Application To Completely Satisfying Customer  Requirements Learn The Key Process Elements Learn The Importance Of Process Boundaries And Process Owners Understand The Benefits Of Process Mapping Understand The Steps Of Process Mapping
Business Process Mapping Requirements Requirements S I P O C Suppliers Inputs Process Outputs Customers Measures Measures Process Map
Measurement Objectives To Understand That The Focus Of The Measure Step  Is To Establish The Current Process Defect Level To Understand The Definition And Rationale For Measures To Understand The Difference Between Input, Process, And Output Measures And How Different Measures Relate To Each Other To Understand Effectiveness vs. Efficiency Measures
Input, Process And Output Measures Input  Measures Process  Measures Output  Measures The Key Quality And Delivery Requirements Placed On Your Suppliers Measures That Are Intended To Your Process. They Include Quality and Delivery Measures Important To Your Internal Customers As Well AS Waste And Cycle Time Measures. They Are Correlated To The Pertinent Output Measures Output Measures Are Measures Used To Determine How Well Customer  Needs And Requirements Are Met
Quality Measurement There Are Two Types Of Measures Effectiveness Measures: The Degree To Which Customer Needs And  Requirements Are Met And Exceeded Some Examples:  Percent Defective        Billing Accuracy    Response Time Efficiency Measures: The Amount Of Resources Allocated In Meeting And Exceeding Customer Requirements Some Examples:      Cost Per Transaction     Time Per Activity      Turnaround Time     Amount Of Rework
Principles Of Good Measures List Of Criteria To Use In Evaluating Measurement The Measure Must Be Important The Measure Must Be Easy To Understand The Measure Is Sensitive To The Right Things And Insensitive To Other Things The Measure Promotes Appropriate Analysis And Action Data Needed Must Be “Easy “To Collect
“ Data Defined” Raw Facts - Qualitative Or Quantitative -Obtained By Observing A Population, Product, Process Or Service
5-Step Data Collection Process Clarify Data Collection Goals Develop Operational Definitions And Procedures Plan For Data Consistency And Stability Begin Data Collection Continue Improving Measurement Consistency
Sampling Objectives To Know What Sampling Is And When To Use It To Recognize When And Where Different Types Of Bias May Be Introduced Into Common Sampling Situations and Understand The  Importance To Recognize That There Are Two Different Uses For Sampling, Population And Process, And That The Primary Purpose And  Considerations For Sampling Are Different For Each Use To Have An Awareness Of The Different Types Of Approaches To  Random Sampling To Giant Experience In Asking The Appropriate Questions To  Ensure Sampling Is Implemented Effectively And Efficiently
Define Measure Analyze Improve Control
Variation Objectives Understand That Variation In The Data Represents The Voice  Of The Process Know The Two Types Of Variation - Common Cause And  Special Cause And The Implication Of The Different Causes Use Appropriate Tools To Study Variation In Discrete And  Continuous Situations Know How To Use And Interpret Run Charts And Control  Charts And Take Appropriate Action Based On The Charts
5 Ms & 1 P P R O C E S S Machines Materials Methods Measurement Mother Nature People
Types Of Data Anything That Results From Being Measured On A  Continuum Or Scale Example:  Continuous measure (Time To process) Anything That Can Be Categorized Or Designated As Either/Or Examples:  Male/Female  Accept/Reject  Off/On  Yes/No  Defect/No Defect  Democrat/Republican  Day Of Week (M/T/W/Th/F)   Variable Or Continuous Attribute Or Discrete
Two Types of Variation
-3s -2s -1s X 1s 2s 3s Normal Curve and Sigma 0.13% 2.14% 13.60% 34.13% 34.13% 13.60% 2.14% 0.13% 68.26% 95.46% 99.73% 1 Sigma 2 Sigma 3 Sigma 6 Sigma implies +  6 not  +  3
Improvement Focussed Scale Percent DPMO  93% 98% 99% 99.87% 99.9997% 66,807 22,750 6,210 1,350 3.4 3.0 3.5 4.0 4.5 6.0
Calculating Process Sigma Number Of Units Processed N = 500 Number Of Defects Made D = 57 Number Of Defect Opportunities Per Unit O = 3 Solve For Defects Per Million Opportunities D * 1000000   N * O 57 * 1000000   500 * 3 38,000 Looked up in Sigma Conversion Table 3.3
Tools of Analysis - Histograms # Of Occurances # Of Days
Tools of Analysis - Pareto Chart # Of Occurances # Of Days • • • • • •
Tools of Analysis - Run Charts Voltage Hour of Day • • • • • • • • • • • • • • • • • •
Root Cause Analysis What Is It? Root Cause Analysis Allows The Team To  Focus On The ‘Vital Few’ Objectives Of Root Cause Analysis Determine, With Reasonable Confidence, What Is  Creating The Problem(s) In a Process Allows Development Of Focussed Permanent Solutions
Cause & Effect Diagrams Effect Y Measurement Methods Machinery Mother Nature People Materials Potential  Causes  (Xs)
Value-Added Analysis What Constitutes Value-Added Work? 1. The Thing Passing Through The Process Is Physically Changed 2 The Customer Is Willing To Pay For It. 3. It Is Done Right The First Time
Define Measure Analyze Improve Control
Road Map: Improve   Generate Solutions Select Solutions Plan Implementation Generate Ideas Assumption Busting Synthesize Solutions Narrow List of Solutions Solution Criteria Validated Solution Piloting Project Planning Change Management Potential Problem  Analysis
Improvement Targets  Good Targets Include A Desired Performance Level And Point In Time Frame For Its Achievement All Targets Are Moving, What Is Good Enough  Next Year Probably Will Not Be Good Enough  The Following Year
DMAIC OR DFSS   Define Improve Verify Design Analyze Measure Control Measure Analyze Does A Process Exist? Is Incr. Improvement Enough? Yes No Yes No
Scamper  S = Substitute C = Combine A = Adapt M = Modify P = Put To Other Use E = Eliminate R = Rearrange
Define Measure Analyze Improve Control
Control  Institutionalize The Improvement And Implement Ongoing Monitoring Developed, Documented And Implemented An Ongoing Process Monitoring Plan Standardize The Process Procedures Documented Response Plan Developed And Deployed
T h e  W a y  W e  W o r k
Thanks for your time

Six sigma awareness

  • 1.
  • 2.
    Contents What isQuality Why Six Sigma What is Six Sigma Variation, and Six Sigma basics The DMAIC cycle
  • 3.
    Completely satisfying agreedcustomer requirements at the lowest internal cost. What is quality ? Quality is
  • 4.
    Customer Focus Meetingcustomer requirements Achieve complete customer satisfaction Measure level of achievement Customer is the ultimate judge Customer Centric Quality
  • 5.
    View quality externallyCustomer Perspective Meet all customer commitments Continuous improvement Systematic Scientific Fact based Attitude & Discipline Quality Culture
  • 6.
    ISO 9000 TotalQuality Management Robust Designs CMM Six Sigma Popular Quality Initiatives
  • 7.
    What does ourcustomer want from us? On Time Delivery Quality Reliability Competitive Product Six sigma - the most effective tool to drive customer benefits
  • 8.
    Why SixSigma ?
  • 9.
    Why Pursue SixSigma? Proven Motorola (1987) Texas Instruments (1988) Asea Brown Boveri (1993) Allied Signal (1993) GE Comprehensive Philosophy Tools Business Metrics Flexible Finance / Information Management Manufacturing / Design Sales / Service Consistent Six Sigma Is A Journey ……. Not A Destination
  • 10.
    What is Six Sigma ?
  • 11.
    Sigma is astatistical unit of measure that reflects on the process capability. The “sigma value” is a metric which indicates how well a process is performing -- it measures the capability of a process to perform defect-free work. The higher the sigma capability, the better. Six Sigma means having as less as 3.4 defects when provided with an opportunity to create one million defects. Six Sigma is a rigorous, focused and highly effective implementation of proven quality principles and techniques What is 6  ?
  • 12.
    Six Sigma: ChangingFocus from Output to Process Y = f (X) Y Effect Dependent Symptom Output Monitor X 1 …X N Cause Independent Problem Input-Process Control Identifying and fixing root causes will help us obtain the desired output
  • 13.
    Y Dependent OutputEffect Symptom Monitor X 1 . . . X N Independent Input-Process Cause Problem Control f(X) Y= To get results, should we focus our efforts on the Y or X ? The Focus of Six Sigma
  • 14.
    From Pockets ofcontrols Spotty use of QI tools Ship & Fix Attitude Ignore cost of poor Qual. Function focused values mind set & practices Guess work in decisions Change the scene To Customer recognized quality at all levels Disciplined and consistent use of proven tools Do it right first time Calculate and communicate to all employees. Process focused values mind set & practices Measure and analyze objective data to help decision making.
  • 15.
    Eighty-Five percent ofthe reasons for failure to meet customer expectations are related to deficiencies in systems and processes … Rather than the Employee. The role of Management is to change the process rather than badgering individuals to do better. So says Deming To
  • 16.
    Target X XX X X X X X X X X X X X X X X X X X X X X X X X X X X X X X X X X X X X X X X X X Every Human Activity Has Variability... Six Sigma Concept Understanding Variability & Customer Specification Is The Essence of Six Sigma Customer Specification defects
  • 17.
    6  Key Terms Concept Critical to Quality characteristics (CTQs) Unit Defect Defect Opportunities Definition Customer Performance req. of a product or service. The Item Produced Or Processed Any event that does not meet the specification of CTQ Any event that can be measured that provides a chance of not meeting a customer requirement.
  • 18.
    DPMO -Defects Per Million Opportunities Order of Magnitude Sigma 3  Spelling 1.5 misspelled words per page in a book Money $2.7 million debt per $1 billion assets Time 3 1/2 months per century DPMO 66,807 4  1 misspelled word per 30 pages in a book $63000 debt per $1 billion assets 2 1/2 days per century 6,210 5  1 misspelled word in the set of encyclopedias $570 debt per $1 billion assets 30 minutes per century 233 6  1 misspelled word in all the books of a small library $2 debt per $1 billion assets 6 seconds per century 3.4
  • 19.
    6 Metric BenchMark Vision Philosophy Tool Method Goal Value Symbol
  • 20.
    Leaders Team coachesTeam leaders Team Members All Associates Champions Master Black Belt Black Belt Improvement Team Awareness Skills are differentiated for each audience Skill Levels
  • 21.
    Design Design forsix sigma Improvement DMAIC Management Process management Two Ways About it
  • 22.
    Define Measure AnalyzeImprove Control The DMAIC Cycle
  • 23.
    Define Measure AnalyzeImprove Control Define The Customers, Their CTQs, The Team Charter And The Core Business Process Team charter documented reviewed and reviewed with Sponsor Customer CTQs derived and documented Validate high level process map completed
  • 24.
    Define Measure AnalyzeImprove Control Measure the core business process performance Identified key measures Developed data collection plan Executed plan and documented results Process variation displayed with various charts Calculated baseline sigma performance
  • 25.
    Define Measure AnalyzeImprove Control Analyze the data to determine the root causes / opportunities Complete detailed process maps for sub-processes Identify process streamlining opportunities Identify, verify and quantify root causes Establish improvement targets Quantify opportunity
  • 26.
    Define Measure AnalyzeImprove Control Generate, select, design and implement improvements solution design developed and documented Solution validated and cost benefit proposal presented to management Solution tested on a pilot program Implementation plan developed and executed.
  • 27.
    Define Measure AnalyzeImprove Control Institutionalize the improvement and implement ongoing monitoring Developed, documented and implemented ongoing/monitoring plan Standardized process Procedures documented Response plan developed and displayed.
  • 28.
    Define Measure AnalyzeImprove Control
  • 29.
    Define Measure AnalyzeImprove Control The Define Phase
  • 30.
    What is ACharter? A Charter is A Document That Provides Purpose And Goals For An Improvement Team
  • 31.
    Five Major ElementsOf A Charter 1. Business Case Explanation Of Why To Do This Project 2. Problem And Goal Statements Description Of The Problem/Opportunity And Objective in Clear, Concise And Measurable Terms 3. Project Scope Process Dimensions, Available Resources 4. Milestones Key Steps and Dates To Achieve Goal 5. Roles People, Expectations, Responsibilities
  • 32.
    Problem And GoalStatements The Purpose Of The Problem Statement Is To Describe What Is Wrong The Goal Statement Then Defines The Team’s Improvement Objective
  • 33.
    What is wrongor not meeting our customer needs? When and where do problems occur? How big is the problem? What is the impact? Problem Statement
  • 34.
    Definition of theimprovement the team is trying to accomplish. Start with a verb (Reduce, Eliminate, Control, Increase) Tends to start broadly - eventually should include measurable target and completion date. Must not assign blame, Presume cause, or prescribe solution. Goal Statement
  • 35.
    SMART Problem andGoal Statements S pecific M easurable A ttainable R elevant T ime Bound
  • 36.
    Poor Example Ourcustomers are angry with us and late in paying their bill Better Example In the last 6 months 20% of our repeat customers are late (over 60 days) in paying our invoices. The current rate of late payments is up from 10% and represents 30% of our outstanding. This negatively affects our cash flow.
  • 37.
    Project Scope WhatProcess Will the Team Focus On? What Are The Boundaries Of the Process We Are To Improve? Start Point? Stop Point? What Resources Are Available To The Team? What (If Anything) Is Out Of Bounds For The Team? What (If Any) Constraints Must The Team Work Under? What Is The Time Commitment Expected Of Team Members? What Will Happen To Our “Regular Jobs” While We are Doing The Project?
  • 38.
    Roles How DoYou Want The Champion To Work With The Team? Is The Team’s Role To Implement Or Recommend? When Must The Team Go To The Champion For Approval? What Authority Does The Team Have To Act Independently? What And How Do You Want To Inform The Champion About The Team’s Progress? What Is The Role Of The Team Leader(Black Belt) And The Team Coach (Master Black Belt)? Are The Right Members On The Team? Functionally? Hierarchically?
  • 39.
    Milestones A Preliminary,High level Project Plan With Dates Tied To Phases Of DMAIC Process Should Be Aggressive (Don’t Miss “ Window Of Opportunity”) Should Be Realistic (Don’t Force Yourselves Into “Band-Aid” Solution) Los Angeles 50 Miles Long Beach 30 Miles
  • 40.
    Define Measure AnalyzeImprove Control
  • 41.
    Obtaining Information OnCustomer Needs Focus Groups Interviews Customer Observation Market Research Be A Customer Customer Complaints Surveys (e.g., Walker Surveys)
  • 42.
    Voice Of TheCustomer Sample Comments/Data “ I’m Tired Of Having To Write A Check For This Loan Every Two Weeks” “ The Survey Shows 47% Of Customers Rate Our Response Time As ‘ Fair’ Or ‘Poor’ “ Why Don’t You Guys Get Your Act Together?!” “ The Phone Must Have Rung Six Times Before I Got An Answer” “ I’m Not That Satisfied With Your Service” How Do We Take Action On VOC Input?
  • 43.
    Understanding Customer NeedsGather input on customer needs (Listen to the voice of the Customer) Analyze and translate VOC input into meaningful terms Define requirements for the processes, products or service Process for understanding needs
  • 44.
    Translating VOC torequirement
  • 45.
    Definition Of AProcess A Process Is A Collection Of Activities That Takes One Or More Kinds Of Input And Creates Output That Is Of Value To The Customer
  • 46.
    Process Mapping ObjectivesLearn The Definition Of Process Mapping Understand Business Processing Mapping And Its Application To Completely Satisfying Customer Requirements Learn The Key Process Elements Learn The Importance Of Process Boundaries And Process Owners Understand The Benefits Of Process Mapping Understand The Steps Of Process Mapping
  • 47.
    Business Process MappingRequirements Requirements S I P O C Suppliers Inputs Process Outputs Customers Measures Measures Process Map
  • 48.
    Measurement Objectives ToUnderstand That The Focus Of The Measure Step Is To Establish The Current Process Defect Level To Understand The Definition And Rationale For Measures To Understand The Difference Between Input, Process, And Output Measures And How Different Measures Relate To Each Other To Understand Effectiveness vs. Efficiency Measures
  • 49.
    Input, Process AndOutput Measures Input Measures Process Measures Output Measures The Key Quality And Delivery Requirements Placed On Your Suppliers Measures That Are Intended To Your Process. They Include Quality and Delivery Measures Important To Your Internal Customers As Well AS Waste And Cycle Time Measures. They Are Correlated To The Pertinent Output Measures Output Measures Are Measures Used To Determine How Well Customer Needs And Requirements Are Met
  • 50.
    Quality Measurement ThereAre Two Types Of Measures Effectiveness Measures: The Degree To Which Customer Needs And Requirements Are Met And Exceeded Some Examples:  Percent Defective  Billing Accuracy  Response Time Efficiency Measures: The Amount Of Resources Allocated In Meeting And Exceeding Customer Requirements Some Examples:  Cost Per Transaction  Time Per Activity  Turnaround Time  Amount Of Rework
  • 51.
    Principles Of GoodMeasures List Of Criteria To Use In Evaluating Measurement The Measure Must Be Important The Measure Must Be Easy To Understand The Measure Is Sensitive To The Right Things And Insensitive To Other Things The Measure Promotes Appropriate Analysis And Action Data Needed Must Be “Easy “To Collect
  • 52.
    “ Data Defined”Raw Facts - Qualitative Or Quantitative -Obtained By Observing A Population, Product, Process Or Service
  • 53.
    5-Step Data CollectionProcess Clarify Data Collection Goals Develop Operational Definitions And Procedures Plan For Data Consistency And Stability Begin Data Collection Continue Improving Measurement Consistency
  • 54.
    Sampling Objectives ToKnow What Sampling Is And When To Use It To Recognize When And Where Different Types Of Bias May Be Introduced Into Common Sampling Situations and Understand The Importance To Recognize That There Are Two Different Uses For Sampling, Population And Process, And That The Primary Purpose And Considerations For Sampling Are Different For Each Use To Have An Awareness Of The Different Types Of Approaches To Random Sampling To Giant Experience In Asking The Appropriate Questions To Ensure Sampling Is Implemented Effectively And Efficiently
  • 55.
    Define Measure AnalyzeImprove Control
  • 56.
    Variation Objectives UnderstandThat Variation In The Data Represents The Voice Of The Process Know The Two Types Of Variation - Common Cause And Special Cause And The Implication Of The Different Causes Use Appropriate Tools To Study Variation In Discrete And Continuous Situations Know How To Use And Interpret Run Charts And Control Charts And Take Appropriate Action Based On The Charts
  • 57.
    5 Ms &1 P P R O C E S S Machines Materials Methods Measurement Mother Nature People
  • 58.
    Types Of DataAnything That Results From Being Measured On A Continuum Or Scale Example:  Continuous measure (Time To process) Anything That Can Be Categorized Or Designated As Either/Or Examples:  Male/Female  Accept/Reject  Off/On  Yes/No  Defect/No Defect  Democrat/Republican  Day Of Week (M/T/W/Th/F) Variable Or Continuous Attribute Or Discrete
  • 59.
    Two Types ofVariation
  • 60.
    -3s -2s -1sX 1s 2s 3s Normal Curve and Sigma 0.13% 2.14% 13.60% 34.13% 34.13% 13.60% 2.14% 0.13% 68.26% 95.46% 99.73% 1 Sigma 2 Sigma 3 Sigma 6 Sigma implies + 6 not + 3
  • 61.
    Improvement Focussed ScalePercent DPMO  93% 98% 99% 99.87% 99.9997% 66,807 22,750 6,210 1,350 3.4 3.0 3.5 4.0 4.5 6.0
  • 62.
    Calculating Process SigmaNumber Of Units Processed N = 500 Number Of Defects Made D = 57 Number Of Defect Opportunities Per Unit O = 3 Solve For Defects Per Million Opportunities D * 1000000 N * O 57 * 1000000 500 * 3 38,000 Looked up in Sigma Conversion Table 3.3
  • 63.
    Tools of Analysis- Histograms # Of Occurances # Of Days
  • 64.
    Tools of Analysis- Pareto Chart # Of Occurances # Of Days • • • • • •
  • 65.
    Tools of Analysis- Run Charts Voltage Hour of Day • • • • • • • • • • • • • • • • • •
  • 66.
    Tools of Analysis- Run Charts Voltage Hour of Day • • • • • • • • • • • • • • • • • •
  • 67.
    Root Cause AnalysisWhat Is It? Root Cause Analysis Allows The Team To Focus On The ‘Vital Few’ Objectives Of Root Cause Analysis Determine, With Reasonable Confidence, What Is Creating The Problem(s) In a Process Allows Development Of Focussed Permanent Solutions
  • 68.
    Cause & EffectDiagrams Effect Y Measurement Methods Machinery Mother Nature People Materials Potential Causes (Xs)
  • 69.
    Value-Added Analysis WhatConstitutes Value-Added Work? 1. The Thing Passing Through The Process Is Physically Changed 2 The Customer Is Willing To Pay For It. 3. It Is Done Right The First Time
  • 70.
    Define Measure AnalyzeImprove Control
  • 71.
    Road Map: Improve Generate Solutions Select Solutions Plan Implementation Generate Ideas Assumption Busting Synthesize Solutions Narrow List of Solutions Solution Criteria Validated Solution Piloting Project Planning Change Management Potential Problem Analysis
  • 72.
    Improvement Targets Good Targets Include A Desired Performance Level And Point In Time Frame For Its Achievement All Targets Are Moving, What Is Good Enough Next Year Probably Will Not Be Good Enough The Following Year
  • 73.
    DMAIC OR DFSS Define Improve Verify Design Analyze Measure Control Measure Analyze Does A Process Exist? Is Incr. Improvement Enough? Yes No Yes No
  • 74.
    Scamper S= Substitute C = Combine A = Adapt M = Modify P = Put To Other Use E = Eliminate R = Rearrange
  • 75.
    Define Measure AnalyzeImprove Control
  • 76.
    Control InstitutionalizeThe Improvement And Implement Ongoing Monitoring Developed, Documented And Implemented An Ongoing Process Monitoring Plan Standardize The Process Procedures Documented Response Plan Developed And Deployed
  • 77.
    T h e W a y W e W o r k
  • 78.