Downloaded 518 times


![Analyze
One-Sample T-Test
and Dot Plot (Optional)
Dotplot of Improve Data
(with Ho and 95% t-confidence interval for the mean)
[ ]
_
X
Ho
We Are 95% Confident The Improve
Mean Is Not Statistically Different
0 10 20 30 40 50
Improve Data
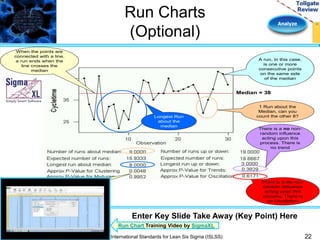
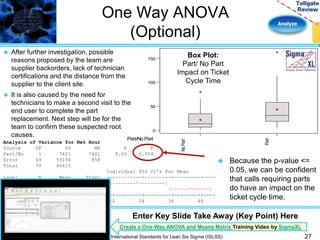
This Dot Plot graphically displays 95%
confidence intervals that the data will fall
between 23.45 and 32.75 for response
time (see the red brackets and red line). It
also indicates that the Mean (Red X) is at
28.1. The blue Ho marks the Target Mean.
One-Sample T: Improve Data
Test of mu = 30 vs mu not = 30
Variable N Mean StDev SE Mean
Improve Data 30 28.10 12.45 2.27
Variable 95.0% CI T P
Improve Data (23.45, 32.75) -0.84 0.410
The test statistic, T, for Ho: mean = 30 is calculated
as –0.84. The P-Value of this test, or the probability
of obtaining more extreme value of the test statistic
by chance if the null hypothesis was true, is 0.410
(> 0.05). This is called the attained significant level,
or P-Value. Therefore, Accept Ho, which means we
conclude that the Improve data set mean (28.1) is
NOT different than the Target mean (30).
Hypothesis Test:
Is the Improve data set mean
different from the Target Mean
of 30 minutes?
Enter Key Slide Take Away (Key Point) Here
Two-Sample T-Test Training Video by SigmaXL
International Standards for Lean Six Sigma (ISLSS) 25](https://image.slidesharecdn.com/analyzephase-leansixsigmatollgatetemplate-140925132647-phpapp02/85/Analyze-phase-lean-six-sigma-tollgate-template-25-320.jpg)
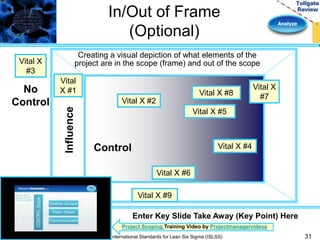


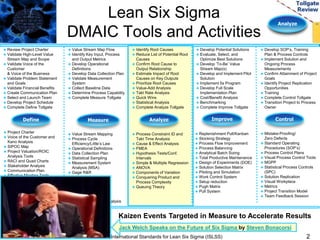
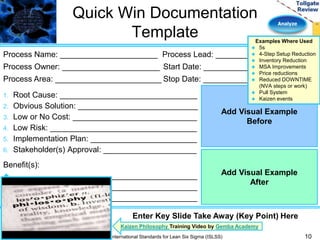
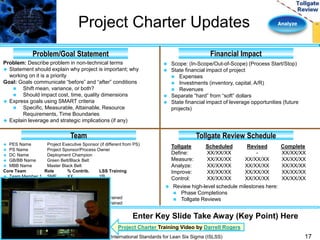
The document summarizes the Analyze phase of a Lean Six Sigma project. It lists the tools and activities used in Analyze such as value stream mapping, root cause analysis, hypothesis testing, and prioritizing sources of waste. Graphs and examples are provided to illustrate how some of the tools are applied. The next steps outlined are to identify root causes, confirm the relationship between causes and outputs, estimate the impact of causes, and prioritize the root causes to address in the Improve phase.


