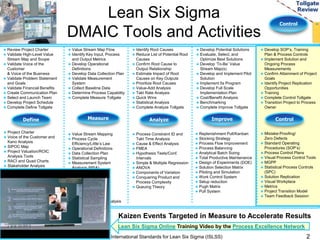
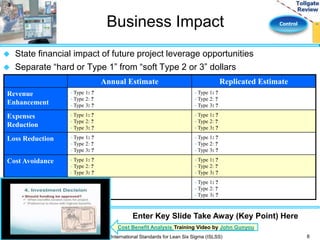
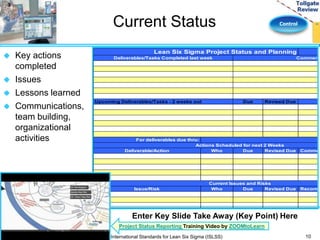
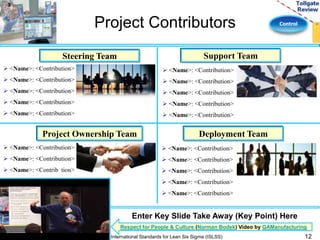
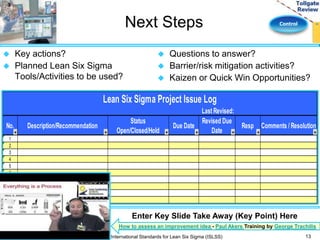
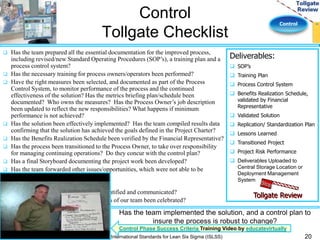
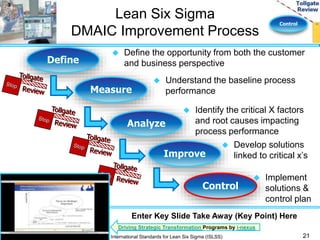
The document outlines the control phase tools and activities for a Lean Six Sigma project. It includes reviewing project documentation, validating goals and benefits, developing standard operating procedures and controls, implementing and monitoring the solution, confirming attainment of goals, identifying opportunities for replication, and transitioning the project to the process owner. Key metrics are monitored to ensure the process remains in control. Lessons learned are captured to improve future projects.
Learn about the DMAIC method that is used in Six Sigma. This Overview will walk you through Define, Measure, Analyze, Improve and Control in under 5 minutes. Learn more about the DMAIC method and other six sigma techniques on Lean Strategies International LLC's website: www.leanstrategiesinternational.com
Problem solving road map to guide anybody who must improve a process that is slow, defective, inflexible, unresponsive, costly and risky.
Do you have any like that in your organization?
Of special use for teams following Lean Six Sigma methods (green belt and black belt projects).
Follows DMAIC structure integrated with Lean thinking and tools.
ASSOCIATED KEYWORDS:
Shewhart, Deming, Ohno, Ishikawa, lean, toyota, tps, toyota kata, lean six sigma, project management, six sigma, green belt, black belt, champion, coach, master black belt, deliverables, road map, project management, project plan, DMAIC, LSS, Define, Measure, Analyze, Improve, Control, Sustain, project charter, business case, team, problem solving, milestone, tollgate, baseline, process map, SIPOC, gemba, 7 wastes, 8 wastes, gemba walk, waste walk, spaghetti chart, flow chart, RACI, swimlane, VSM, value stream map, quick wins, operational definition, gage r&r, basic quality tools, check sheet, run chart, histogram, data statification, first time yield, FTY, rolled throughput yield, RTY, COPQ, hidden factory, rework, SPC, Western Electric rules, pareto, prioritization, input, process, output, box plot, scatter plot, correlation, causation, system, 5 whys, cause effect, fishbone, FMEA, hypothesis testing, root causes, quick win, drive out fear, respect for worker, kaizen, 5S, poka yoke, brainstorm, TRIZ, roles, responsibilities, PDCA, PDSA, pilot, roll out, implementation, status, implementation plan, business process management, BPM, KPI, target, performance, response plan, control plan, SOP, inverted pyramid, organization, sustain, plan, budget, communication, training, change, management, adoption, business, capability, prosperity, value, realization, results, replicate, integrate
DMAIC is a methodology for improving existing processes. DMAIC stands for Define, Measure, Analyze, Improve, and Control.
https://goleansixsigma.com/lean-six-sigma-step-by-step/
Problem Statement:
Lower than expected billability, also described as Excessive Bench Capacity, results in chargeability variances and negatively impacts services margins by approximately $100,000,000 per year.
Goal Statement:
Improve billability from current 60% to 70% while maintaining planned fee adjustment. Corrective action plan will be prepared by June 200X, implemented by July 200X. Benefits will be evaluated 6 and 12 months following implementation.
Recorded webinar: http://bit.ly/1uVqMJC
Subscribe: http://www.ksmartin.com/subscribe
Purchase the book: http://www.bit.ly/VSM
These are slides from a webinar done with APICS Heartland on the topic of Value Stream Mapping.
This webinar covers:
• How to use value stream mapping as an organizational transformation & leadership alignment tool
• How to plan for a value stream mapping activity
• The mechanics of mapping, including key metrics
for office/service/knowledge work
• How to create an actionable Value Stream Transformation Plan
More Information:
https://flevy.com/browse/business-document/six-sigma--statistical-process-control-spc-604
DOCUMENT DESCRIPTION
The Six Sigma - Statistical Process Control (SPC) Training Module includes:
1. MS PowerPoint Presentation including 136 slides covering
- Introduction to Statistical Process Thinking,
- Basic Statistics,
- Introduction to Statistical Process Control,
- Statistical Process Control Charts,
- Sample Size & Frequency,
- Out-of-Control Action Plan, and
- Process Control Plan.
2. MS Excel Confidence Interval Analysis Calculator making it really easy to calculate confidence intervals (mean value, standard deviation, capability indices, proportion, count) and perform a Comparison of two statistics (mean values, standard deviations, proportions, counts).
"After you have downloaded the training material, you can change any part of the training material and remove all logos and references to Operational Excellence Consulting. You can share the material with your colleagues and clients, and re-use it as you need. The only restriction is that you cannot publicly re-distribute, sell, rent or license the material as though it is your own. Thank you."
Got a question about this presentation? Email us at support@flevy.com.
Recorded webinar: http://slidesha.re/1iJ2ZWu
Subscribe: http://ksmartin.com/subscribe
Purchase the book: http://bit.ly/VSMbk
This webinar presents case studies for several client engagements that involved value stream mapping. For each case, you'll learn:
• What the driver was for value stream improvement.
• What the planning process consisted of.
• The discoveries and challenges that surfaced—and the shifts that occurred—during the 3-day activity.
• Transformation results.
During the webinar, Karen also answers participant questions about facilitation, transformation plan ownership, team composition, going to the Gemba, and collecting data that's not easily measured.
[To download this self-assessment framework, visit:
https://www.oeconsulting.com.sg/training-presentations]
Assessing your Lean management implementation periodically is not just wise—it's essential. The Lean Management System Assessment (LMA) tool is grounded in the core principles of plan, do, check, act (PDCA), a fundamental aspect of Lean philosophy. It meticulously evaluates both process and behavior standards, defining five levels of maturity that can be applied across all levels of your organization.
This assessment isn't just a routine check—it's a strategic tool that clarifies your organizational goals and personal objectives. It provides a detailed snapshot of your current status relative to your standards and historical performance. Moreover, it's a compass that directs your attention to areas requiring improvement, ensuring your efforts are both focused and effective.
Adapted from the acclaimed work "Creating A Lean Culture" by David Mann, the Lean Assessment Framework stands out as a simpler, more practical alternative to the Shingo Model and the Baldrige Excellence Framework. It features eight comprehensive dimensions or categories, a user-friendly five-level maturity scale, and a straightforward 5-point scoring system that can be employed by individuals or teams.
The LMA tool provides an excellent resource for Lean or Operational Excellence Consultants who plan to use it as a holistic organizational diagnostic tool prior to recommending solutions to the client. It functions as a comprehensive organizational diagnostic tool, allowing consultants to gain a deep understanding of the client's operations before recommending tailored solutions. By utilizing the LMA, consultants can effectively identify areas for improvement, develop targeted strategies, and guide their clients towards achieving sustainable operational excellence.
In essence, the Lean Management Assessment isn't just a tool—it's a pathway to operational excellence. It offers a structured and insightful method to evaluate and enhance your Lean implementation, providing invaluable guidance for continuous improvement and sustainable progress.
BENEFITS OF ASSESSMENT:
1. The dimensions and questions themselves should help to clarify what you are working toward, for yourself and for the rest of your organization.
2. An assessment should tell you where you stand relative to your standards and relative to your earlier status.
3. The results of an assessment will help you identify where you need to focus efforts to improve.
CONTENTS
1. Overview of Lean Management Assessment
2. Scoring System
3. Assessment Criteria
4. Assessment Guidelines
Lean, Six Sigma, ToC using DMAIC project managementSimon Misiewicz
This presentation guides you through the DMAIC methodology that encompasses Lean, Six Sigma and ToC initiatives. There are five key stages of DMAIC. D = Design, where do you want to be? Create and communicate your vision, mission and objectives. M = Measure. What is to be measured and how? A = Analyse, what business process is to be analysed. Which process if changed would reap the biggest benefit? I = Improve, where are the improvements going to be made, what are the ideas and how will they be evaluated against your key objectives? C = Control, how are you going to control your process and people within it to ensure that they stick to the new way of doing things, what error proofing techniques can be built? What project management controls will you use? This presentation will guide you. Please contact me should you have any questions on simon@optimise-gb.com. Many thanks Simon Misiewicz
Lean, Six Sigma, ToC using DMAIC - Measure phase Simon Misiewicz
This presentation guides you through the DMAIC methodology that encompasses Lean, Six Sigma and ToC initiatives. The Measure phase guides you through the detailed process mapping of the SIPOC diagram to Swim Lanes, spaghetti diagrams that focus on time, cost and quality. The presentation guides you though the statistics element of data sampling and to understand the theory of constraints. The presentation also discusses the use of Pareto charts to identify the key issues within a process. – Optimise-GB (Creating Operational Efficiencies)
This is Six Sigma Project sample for manufacturing company. This is helpful for green belt & black belt level projects. for more information, visit www.niqcgroup.com or www.niqcsixsigmatraining.com
Lean Six Sigma is a methodology that combines the methods and concepts of Lean Manufacturing with those of Six Sigma. This presentation is a basic overview of the implementation of lean six sigma. Presentation by EMS Consulting Group, Inc. www.emsstrategies.com
3PLs are a virtually perfect competitive business model. With highly variable costs to revenue, it is challenging to make a 3PL company thrive. Here is some research we have done with Lean Transit to achieve remarkable progress towards making 3PLs more profitable.
Here is the Six sigma training material part 7, presented by Skillogic Knowledge Solutions. If you are looking for Lean + Six Sigma training in Bangalore / Bengaluru, Visit Skillogic and schedule you classroom training.
This is my 6 Sigma case study pertaining to software introduction –commonly termed Release Management. This example captures LTE Radio System updates as an iterative (N+1) process in the scenario whereby a Supplier’s SW is underperforming necessitating more robust and efficient Release Testing.
It is supplier agnostic and can be applied to any Platform & SW Release Management regime where SDLC is the primary methodology and where system & customer data points are measurable in the environments.
Process wind tunnel - A novel capability for data-driven business process imp...Sudhendu Rai
A talk I gave recently on data-driven process improvement methodology and techniques with applications and results from insurance and finance processes
Bringing program excellence to process excellenceSteven Bonacorsi
Randy Clark, PowerSteering's Director of Six Sigma, has 20 years of experience in continuous improvement, Six Sigma, and quality management, as well as a longstanding involvement with the Baldridge National Quality Award program. At PowerSteering, Randy consults with global practitioners on maximizing process improvement efforts and has architected the technique of “Applying Six Sigma to Six Sigma” to continuously improve deployment results.How can you ensure that your process excellence projects are getting the best return on your efforts? In this lively discussion, Randy Clark – PowerSteering’s Director of Six Sigma, a Black-Belt trained member of the American Society of Quality, and a three-year examiner for the Malcolm Baldrige National Quality Award – will demonstrate how applying program management principles to Process Excellence can accelerate PEX results and address the challenges of executives, deployment managers, project members, and financial representatives alike. He’ll reveal key ways to improve executive visibility, team productivity, and both top- and bottom-line benefits.
Join this webinar to:
- Learn how you can gather, assess, and prioritize project ideas to ensure resources are focused on the highest-value opportunities
- Get new ideas on embedding best practices into project templates to reduce cycle time and improve accountability, execution and control
- Identify ways to leverage real-time dashboards to monitor key performance indicators and identify where management attention is required
- Recognize opportunities to replicate successful projects and eliminate redundant efforts
- Look at how you can streamline status reporting, gate reviews, and approvals as well as track and validate financial impact
This webinar takes place at 11:00 AM EDT (New York) / 16:00 BST (London) / 17:00 CEST (Paris) / 23:00 HKT (Hong Kong) / 01:00 EST (Sydney). >> Register for free Webinar http://tiny.cc/3aerrw
14th Annual Asian Lean Six Sigma And Process Improvement SummitSteven Bonacorsi
Benefits of Attending
Be part of the growing community at the 14th Annual Lean Six Sigma and Process Improvement Summit Asia 2013
Leading best practice case studies; both small and big picture project examples, providing practical and real time evidence of how you can achieve operational excellence in order to streamline the entire process
Exclusive 3 themed content stream sessions tailored to each stage of Six Sigma and Process Excellence adoption, across industries
Hands on workshop demonstrating how to develop and implement a process excellence structure within your organisation in order to overcome obstacles in stakeholder buy-in and quantify the whole process
Extensive round table and panel discussions; measure practical results in the Lean Six Sigma and Process Excellence tools in order improve operational processes and align them with your organisations core objectives
Over 6 hours of speed networking opportunities plus a dedicated speed-networking session providing you with the opportunity to interact and forge relationships with the Lean Six Sigma Professionals and Process Excellence community of experts across industries.
Synthetic Fiber Construction in lab .pptxPavel ( NSTU)
Synthetic fiber production is a fascinating and complex field that blends chemistry, engineering, and environmental science. By understanding these aspects, students can gain a comprehensive view of synthetic fiber production, its impact on society and the environment, and the potential for future innovations. Synthetic fibers play a crucial role in modern society, impacting various aspects of daily life, industry, and the environment. ynthetic fibers are integral to modern life, offering a range of benefits from cost-effectiveness and versatility to innovative applications and performance characteristics. While they pose environmental challenges, ongoing research and development aim to create more sustainable and eco-friendly alternatives. Understanding the importance of synthetic fibers helps in appreciating their role in the economy, industry, and daily life, while also emphasizing the need for sustainable practices and innovation.
Ethnobotany and Ethnopharmacology:
Ethnobotany in herbal drug evaluation,
Impact of Ethnobotany in traditional medicine,
New development in herbals,
Bio-prospecting tools for drug discovery,
Role of Ethnopharmacology in drug evaluation,
Reverse Pharmacology.
We all have good and bad thoughts from time to time and situation to situation. We are bombarded daily with spiraling thoughts(both negative and positive) creating all-consuming feel , making us difficult to manage with associated suffering. Good thoughts are like our Mob Signal (Positive thought) amidst noise(negative thought) in the atmosphere. Negative thoughts like noise outweigh positive thoughts. These thoughts often create unwanted confusion, trouble, stress and frustration in our mind as well as chaos in our physical world. Negative thoughts are also known as “distorted thinking”.
Operation “Blue Star” is the only event in the history of Independent India where the state went into war with its own people. Even after about 40 years it is not clear if it was culmination of states anger over people of the region, a political game of power or start of dictatorial chapter in the democratic setup.
The people of Punjab felt alienated from main stream due to denial of their just demands during a long democratic struggle since independence. As it happen all over the word, it led to militant struggle with great loss of lives of military, police and civilian personnel. Killing of Indira Gandhi and massacre of innocent Sikhs in Delhi and other India cities was also associated with this movement.
Welcome to TechSoup New Member Orientation and Q&A (May 2024).pdfTechSoup
In this webinar you will learn how your organization can access TechSoup's wide variety of product discount and donation programs. From hardware to software, we'll give you a tour of the tools available to help your nonprofit with productivity, collaboration, financial management, donor tracking, security, and more.
Palestine last event orientationfvgnh .pptxRaedMohamed3
An EFL lesson about the current events in Palestine. It is intended to be for intermediate students who wish to increase their listening skills through a short lesson in power point.
How to Split Bills in the Odoo 17 POS ModuleCeline George
Bills have a main role in point of sale procedure. It will help to track sales, handling payments and giving receipts to customers. Bill splitting also has an important role in POS. For example, If some friends come together for dinner and if they want to divide the bill then it is possible by POS bill splitting. This slide will show how to split bills in odoo 17 POS.
Students, digital devices and success - Andreas Schleicher - 27 May 2024..pptxEduSkills OECD
Andreas Schleicher presents at the OECD webinar ‘Digital devices in schools: detrimental distraction or secret to success?’ on 27 May 2024. The presentation was based on findings from PISA 2022 results and the webinar helped launch the PISA in Focus ‘Managing screen time: How to protect and equip students against distraction’ https://www.oecd-ilibrary.org/education/managing-screen-time_7c225af4-en and the OECD Education Policy Perspective ‘Students, digital devices and success’ can be found here - https://oe.cd/il/5yV
How to Create Map Views in the Odoo 17 ERPCeline George
The map views are useful for providing a geographical representation of data. They allow users to visualize and analyze the data in a more intuitive manner.
2024.06.01 Introducing a competency framework for languag learning materials ...Sandy Millin
http://sandymillin.wordpress.com/iateflwebinar2024
Published classroom materials form the basis of syllabuses, drive teacher professional development, and have a potentially huge influence on learners, teachers and education systems. All teachers also create their own materials, whether a few sentences on a blackboard, a highly-structured fully-realised online course, or anything in between. Despite this, the knowledge and skills needed to create effective language learning materials are rarely part of teacher training, and are mostly learnt by trial and error.
Knowledge and skills frameworks, generally called competency frameworks, for ELT teachers, trainers and managers have existed for a few years now. However, until I created one for my MA dissertation, there wasn’t one drawing together what we need to know and do to be able to effectively produce language learning materials.
This webinar will introduce you to my framework, highlighting the key competencies I identified from my research. It will also show how anybody involved in language teaching (any language, not just English!), teacher training, managing schools or developing language learning materials can benefit from using the framework.
2. Control
Lean Six Sigma
DMAIC Tools and Activities
Review Project Charter
Validate High-Level Value
Stream Map and Scope
Validate Voice of the
Customer
& Voice of the Business
Validate Problem Statement
and Goals
Validate Financial Benefits
Create Communication Plan
Select and Launch Team
Develop Project Schedule
Complete Define Tollgate
Identify Root Causes
Reduce List of Potential Root
Causes
Confirm Root Cause to
Output Relationship
Estimate Impact of Root
Causes on Key Outputs
Prioritize Root Causes
Value-Add Analysis
Takt Rate Analysis
Quick Wins
Statistical Analysis
Complete Analyze Tollgate
Develop Potential Solutions
Evaluate, Select, and
Optimize Best Solutions
Develop ‘To-Be’ Value
Stream Map(s)
Develop and Implement Pilot
Solution
Implement 5s Program
Develop Full Scale
Implementation Plan
Cost/Benefit Analysis
Benchmarking
Complete Improve Tollgate
Develop SOP’s, Training
Plan & Process Controls
Implement Solution and
Ongoing Process
Measurements
Confirm Attainment of Project
Goals
Identify Project Replication
Opportunities
Training
Complete Control Tollgate
Transition Project to Process
Owner
Project Charter
Voice of the Customer and
Kano Analysis
SIPOC Map
Project Valuation/ROIC
Analysis Tools
RACI and Quad Charts
Stakeholder Analysis
Communication Plan
Effective Meeting Tools
Inquiry and Advocacy Skills
Time Lines, Milestones,
and Gantt Charting
Pareto Analysis
Value Stream Mapping
Process Cycle
Efficiency/Little’s Law
Operational Definitions
Data Collection Plan
Statistical Sampling
Measurement System
Analysis (MSA)
Gage R&R
Kappa Studies
Control Charts
Spaghetti Diagrams
Histograms
Normality Test
Process Capability Analysis
Process Constraint ID and
Takt Time Analysis
Cause & Effect Analysis
FMEA
Hypothesis Tests/Conf.
Intervals
Simple & Multiple Regression
ANOVA
Components of Variation
Conquering Product and
Process Complexity
Queuing Theory
Replenishment Pull/Kanban
Stocking Strategy
Process Flow Improvement
Process Balancing
Analytical Batch Sizing
Total Productive Maintenance
Design of Experiments (DOE)
Solution Selection Matrix
Piloting and Simulation
Work Control System
Setup reduction
Pugh Matrix
Pull System
Mistake-Proofing/
Zero Defects
Standard Operating
Procedures (SOP’s)
Process Control Plans
Visual Process Control Tools
MGPP
Statistical Process Controls
(SPC)
Solution Replication
Visual Workplace
Metrics
Project Transition Model
Team Feedback Session
Value Stream Map Flow
Identify Key Input, Process
and Output Metrics
Develop Operational
Definitions
Develop Data Collection Plan
Validate Measurement
System
Collect Baseline Data
Determine Process Capability
Complete Measure Tollgate
Define Measure Analyze Improve Control
Kaizen Events Targeted in Measure to Accelerate Results
Lean Six Sigma Online Training Video by the Process Excellence Network
International Standards for Lean Six Sigma (ISLSS) 2
3. Control Summary Control
?
?
?
?
?
Documentation
Provide any necessary training
Translation project within/ outside of region/function:
Any resulting spin-off projects initiated
Any Replication in other locations?
Communication:
Communicate project results with customer
Communicate results with the business
Include text here to explain
highlights of the plan to monitor and
respond to variation in y’s and x’s
Baseline Improved
Units ? ?
Defects ? ?
DPMO ? ?
Mean* ? ?
PCE% ? ?
Std. Deviation* ? ?
Sigma (ST) ? ?
Sigma (LT) ? ?
?
?
?
?
?
Summarize benefits to the
internal/external customers here.
Start tracking benefits from date of
implementation of Improve Phase
Improvements.
Enter Key Slide Take Away (Key Point) Here
3
Control/Response Plan Highlights Benefits of Project
Sigma Levels/Improvements Communication & Translation
Case Study: Improve Customer Satisfaction Video by Chris Noguera
International Standards for Lean Six Sigma (ISLSS)
4. Control
Descriptive Statistics
Process Capability
Process Capability Analysis for Cholesterol
ST
LT
Process Capability Analysis for Control
Cholesterol
120 140 160 180 200 220 240 260
USL
PPM < LSL
PPM > USL
*
151146.50
*
133333.33
*
116152.65
140 160 180 200 220 240
220.000
*
*
193.133
30
26.0455
22.4931
*
0.34
*
0.34
*
Cholesterol
*
0.40
*
PPM < LSL
PPM > USL
Capability
PPM < LSL
PPM > USL
PPM < LSL
PPM > USL
Capability Observed Performance Expected ST Performance Expected LT Performance
PPM < LSL
PPM > USL
Display Histograms PPM Total
& Process Capability Reports Video by SigmaXL Inc.
PPM < LSL
PPM > USL
PPM Total
PPM < LSL
PPM > USL
PPM Total
*
16153.51
16153.51
*
43119.06
43119.06
*
0.00
0.00
220.000
*
*
184.967
30
20.4206
16.3662
*
0.57
*
0.57
*
*
0.71
*
0.71
Data
ST
LT
USL
PPM Total
PPM Total
PPM Total
USL
Target
LSL
Mean
Sample N
StDev (ST)
StDev (LT)
Process Data
Potential *
Overall (LT) Capability USL
116152.65
Cp
116152.65
151146.50
133333.33
0.40
Observed Performance Expected ST Performance Expected LT Performance
Capability
ST
LT
Target
CPU
LSL
CPL
Mean
Cpk
Sample N
Cpm
StDev (ST)
StDev (LT)
Pp
Cp
PPU
CPU
PPL
Ppk
220.000
*
*
193.133
30
26.0455
22.4931
*
(ST) Capability
220.000
*
0.34
*
*
184.967
0.34
*
*
30
20.4206
16.3662
*
0.40
*
0.57
0.40
Process Data
CPL
*
Potential (ST) Capability
(Baseline)
(Improved)
Enter Key Slide Take Away (Key Point) Here
International Standards for Lean Six Sigma (ISLSS) 4
260
ST
LT
240 260
PPM Total
116152.65
Expected LT Performance
5. Control
Item/ Process Step
Potential
Failure
Mode
Potential
Failure
Effects
Severity #
Causes of
Failure
Occurrence #
Current Control
Detection #
RPN
Recommended
Action Responsibility
Target
Completion
Date
Actual Date
Action
Completed
New Severity #
New Occurance #
New Detection #
New RPN
Example
Document
not
Received
delay of
scheduled
delivery
7
User forgot to
update system
and send
document
3
Call user to escalate
issue
7 147
Automate system
settings for
missing field
values and auto
send
Ima N. Charge,
Program
Manager
Joe Schmoe,
Process Mgr
9/30/2005 10/20/2005 7 1 1 7
FMEA
Risk Analysis recommended actions (Key Speaking Points)
Rating Index
Total Current Risk Priority Number (RPN) Risk
Enter Key Slide Take Away (Key Point) Here
How to Become an Effective FMEA Practitioner Training Video by ReliaSoft
International Standards for Lean Six Sigma (ISLSS) 5
6. Control
RACI Chart
(Optional)
R = Responsible: The person who performs the action/task.
A = Accountable: The person who is held accountable that the action/task is completed.
C = Consulted: The person(s) who is consulted before performing the action/task.
I = Informed: The person(s) who is informed after performing the action/task.
Step Action/Task Responsible Accountable Consulted Informed
1
2
3
4
5
6
7
8
9
10
6
Enter Key Slide Take Away (Key Point) Here
RACI Implementation Training Video by Michael Carew at raci.com
International Standards for Lean Six Sigma (ISLSS)
7. Control
Control / Response &
Escalation Plan
Data Monitor checks
the dashboard and
learns that I-MR and is
out of control
Escalates to the Process
Owner & Black Belt for
special cause
identification
FMEA is used to update
any failure/actions or
improvements not
recorded
Supplier is contacted to
review defects and
actions
Process (x) and Outcome (y)
Indicators
UOM Target
Control
Limit
Process Owner/
Data Monitor
System/ Source What to check
Frequency/
Time
Procedure
Reference
(optional)
Total number of open tickets at
end of day
ticket 0 10 Joe Schmoe
Remedy Ticket
Data
Open ticket report on
reports screen
Daily M-F at
5 pm
SOP 7.2
Action if control limit is exceeded:
Number of tickets per technician ticket 0 2 Joe Schmoe
Remedy Ticket
Data
Open ticket report on
reports screen
Daily M-F at
5 pm
SOP 7.2
Action if control limit is exceeded:
Personal Time Off Schedule
people
out/day
0 2 Tom Orrow Outlook Calendar
Number of staff with PTO
for coming week
Weekly
Friday pm
none
Action if control limit is exceeded:
Notify Service Delivery Leader if # of open tickets per day is above control limit. SDL will carry out root cause analysis with
team members, post resulting findings on call center bulletin board and Knowledge Base web site. Program Manager will
be notified if open tickets exceeds 15; Customer will be notified if open tickets exceeds 20.
Notify manager if any individual has >2 open tickets for more than 1 consectuive day. Work with indivdual to determine
root cause and agree on remedy actions.
Arrange for coverage from XYZ account if more than 2 people on personal time off (unless predicted ticket volume is less
than 200 per day)
Process Escalation Map
Enter Key Slide Take Away (Key Point) Here
Control Plan Training Video by 6ixsigmaorg
International Standards for Lean Six Sigma (ISLSS) 7
8. Business Impact Control
State financial impact of future project leverage opportunities
Separate “hard or Type 1” from “soft Type 2 or 3” dollars
Annual Estimate Replicated Estimate
Revenue
Enhancement
• Type 1: ?
• Type 2: ?
• Type 3: ?
• Type 1: ?
• Type 2: ?
• Type 3: ?
Expenses
Reduction
• Type 1: ?
• Type 2: ?
• Type 3: ?
• Type 1: ?
• Type 2: ?
• Type 3: ?
Loss Reduction • Type 1: ?
• Type 2: ?
• Type 3: ?
• Type 1: ?
• Type 2: ?
• Type 3: ?
Cost Avoidance • Type 1: ?
• Type 2: ?
• Type 3: ?
• Type 1: ?
• Type 2: ?
• Type 3: ?
Total Savings • Type 1: ?
• Type 2: ?
• Type 3: ?
• Type 1: ?
• Type 2: ?
• Type 3: ?
8
Enter Key Slide Take Away (Key Point) Here
Cost Benefit Analysis Training Video by John Gunyou
International Standards for Lean Six Sigma (ISLSS)
9. Business Impact Details Control
Type 1: Describe the chain of causality that shows how you determined the Direct Cash Flow. Tell the story
with cause & effect relationships, on how the proposed change should create the desired financial result ($) in
your project.
Show the financial calculation savings and assumptions used.
Assumption #1 (i.e. source of data, clear Operational Definitions?)
Assumption #2 (i.e. hourly rate + incremental benefit cost + travel)
Type 2: Describe the chain of causality that shows how you determined the Labor Efficiency savings. Tell the
story with cause & effect relationships on how the change should create the desired financial result ($).
Show the financial calculation savings and assumptions used.
Assumption #1 (i.e. Labor rate used, period of time, etc…)
Assumption #2 (i.e. contractor hrs or FTE, source of data, etc…)
Describe the Type 3 Business Impact(s) areas and how these were measured (i.e. Cost/Risk Avoidance)
Assumption #1 (i.e. project is driven by the Business strategy?)
Assumption #2 (i.e. Customer service rating, employee moral, etc…)
Other Questions
Stakeholders agree on the project’s impact and how it will be measured in financial terms?
What steps were taken to ensure the integrity & accuracy of the data?
Has the project tracking worksheet been updated?
9
Enter Key Slide Take Away (Key Point) Here
Direct vs. Indirect Cost Training Video by John Gunyou
International Standards for Lean Six Sigma (ISLSS)
10. Current Status Control
Key actions
completed
Issues
Lessons learned
Communications,
team building,
organizational
activities
Lean Six Sigma Project Status and Planning
Deliverables/Tasks Completed last week Comments
Deliverable/Action Who Due Revised Due Comments/Issue/Risk Who Due Revised Due Recommended Upcoming Deliverables/Tasks - 2 weeks out Due Revised Due
For deliverables due thru:
Actions Scheduled for next 2 Weeks
Current Issues and Risks
Enter Key Slide Take Away (Key Point) Here
Project Status Reporting Training Video by ZOOMtoLearn
10
International Standards for Lean Six Sigma (ISLSS)
11. Lessons Learned Control
1. ?
2. ?
3. ?
4. ?
5. ?
6. ?
7. ?
8. ?
9. ?
10.?
Enter Key Slide Take Away (Key Point) Here
How to Capture Lessons Learned Training Video by projectmanagervideos
International Standards for Lean Six Sigma (ISLSS) 11
12. Project Contributors Control
Steering Team Support Team
<Name>: <Contribution>
Project Ownership Team Deployment Team
<Name>: <Contribution>
Enter Key Slide Take Away (Key Point) Here
Respect for People & Culture (Norman Bodek) Video by GAManufacturing
International Standards for Lean Six Sigma (ISLSS) 12
13. Next Steps Control
Key actions?
Planned Lean Six Sigma
Tools/Activities to be used?
Questions to answer?
Barrier/risk mitigation activities?
Kaizen or Quick Win Opportunities?
Last Revised:
No. Description/Recommendation
Status
Open/Closed/Hold
Due Date
Revised Due
Date
Resp Comments / Resolution
1
2
3
4
5
6
7
8
9
10
Lean Six Sigma Project Issue Log
How to assess an improvement idea - Paul Akers Training by George Trachilis
13
Enter Key Slide Take Away (Key Point) Here
International Standards for Lean Six Sigma (ISLSS)
14. Sign Off Control
Once the project is complete and has been reviewed by the Green Belt/Black Belt or other Quality
mentor, the project should be reviewed with Deployment Champion, Project Sponsor, Process
Owner, Master Black Belt and other project or process stakeholders. In addition, financial benefits
of the project (or the method used to estimate financial benefits) should be confirmed by your
Process Owner and/or Financial Representative.
Policies & Procedures for the Improve & Control phases were documented & communicated
on MM/DD/YY
I understand the New Policies and Procedures
I understand and take responsibility for monitoring the Process Measurements as
delineated in the Control Plan
I will report the progress on this sub-process on a regular basis to the customer
I have reviewed this project’s financial benefits with the Champion, Sponsor, and Finance
I understand the corrective action procedure and am responsible for ensuring that action
items are completed to hold the gains and capture the financial benefits
Enter Name Here
“Other” Key Stakeholder
Enter Name Here
Green Belt/Black Belt
Enter Name Here
Master Black Belt
Enter Name Here
Sponsor / Process Owner
Enter Name Here
Deployment Champion
Enter Name Here
Financial Representative
Enter Name Here
Executive Director
Enter Name Here
“Other” Key Stakeholder
Enter Key Slide Take Away (Key Point) Here
Being Extreme in Leadership | Jack Welch Video by Mark Thompson
International Standards for Lean Six Sigma (ISLSS) 14
15. Lean Six Sigma Tollgate Control
Review Backup Slides
International Standards for Lean Six Sigma (ISLSS)
16. Project Charter Control
Problem/Goal Statement
Problem: Describe problem in non-technical terms
Statement should explain why project is important; why
working on it is a priority
Goal: Goals communicate “before” and “after” conditions
Shift mean, variance, or both?
Should impact cost, time, quality dimensions
Express goals using SMART criteria
Specific, Measurable, Attainable, Resource
Requirements, Time Boundaries
Explain leverage and strategic implications (if any)
Financial Impact
Tollgate Review Schedule
Team
Scope:
In-Scope/Out-of-Scope
Process Start/Stop
State financial impact of project
Expenses
Investments (inventory, capital, A/R)
Revenues
Separate “hard” from “soft” dollars
State financial impact of leverage opportunities (future
projects, replication opportunities, project iterations)
PES Name Project Executive Sponsor (if different from PS)
PS Name Project Sponsor/Process Owner
DC Name Deployment Champion
GB/BB Name Green Belt/Black Belt
MBB Name Master Black Belt
Core Team Role % Contrib. LSS Training
Team Member 1 SME XX YB
Team Member 2 TM XX GB
Team Member 3 SME XX PS
Extended Team
Team Member 1 BFM XX Not Trained
Team Member 2 IT XX Not Trained
Tollgate Scheduled Revised Complete
Define: XX/XX/XX - XX/XX/XX
Measure: XX/XX/XX XX/XX/XX XX/XX/XX
Analyze: XX/XX/XX XX/XX/XX XX/XX/XX
Improve: XX/XX/XX XX/XX/XX XX/XX/XX
Control: XX/XX/XX XX/XX/XX XX/XX/XX
Review high-level schedule milestones here:
Phase Completions
Tollgate Reviews
Enter Key Slide Take Away (Key Point) Here
How to Create a Project Charter Training Video by Jason Dodd
International Standards for Lean Six Sigma (ISLSS) 16
17. Measure Overview Control
CTQ: ?
Unit (d) or Mean (c): ?
Defect (d) or St. Dev. (c): ?
PCE%: ?
DPMO (d): ?
Sigma (Short Term): ?
Sigma (Long Term):?
MSA Results: show the percentage result of the GR&R,
AR&R or other MSA carried out in the project
Root cause:
Quick Win #1
Root cause:
Quick Win #2
Root cause:
Quick Win #3
Observation
Individual Value
1 28 55 82 109 136 163 190 217 244
40
35
30
25
20
UC L=37.70
_
X=29.13
LC L=20.56
Observation
Moving Range
1 28 55 82 109 136 163 190 217 244
10.0
7.5
5.0
2.5
0.0
UC L=10.53
__
MR=3.22
LC L=0
I-MR Chart of Delivery Time
Detailed process mapping
MSA
Value Stream Mapping
Data Collection Planning
Basic Statistics
Process Capability
Histograms
Time Series Plot
Probability Plot
Pareto Analysis
Operational Def.
5s
Pull
Control Charts
Enter Key Slide Take Away (Key Point) Here
17
Process Capability Graphical Analysis
Root Cause / Quick Win Tools Used
Process Distribution Training Video by Statisfaction
International Standards for Lean Six Sigma (ISLSS)
18. Analyze Overview Control
Value Add Analysis - Current State
80
60
40
20
0
Takt Time = 55
1 2 3 4 5 6 7 8 9 10
Task #
Task Time (seconds)
CVA Time BVA Time NVA Time
Root cause:
Effect
Root cause:
Effect
Root cause:
Effect
Value Add Analysis
One-Way ANOVA
Two-Way ANOVA
Pareto Plots
Simple Linear Regression
Multiple Regression
Test for Equal Variance
Scatter Plots
C&E Matrix
Complexity
Cause & Effect Diagram
Kaizen/Quick Wins
FMEA
Control/Impact Chart
T-Test
Other
Hypothesis Test
(ANOVA, 1 or 2 sample t - test, Chi Squared,
Regression, Test of Equal Variance, etc)
Factor (x)
Tested
p Value Observations/Conclusion
Example: ANOVA Location 0.030
Significant factor - 1 hour driving time from DC
to Baltimore office causes ticket cycle time to
generally be longer for the Baltimore site
Example: ANOVA Part vs. No Part 0.004
Significant factor - on average, calls requiring
parts have double the cycle time (22 vs 43
hours)
Example: Chi Squared Department 0.000
Significant factor - Department 4 has digitized
addition of customer info to ticket and less
human intervention, resulting in fewer errors
Example: Pareto Region n/a
South region accounted for 59% of the defects
due to their manual process and distance from
the parts warehouse
Describe any other observations about the root cause (x) data
Enter Key Slide Take Away (Key Point) Here
18
Hypothesis Tests Value-Add Analysis
Root Cause / Effect Tools Used
Process Cycle Efficiency PCE% Training Video by Gemba Academy
International Standards for Lean Six Sigma (ISLSS)
19. Control
Improve Summary
Vital X (root cause) Proof of Causation
Practical Solution (process change
to address X)
Operating
Tolerances for X
Client IT need to reverify
all exit data received from
Client HR
Average delay between
reception of information
from Client HR until it
reaches NT Admin or
general admin
Eliminate process - Place accountability
on Client HR for information placed into
new database.
n/a
E-mail vendor's contract
with Client
The SLA has a range of 3-
5 business days for the
completion of a delete
request
E-mail vendor instituted new web
interface for all add/delete requests,
vastly improving request processing
time.
1 - 2 days
E-mail vendor's contract
with Client
The SLA has a range of 3-
5 business days for the
completion of a delete
request
E-mail vendor instituted new web
interface for all add/delete requests,
vastly improving request processing
time.
1 - 2 days
How the solution was determined:
What was the solution selection tool used?
What project management tools were used?
Cost/benefit analysis?
Include any other tools or methods used
1. ?
2. ?
3. ?
4. ?
5. ?
Enter Key Slide Take Away (Key Point) Here
“What Does a Good Leader or Coach Do?” Video by Lean Leadership Institute
19
Solution Selection Criteria Pilot and Implementation Plan
International Standards for Lean Six Sigma (ISLSS)
20. Control
Control
Tollgate Checklist
Has the team prepared all the essential documentation for the improved process,
including revised/new Standard Operating Procedures (SOP’s), a training plan and a
process control system?
Has the necessary training for process owners/operators been performed?
Have the right measures been selected, and documented as part of the Process
Control System, to monitor performance of the process and the continued
effectiveness of the solution? Has the metrics briefing plan/schedule been
documented? Who owns the measures? Has the Process Owner’s job description
been updated to reflect the new responsibilities? What happens if minimum
performance is not achieved?
Has the solution been effectively implemented? Has the team compiled results data
confirming that the solution has achieved the goals defined in the Project Charter?
Has the Benefits Realization Schedule been verified by the Financial Representative?
Has the process been transitioned to the Process Owner, to take over responsibility
for managing continuing operations? Do they concur with the control plan?
Has a final Storyboard documenting the project work been developed?
Has the team forwarded other issues/opportunities, which were not able to be
addressed, to senior management?
Have “lessons learned” been captured?
Have replication opportunities been identified and communicated?
Has the hard work and successful efforts of our team been celebrated?
Deliverables:
Tollgate Review
SOP’s
Training Plan
Process Control System
Benefits Realization Schedule,
validated by Financial
Representative
Validated Solution
Replication/ Standardization Plan
Lessons Learned
Transitioned Project
Project Risk Performance
Deliverables Uploaded to
Central Storage Location or
Deployment Management
System
Has the team implemented the solution, and a control plan to
insure the process is robust to change?
Control Phase Success Criteria Training Video by educatevirtually
International Standards for Lean Six Sigma (ISLSS) 20
21. Control
Define the opportunity from both the customer
Identify the critical X factors
Develop solutions
linked to critical x’s
21
Lean Six Sigma
DMAIC Improvement Process
Define
and business perspective
Measure
Understand the baseline process
Analyze
performance
and root causes impacting
process performance
Improve
Control
Implement
solutions &
control plan
Enter Key Slide Take Away (Key Point) Here
Driving Strategic Transformation Programs by i-nexus
International Standards for Lean Six Sigma (ISLSS)
22. Control
Total Gage R&R 17.12 41.38
Repeatability 17.12 41.38
Reproducibility 0.00 0.00
operator 0.00 0.00
Part-To-Part 82.88 91.04
Total Variation 100.00 100.00
For Continuous Data, use Minitab GR&R Study
Conclusions: 17.12% of component
variation from measurement system,
82.88% of component variation from
part-to-part measured
Gage name:
Date of study:
Reported by:
Tolerance:
Misc:
110 1 2
0
100
90
80
70
60
50
40
30
20
10
Xbar Chart by operator
3.0SL=75.30
X=59.80
-3.0SL=44.30
80 1 2
0
70
60
50
40
30
20
10
0
R Chart by operator
3.0SL=56.83
R=26.87
-3.0SL=0.00E+00
1 2 3 4
100
90
80
70
60
50
40
30
20
part
operator
operator*part Interaction
Average
1
2
1 2
100
90
80
70
60
50
40
30
20
10
Oper
Response By operator
1 2 3 4
100
90
80
70
60
50
40
30
20
10
part
Response By part
%Total Var
%Study Var
Gage R&R Repeat Reprod Part-to-Part
100
50
0
Components of Variation
Percent
Gage R&R (ANOVA) for time
Measurement Systems
Analysis (Optional)
For Discrete data, use AR&R Excel Tool
For more information, see Notes section of this slide
Known Population Individual 1 Individual 2 Match Match
Sample # Attribute Try #1 Try #2 Try #1 Try #2 Each Other Known
1 pass pass pass pass pass N N
2 pass pass pass pass pass N N
3 fail fail fail fail pass N N
4 fail fail fail fail fail Y Y
5 fail fail fail pass fail N N
6 pass pass pass pass pass Y Y
7 pass fail fail fail fail Y N
8 pass pass pass pass pass Y Y
9 fail pass pass pass pass Y N
10 fail pass pass fail fail N N
11 pass pass pass pass pass Y Y
12 pass pass pass pass pass Y Y
13 fail fail fail fail fail Y Y
14 fail fail fail pass fail N N
15 pass pass pass pass pass Y Y
16 fail fail fail pass fail N N
17 fail fail fail fail fail Y Y
18 fail fail fail fail fail Y Y
19 pass pass pass pass pass Y Y
20 fail fail fail fail fail Y Y
"REPEATABILITY" -> 100.00% 80.00%
"ACCURACY" -> 85.00% 70.00%
"OVERALL REPEATABILITY & REPRODUCIBILITY" -> 65.00%
"OVERALL REPEATABILITY, REPRODUCIBILITY & ACCURACY" -> 55.00%
Enter Key Slide Take Away (Key Point) Here
Gage R&R (Attribute Data) Training Video using Minitab by Janeth Leon
International Standards for Lean Six Sigma (ISLSS) 22
23. Control
Control Chart
(Optional)
0 50 100 150
0.10
0.05
0.00
Sample Number
Proportion
P Chart for Total Defectives
3.0SL=0.08162
P=0.03817
-3.0SL=0.00E+00
Feb/Mar Data Confirms Process Has
Remained In Control
Control Chart
Findings
?
?
?
?
?
Enter Key Slide Take Away (Key Point) Here
How To Create P-Charts by SigmaXL
International Standards for Lean Six Sigma (ISLSS) 23
24. Control
Takt Board – Monitor
(Optional)
TAKT BOARD: <Department Name>
Last Week: <CTQ>
This Week: <CTQ>
Day Scheduled Actual Diff (+/-) Comments
Enter Key Slide Take Away (Key Point) Here
Made to Order Manage Takt with Quoted Time Video by Greg Lane
International Standards for Lean Six Sigma (ISLSS) 24
25. Control
Mistake Proofing
(Poke Yoke) (Optional)
Solution: Make use of existing bar codes on shipping paperwork to mistake
proof receiving function.
Validate with suppliers (shipping company) that all shipping containers will have
barcode label ($0)
Purchase RF (wireless) bar coding equipment and software ($100/gun * 20 guns)
Train all longshoreman on use and care of equipment ($50/hr * 20 hrs)
Install error metrics for error tracking ($100)
Enter Key Slide Take Away (Key Point) Here
Poka-Yoke and Chaku-Chaku Training Video by TLC
International Standards for Lean Six Sigma (ISLSS) 25
26. Control
Cultural/Educational
Issues (Optional)
Force Field Analysis:
1. Select a process control
method & explain why this
choice for your project.
2. Identify 4-6
cultural/educational barriers to
successfully implementing
your process controls &
potential solutions using the
Force-Field Analysis Table
Driving Forces Restraining Forces
Enter Key Slide Take Away (Key Point) Here
Force Field Analysis Training Video by DePaul University/SNL Online
International Standards for Lean Six Sigma (ISLSS) 26
27. Control
Skills Matrix
(Optional)
Visual management is an
important part of any
implementation.
Define each team
members ability to perform
skills
Develop Improvement
Plan.
Enter Key Slide Take Away (Key Point) Here
Skills Matrix Training Video by BMGI
International Standards for Lean Six Sigma (ISLSS) 27
28. Control
Replication
(Optional)
Replication Goals
29% X$ savings captured with 1st
completed project in 10 week project
70% X$ savings captured with 5
locations replicated in 6 months
100% X$ savings captured with 9
locations replicated in 9 months
Replication Strategy
Build change team
Train / Kaizen
Dashboard Metrics
10 Weeks 6 Months 9 Months
1st completed
project
(29%)
5 locations
standardized
(70%)
9 locations
Replicated
(100%)
Enter Key Slide Take Away (Key Point) Here
Hoshin Kanri: Creating a Strategy Deployment Plan by The Karen Martin Group
International Standards for Lean Six Sigma (ISLSS) 28
30. Control
Lean Six Sigma Tollgate
Template Notes
The Lean Six Sigma Tollgate Templates are:
Free and intended as a guide in documenting a Lean Six Sigma
Project. I grant permission for you to modify these templates to meet
the specific needs of your process improvement project.
Instructional - a video has been linked to each Template, I selected a
mix of videos from Thought Leaders in the Lean Six Sigma Group.
I included reference links to all video’s should you want to learn more
information. Also included guidelines in the Note’s section of each
slide.
Efficient and Effective – Placeholders for Graphic or Video Examples
for various tools and methods across each DMAIC Phase.
How to Use These Templates:
Collaboratively – use as a guide, reuse templates independently or
across phases as needed, and change the order as needed to best
capture the execution of Lean Six Sigma in each phase, and
summarize in the final Case Study.
Use as a Communication tool, and document your findings and
results.
30
My name is Steven
Bonacorsi, Author of the
Lean Six Sigma Tollgate
Templates, President of
the International
Standard for Lean Six
Sigma (ISLSS), and
Owner of the LinkedIn
Lean Six Sigma Group.
Replace the content of this slide with images or video’s
related to your process improvement project
International Standards for Lean Six Sigma (ISLSS)
31. Lean Six Sigma Resources Control
31
Lean Six Sigma Group: https://www.linkedin.com/groups/Lean-Six-Sigma-37987
Lean Six Sigma Subgroups: https://www.linkedin.com/groups?subgroups=&gid=37987
International Standard for Lean Six Sigma (ISLSS): http://www.islss.com
Best Wishes in Continuously Improving Your Business Processes
– Steven Bonacorsi, Certified Lean Six Sigma Master Black Belt
International Standards for Lean Six Sigma (ISLSS)
i-nexus: http://www.i-nexus.com
Strategy Execution Community LinkedIn Group
https://www.linkedin.com/groups/Strategy-Execution-Community-3725091
SigmaXL: http://www.sigmaxl.com
SigmaXL LinkedIn Group: https://www.linkedin.com/groups/SigmaXL-1812101?gid=1812101
Gemba Academy http://www.gembaacademy.com Lean CEO Group:
Gemba Academy LinkedIn Group: https://www.linkedin.com/groups/Gemba-Academy-1844998?gid=1844998
PEX Network http://www.processexcellencenetwork.com
PEX Network & IQPC - Lean Six Sigma & Process Excellence for Continuous Improvement
Lean Leadership Institute: http://www.LeanLeadership.guru/books.html The Toyota Way Group
32. Control Lean Six Sigma Groups
(Click Logo’s to Join Group)
Lean Six Sigma Group
Each Week, the Lean Six Sigma Group Grows +1,500 New Members; +2,000 Lean
32
Six Sigma Jobs; +200 Discussions; +500 Comments
+280,000 Members – Come Join the Conversation
International Standards for Lean Six Sigma (ISLSS)
33. Control
Lean Six Sigma Resource Blogs
(Click Logo’s to Follow Blogs)
33
See Notes Section for Links to Lean Six Sigma Group Contributors
International Standards for Lean Six Sigma (ISLSS)
34. Control
Lean Six Sigma Control Phase
Video References – Set 18
34
Lean Six Sigma Online
Training Video by the
Process Excellence Network
Case Study: Improve Customer
Satisfaction Video by
Chris Noguera
Display Histograms & Process
Capability Reports Video by
SigmaXL Inc.
How to Become an Effective
FMEA Practitioner Training
Video by ReliaSoft
Join the Lean Six Sigma Leadership Group:
http://www.linkedin.com/groups?gid=3151087
International Standards for Lean Six Sigma (ISLSS)
RACI Implementation
Video by Michael
Carew at raci.com
Control Plan Training
Video by 6ixsigmaorg
Cost Benefit Analysis
Video by John Gunyou
Direct vs. Indirect Cost
Video by John Gunyou
35. Control
Lean Six Sigma Control Phase
Video References – Set 19
35
Project Status Reporting
Training Video by ZOOMtoLearn
How to Capture Lessons
Learned Training Video by
projectmanagervideos
Respect for People & Culture
(Norman Bodek) Video by
GAManufacturing
How to assess an improvement
idea - Paul Akers Training by
George Trachilis
Join the Process Excellence Network Group:
https://www.linkedin.com/groups/PEX-Network-IQPC-Lean-Six-136889
International Standards for Lean Six Sigma (ISLSS)
Being Extreme in
Leadership | Jack Welch
Video by Mark Thompson
How to Create a Project
Charter Training Video by
Jason Dodd
Process Distribution
Training Video by
Statisfaction
Process Cycle Efficiency
PCE% Training Video by
Gemba Academy
36. Control
Lean Six Sigma Control Phase
Video References – Set 20
36
“What Does a Good Leader or
Coach Do?” Video by the
Lean Leadership Institute
Control Phase Success Criteria
Training Video by
educatevirtually
Driving Strategic
Transformation Programs by
i-nexus
Gage R&R (Attribute Data)
Training Video using Minitab by
Janeth Leon
Join the Gemba Academy Group:
https://www.linkedin.com/groups/Gemba-Academy-1844998
International Standards for Lean Six Sigma (ISLSS)
How To Create P-Charts
by SigmaXL
Made to Order Manage
Takt with Quoted Time
Video by Greg Lane
Poka-Yoke and Chaku-
Chaku Video by TLC
Force Field Analysis
Video by DePaul
University/SNL Online
37. Control
Lean Six Sigma Control Phase
Video References – Set 21
37
Join the Lean Six Sigma Teams (Yellow Belt) Group:
http://www.linkedin.com/groups?gid=3765214
International Standards for Lean Six Sigma (ISLSS)
Skills Matrix Training
Video by BMGI
Hoshin Kanri: Creating a
Strategy Deployment Plan by
The Karen Martin Group