The document discusses key concepts in multicomponent distillation including:
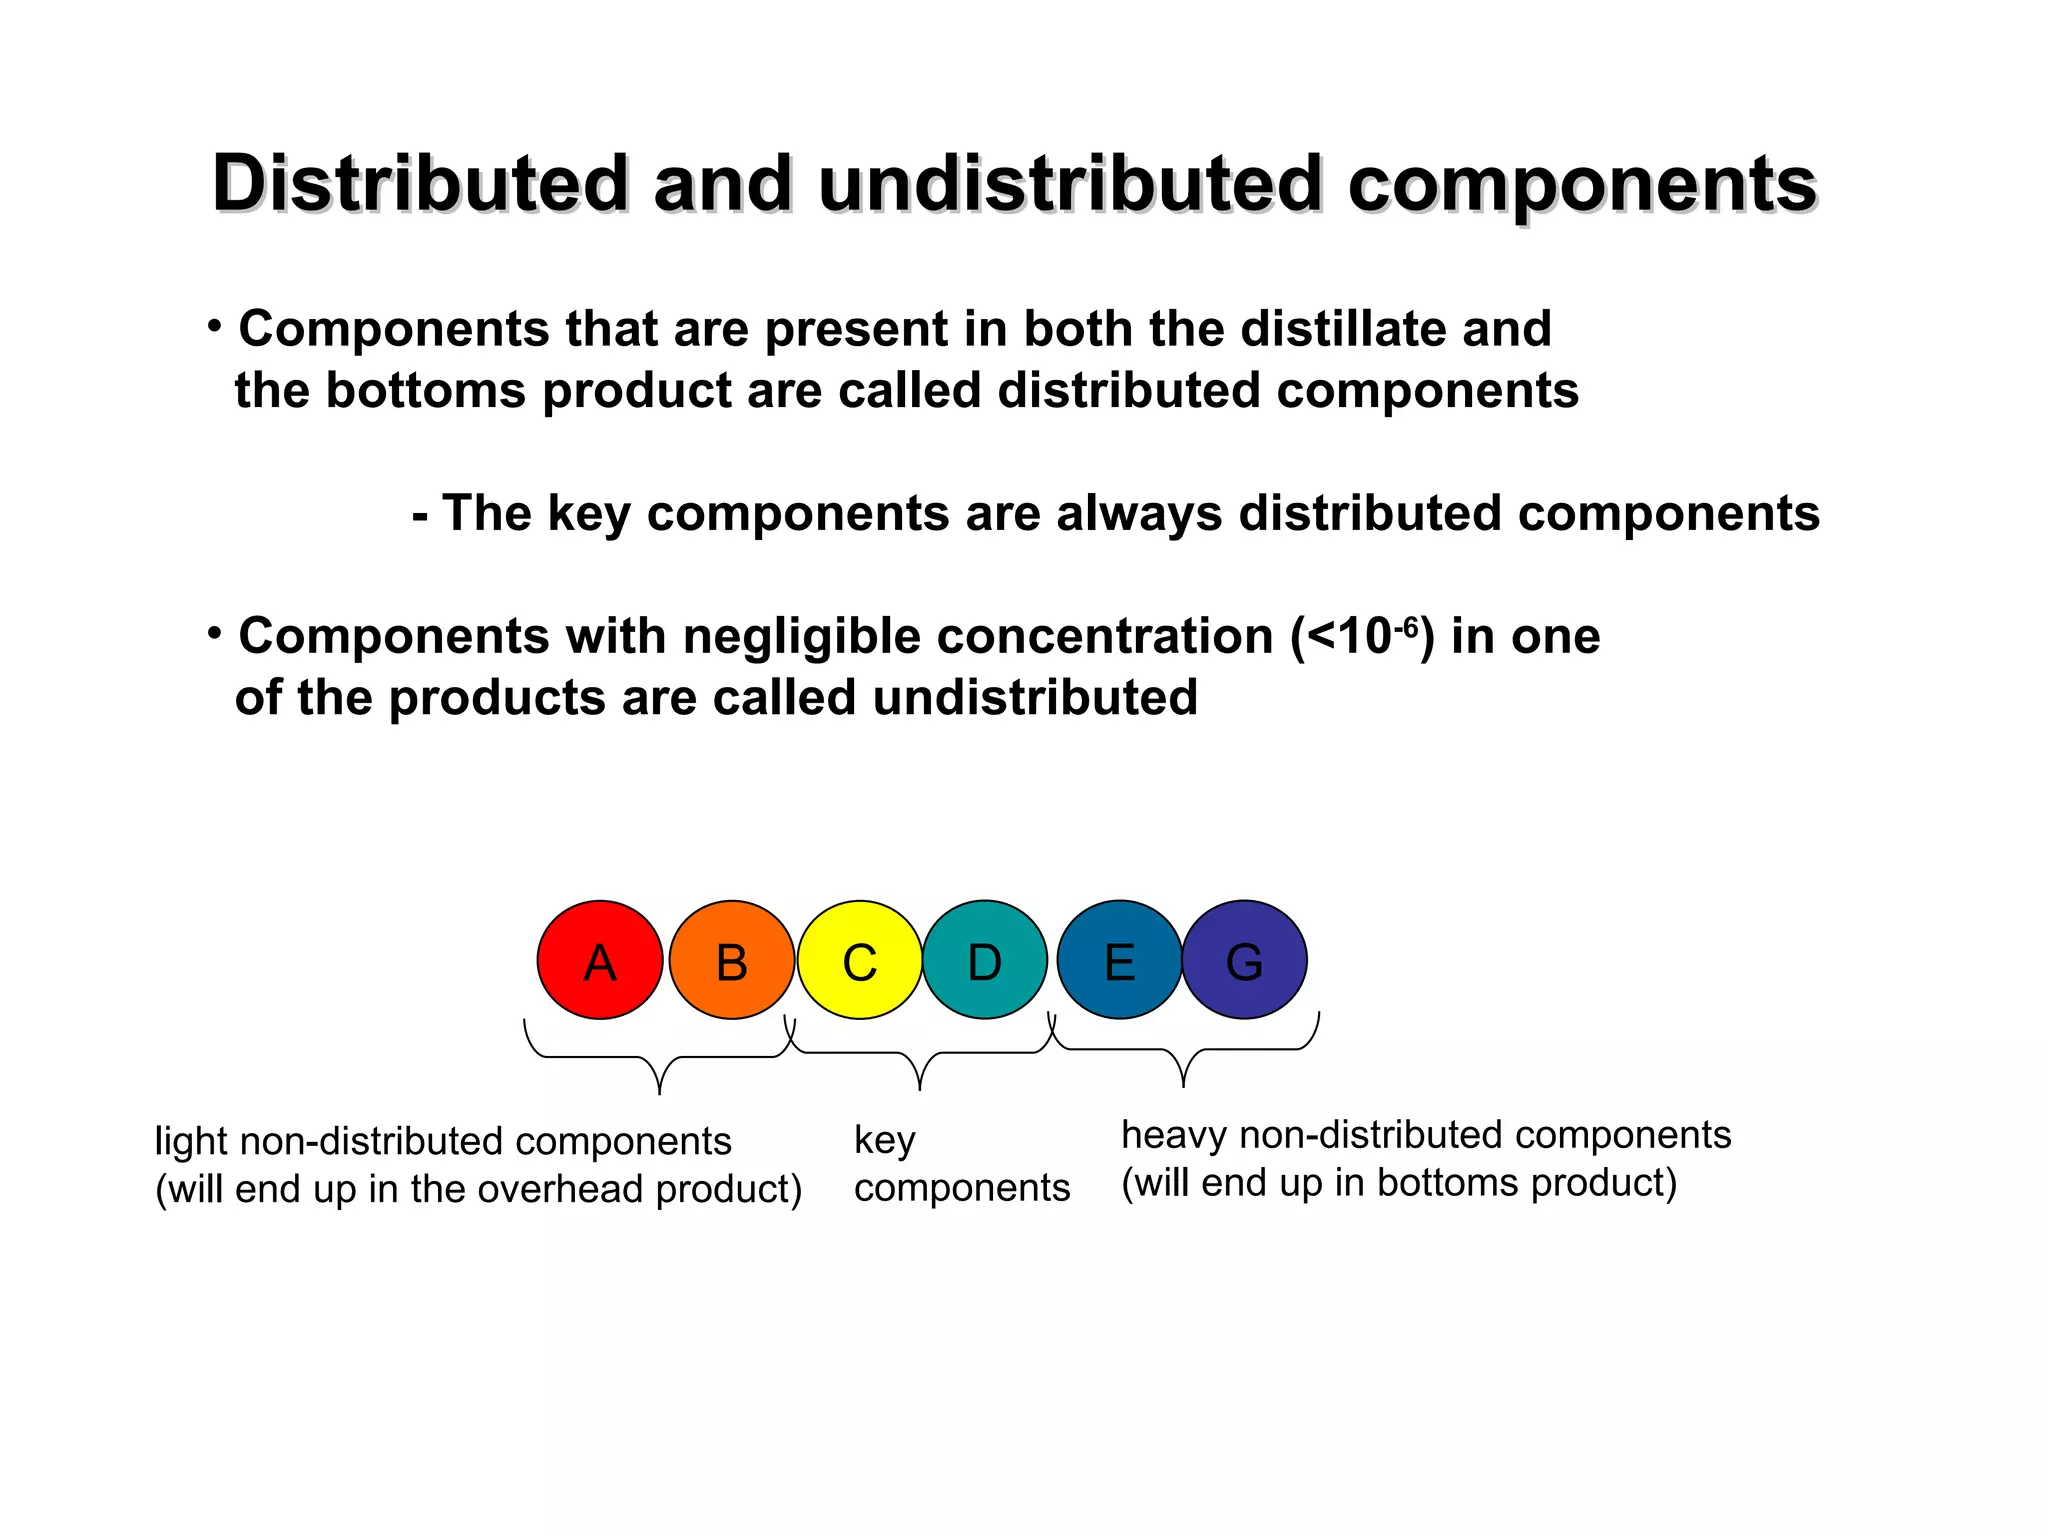
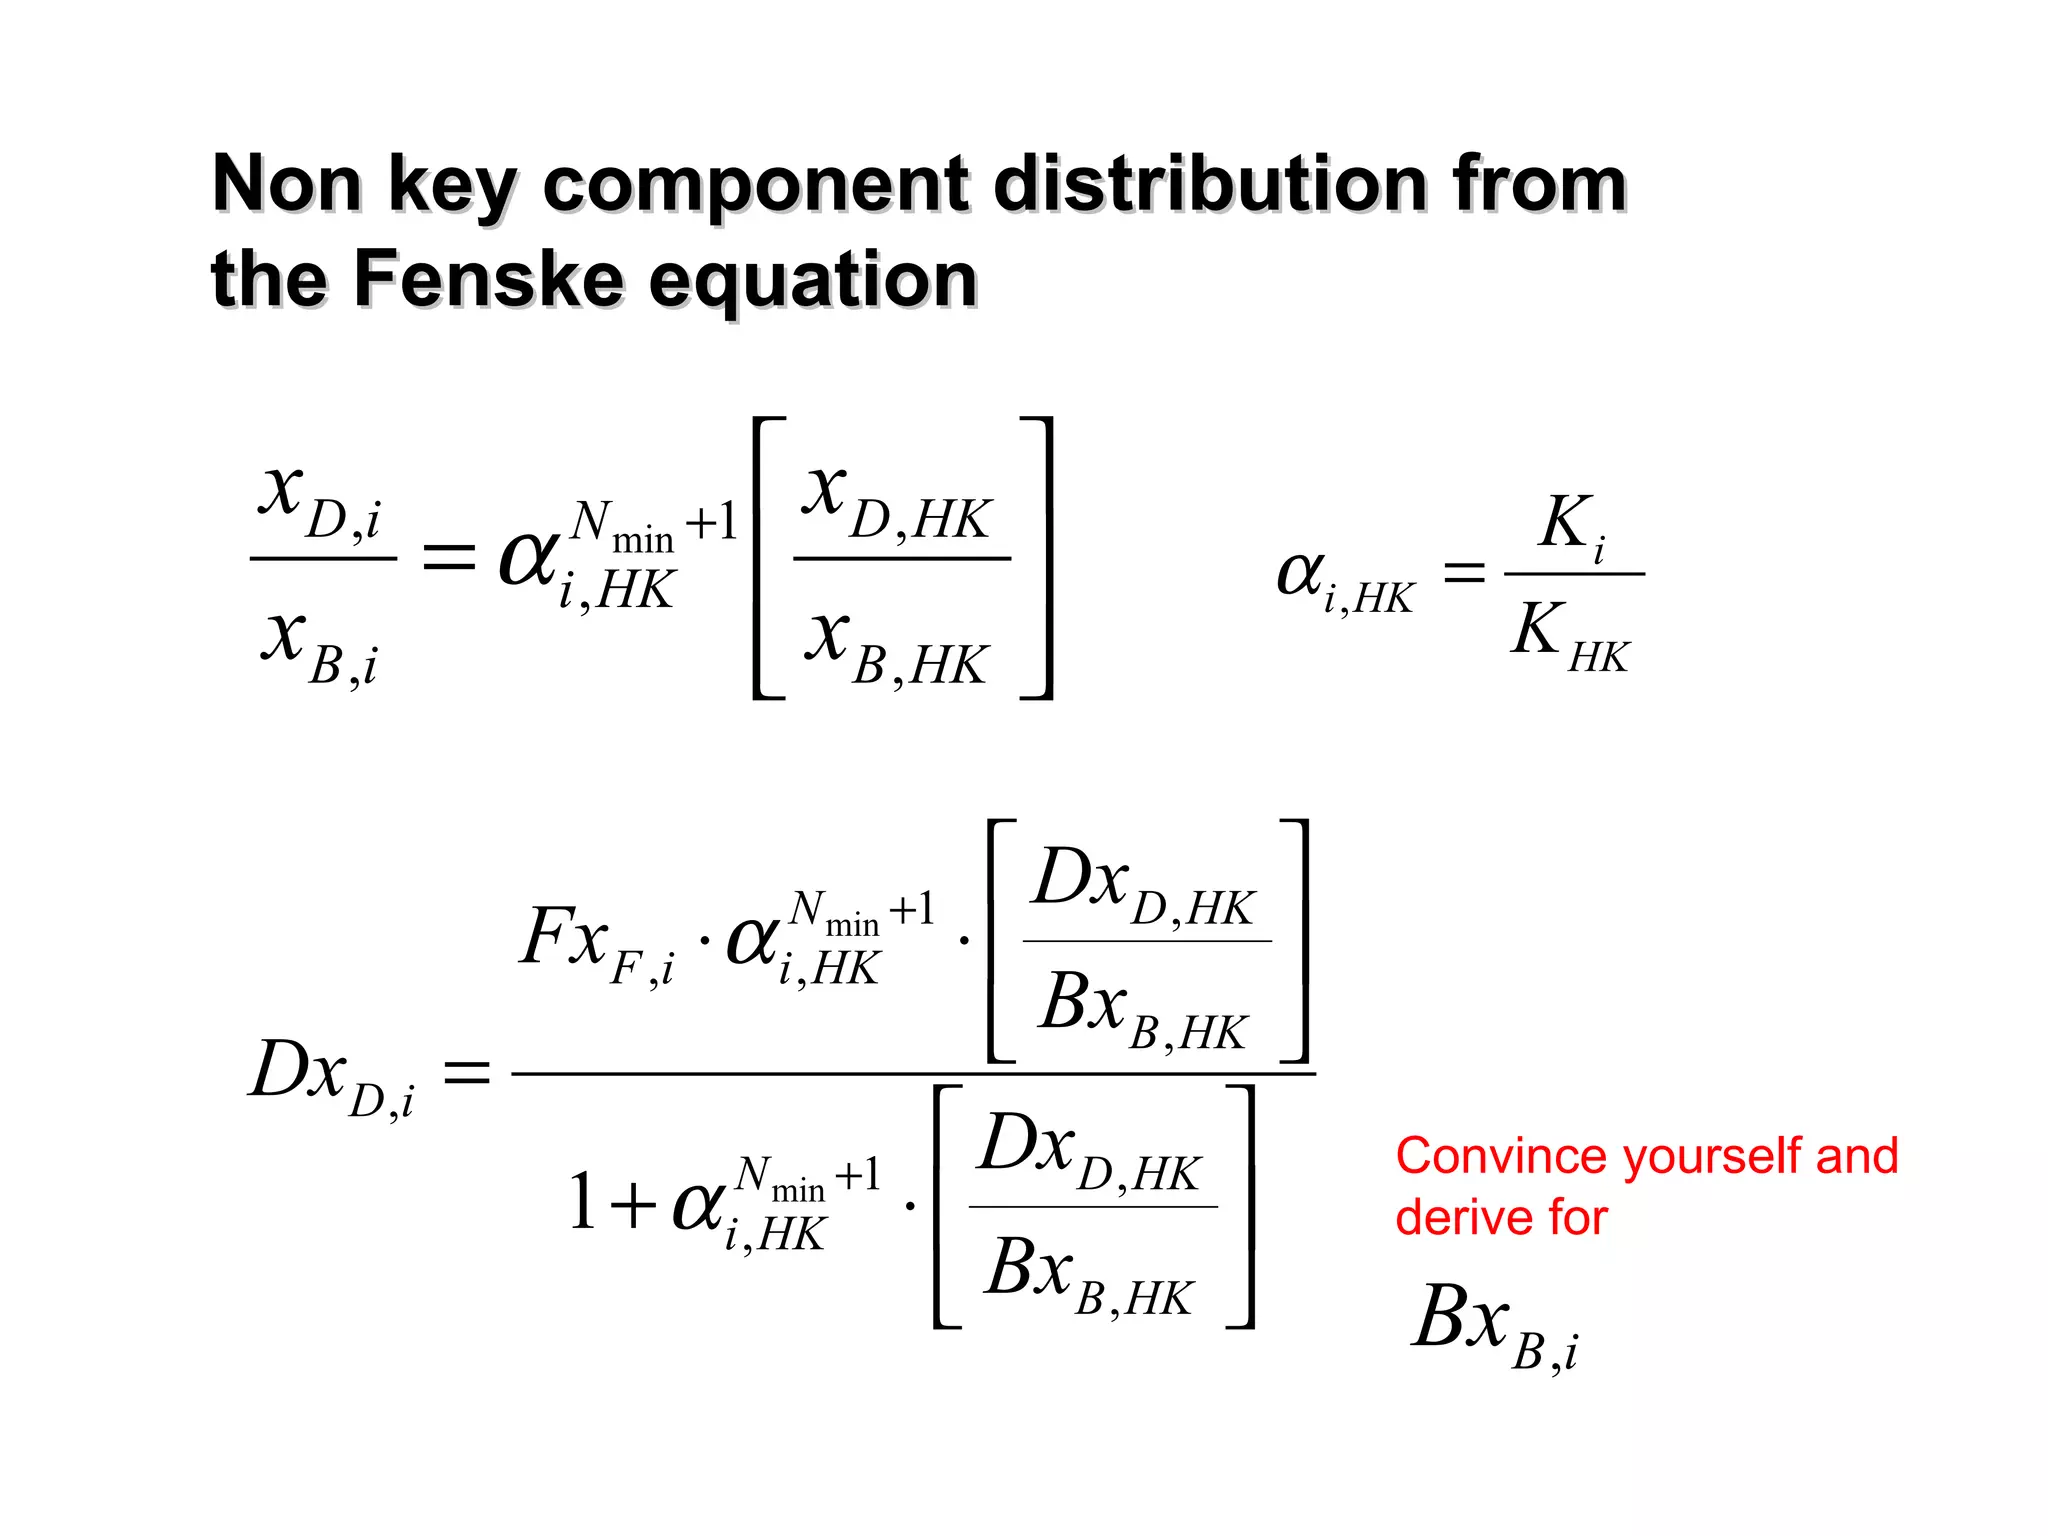
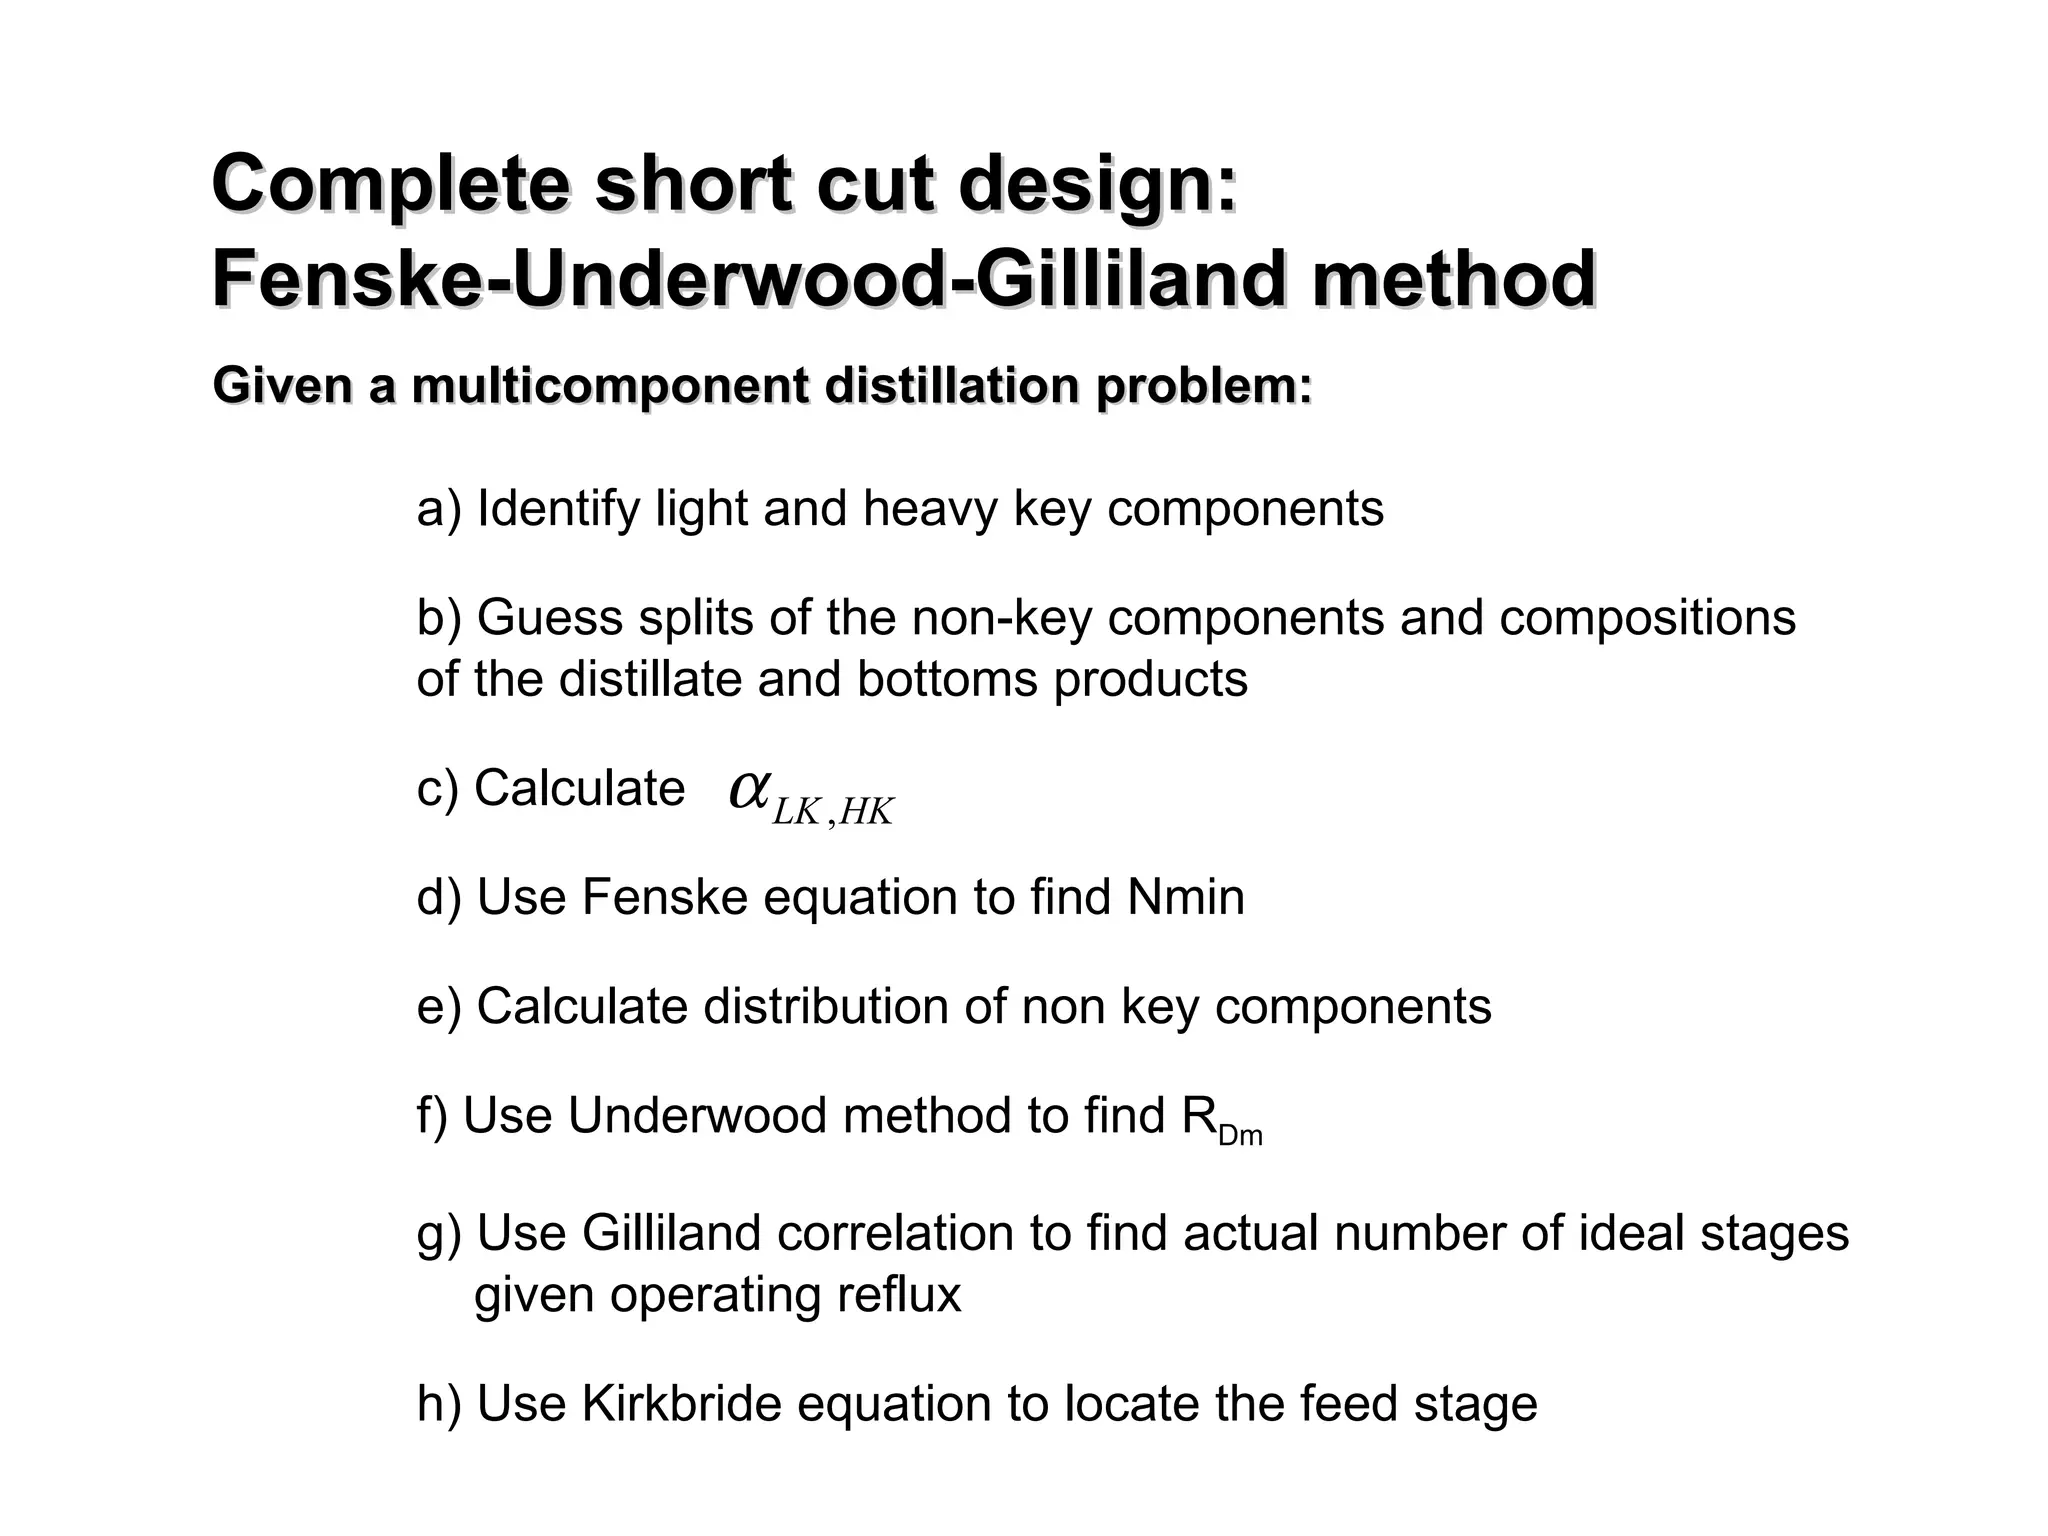
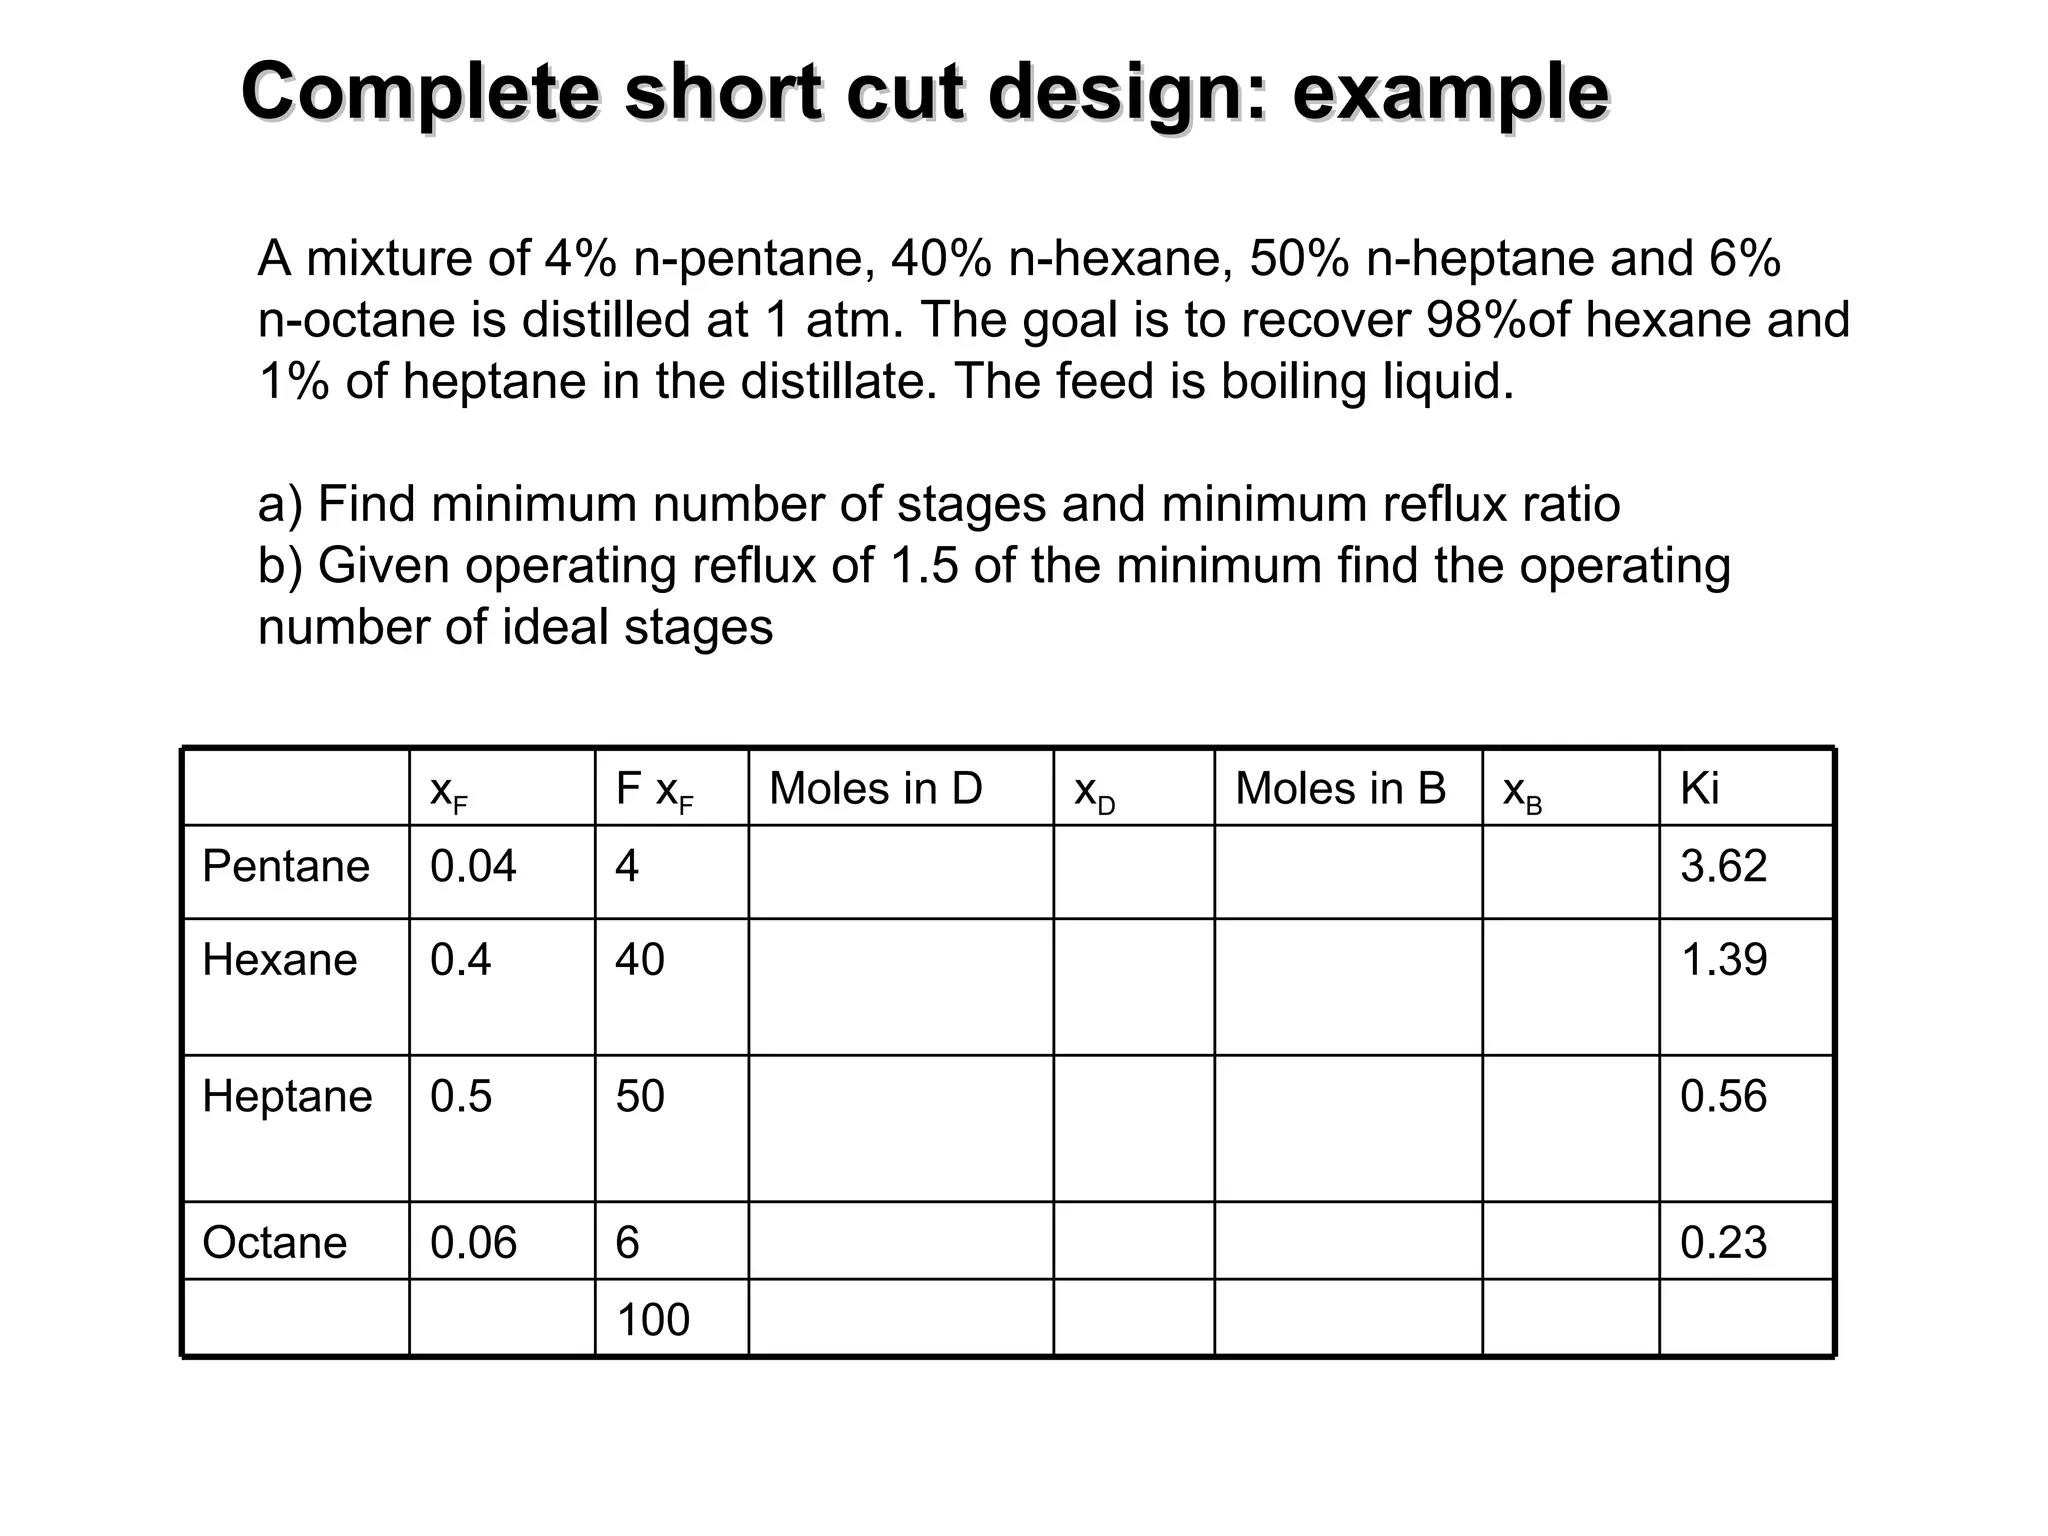
- Key components are chosen to indicate separation and are always distributed between products.
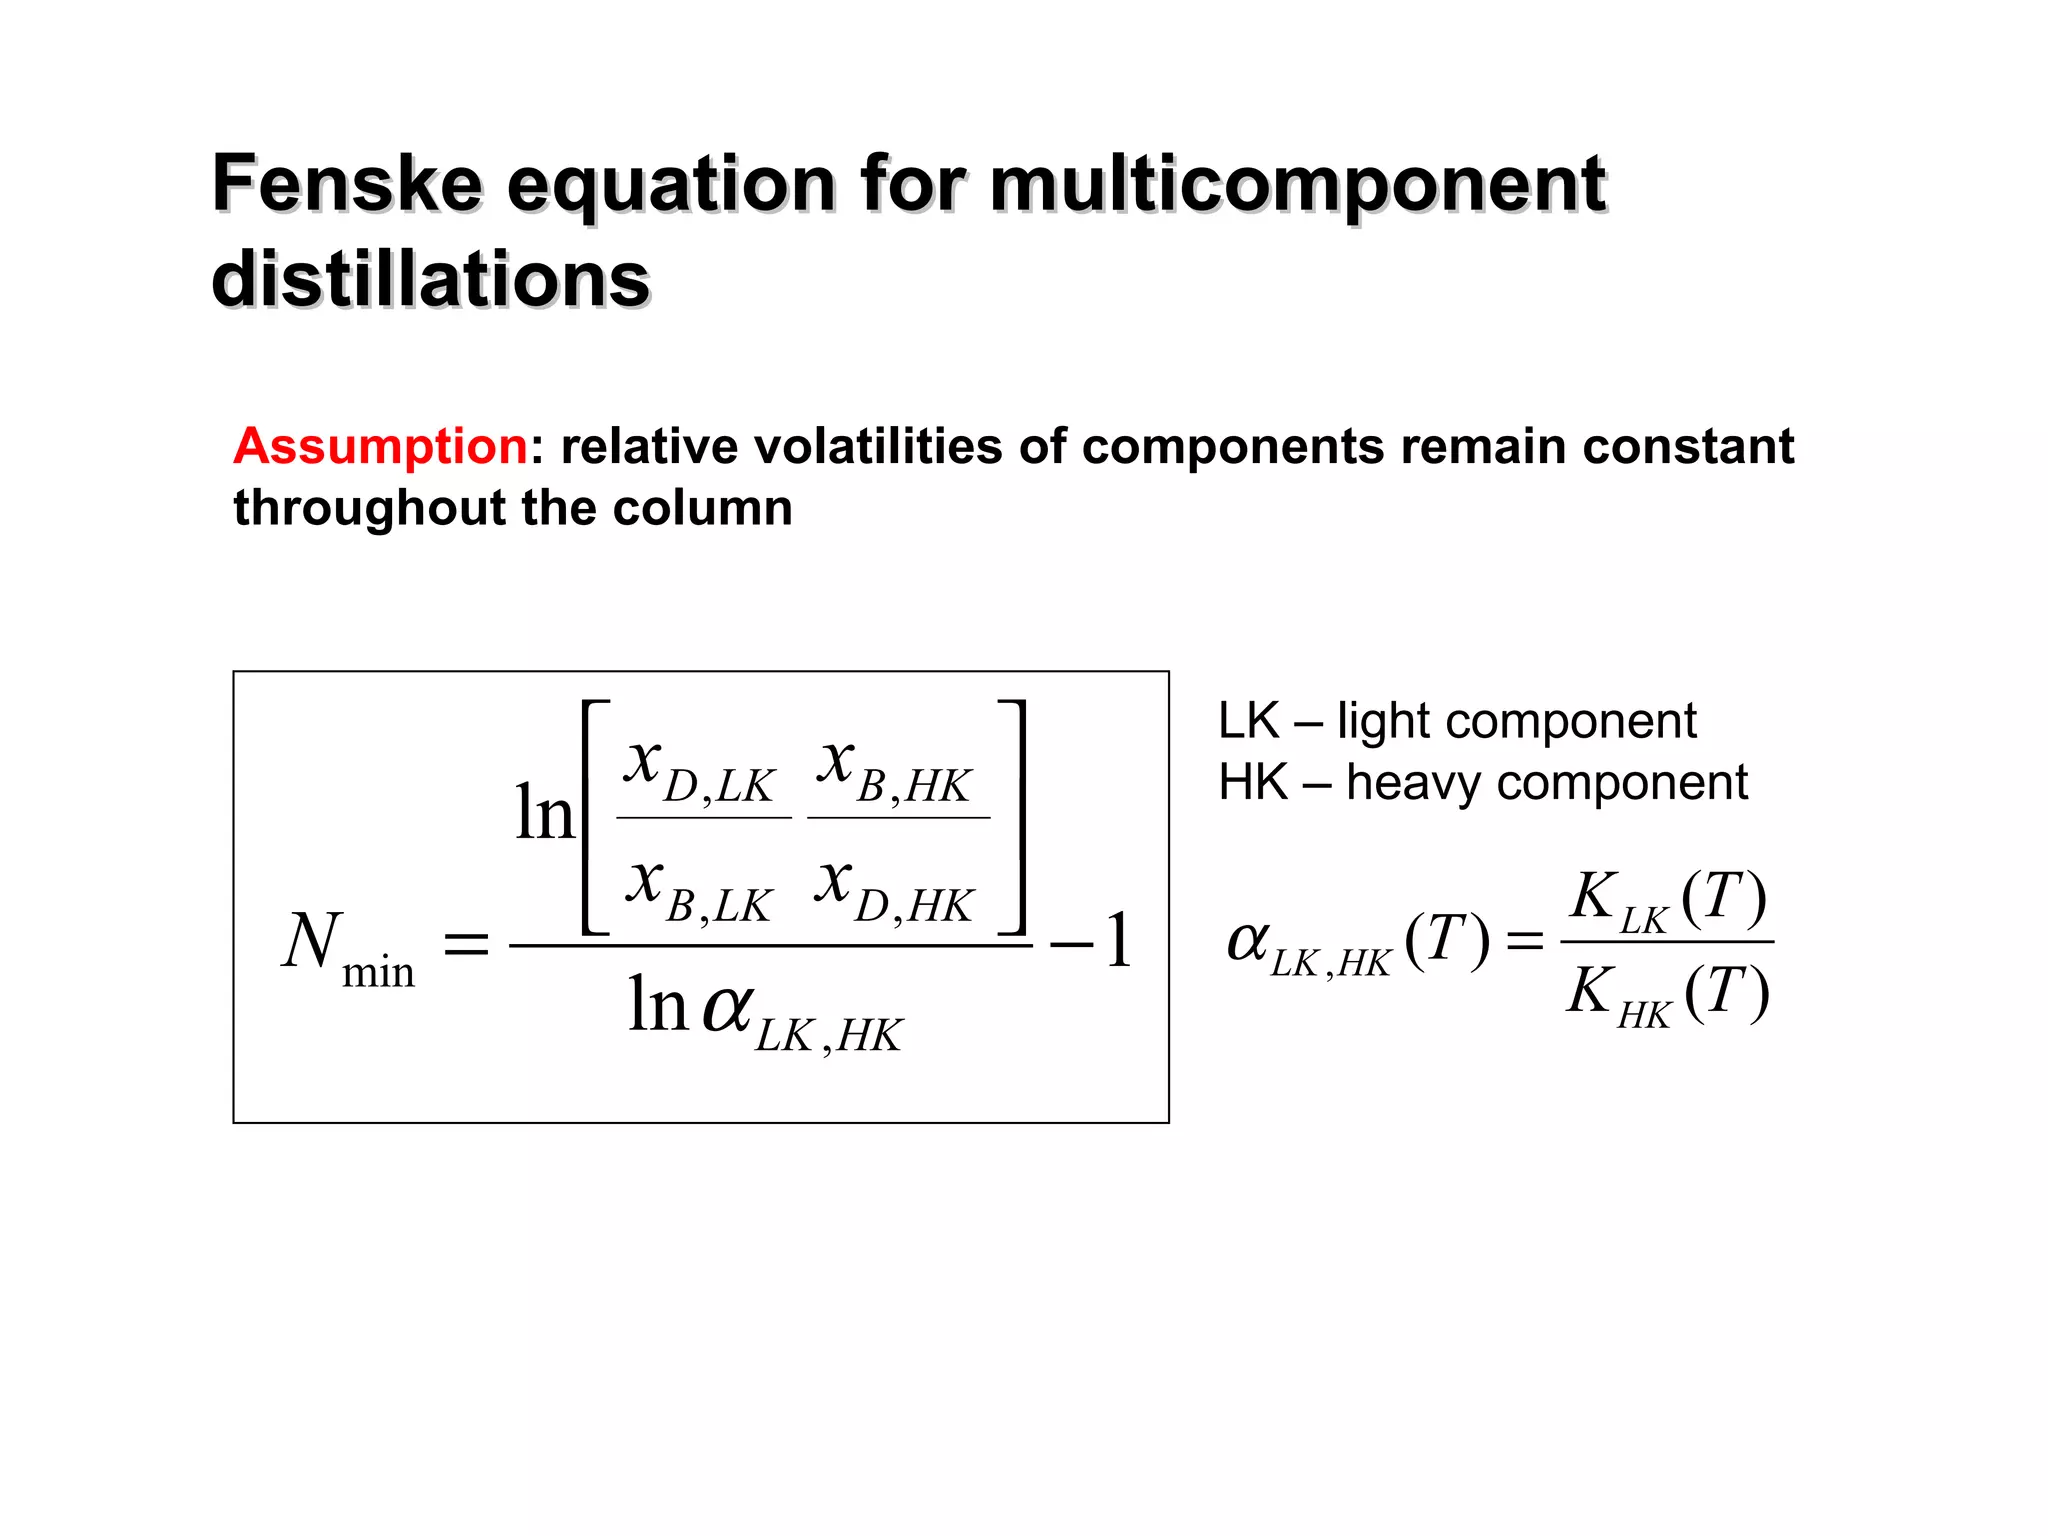
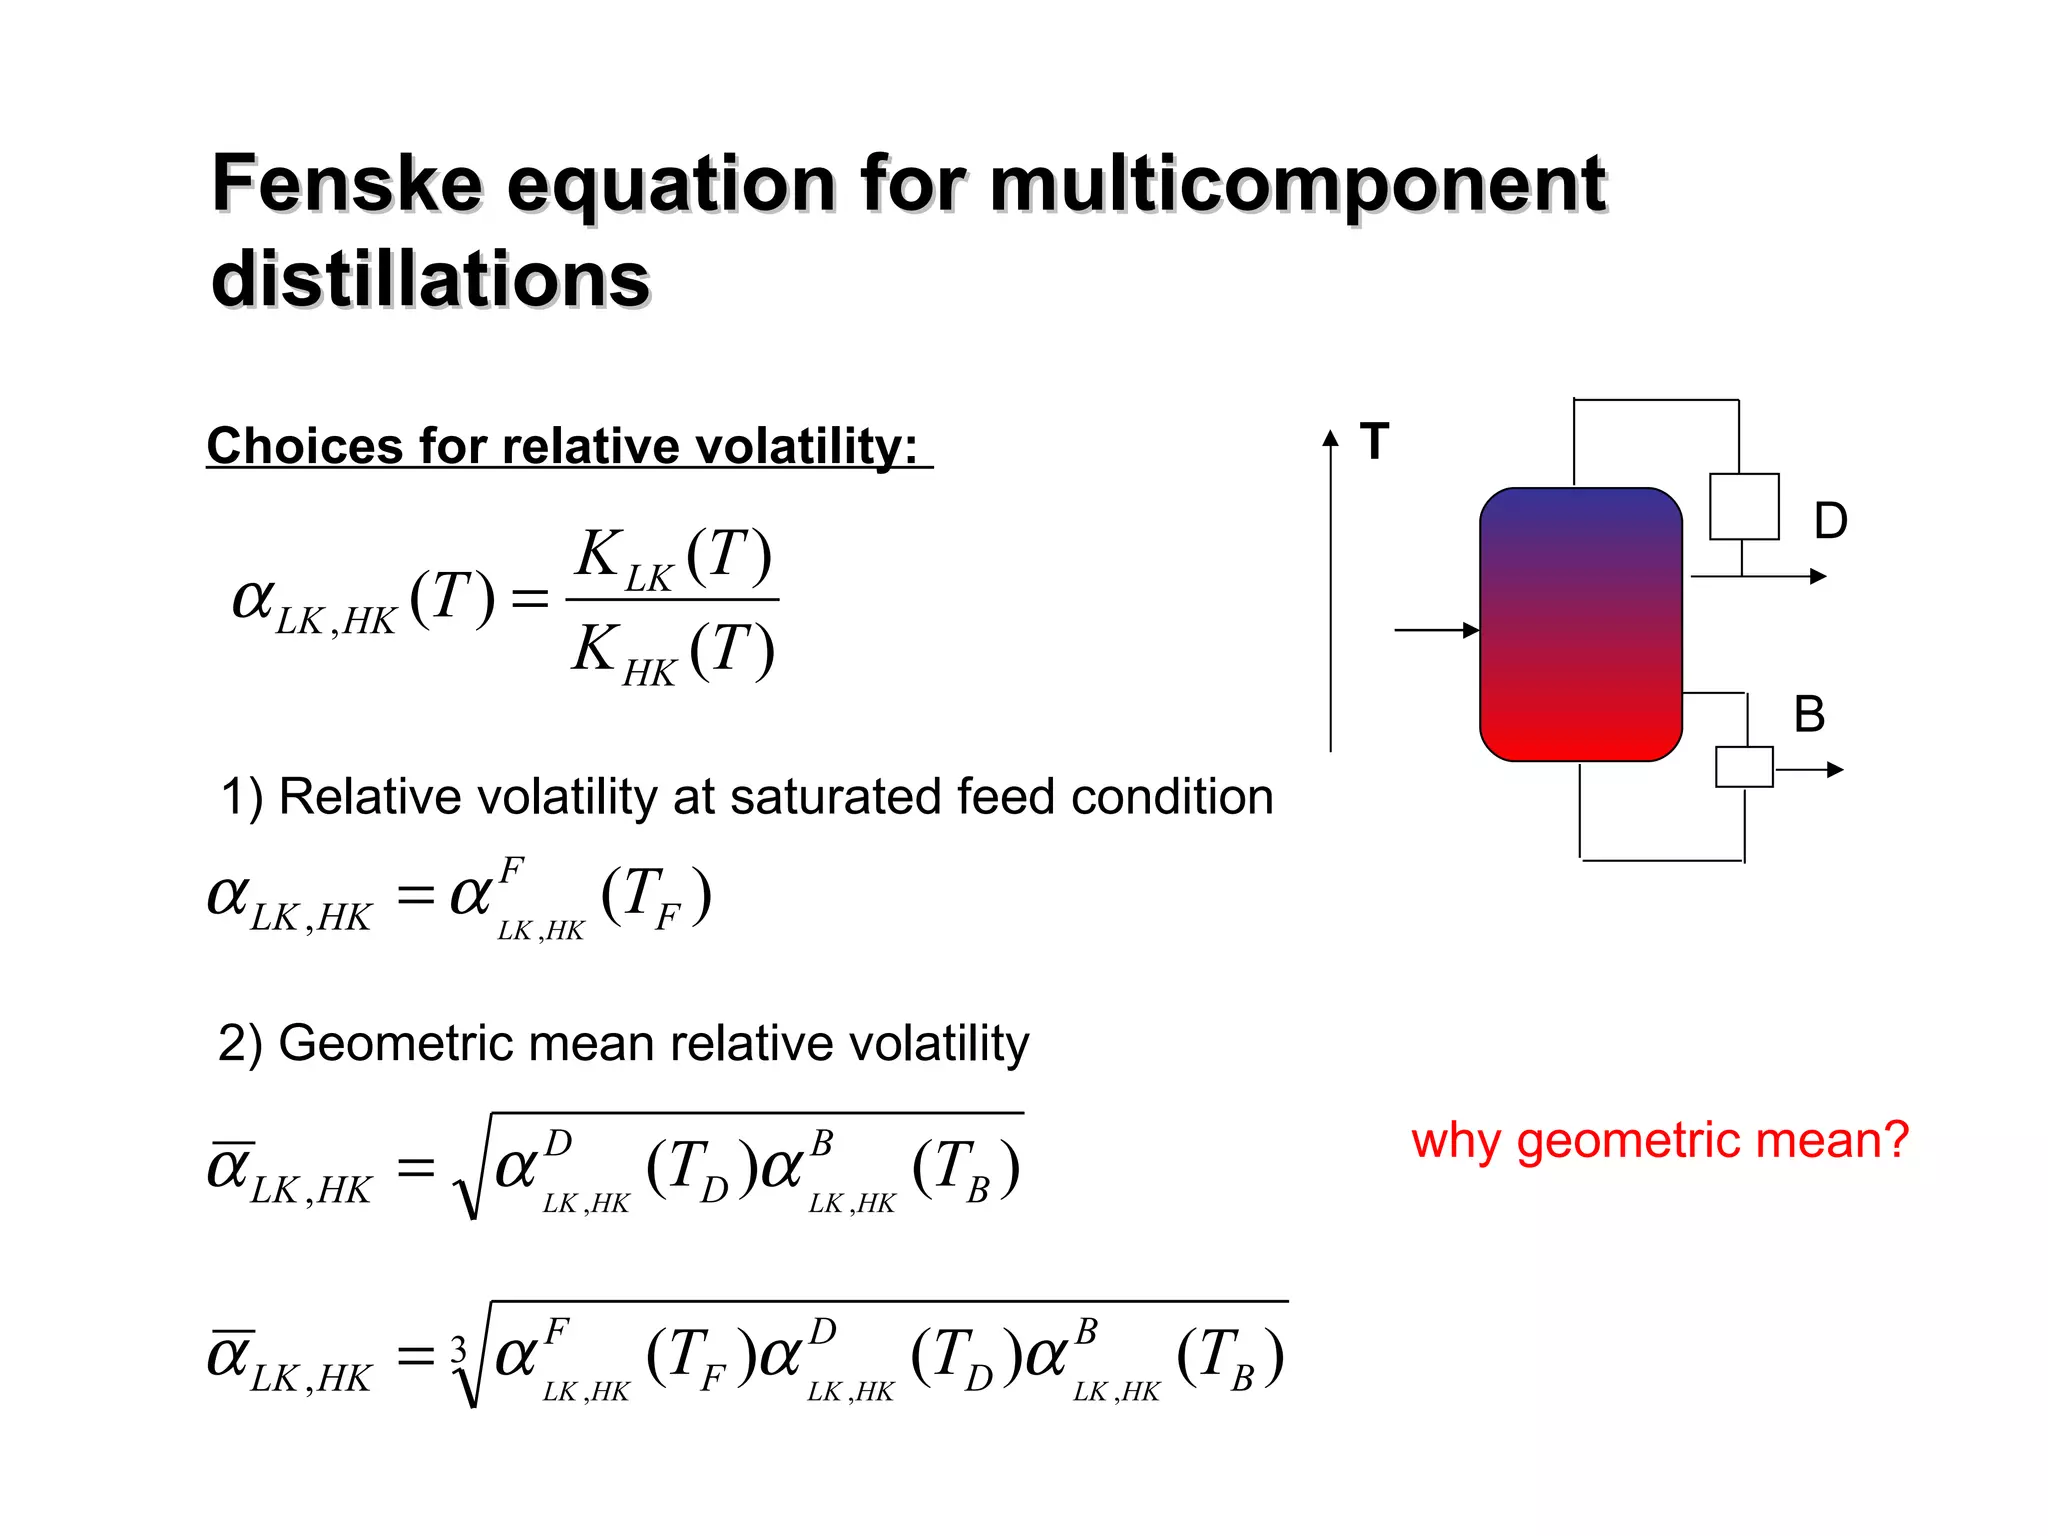
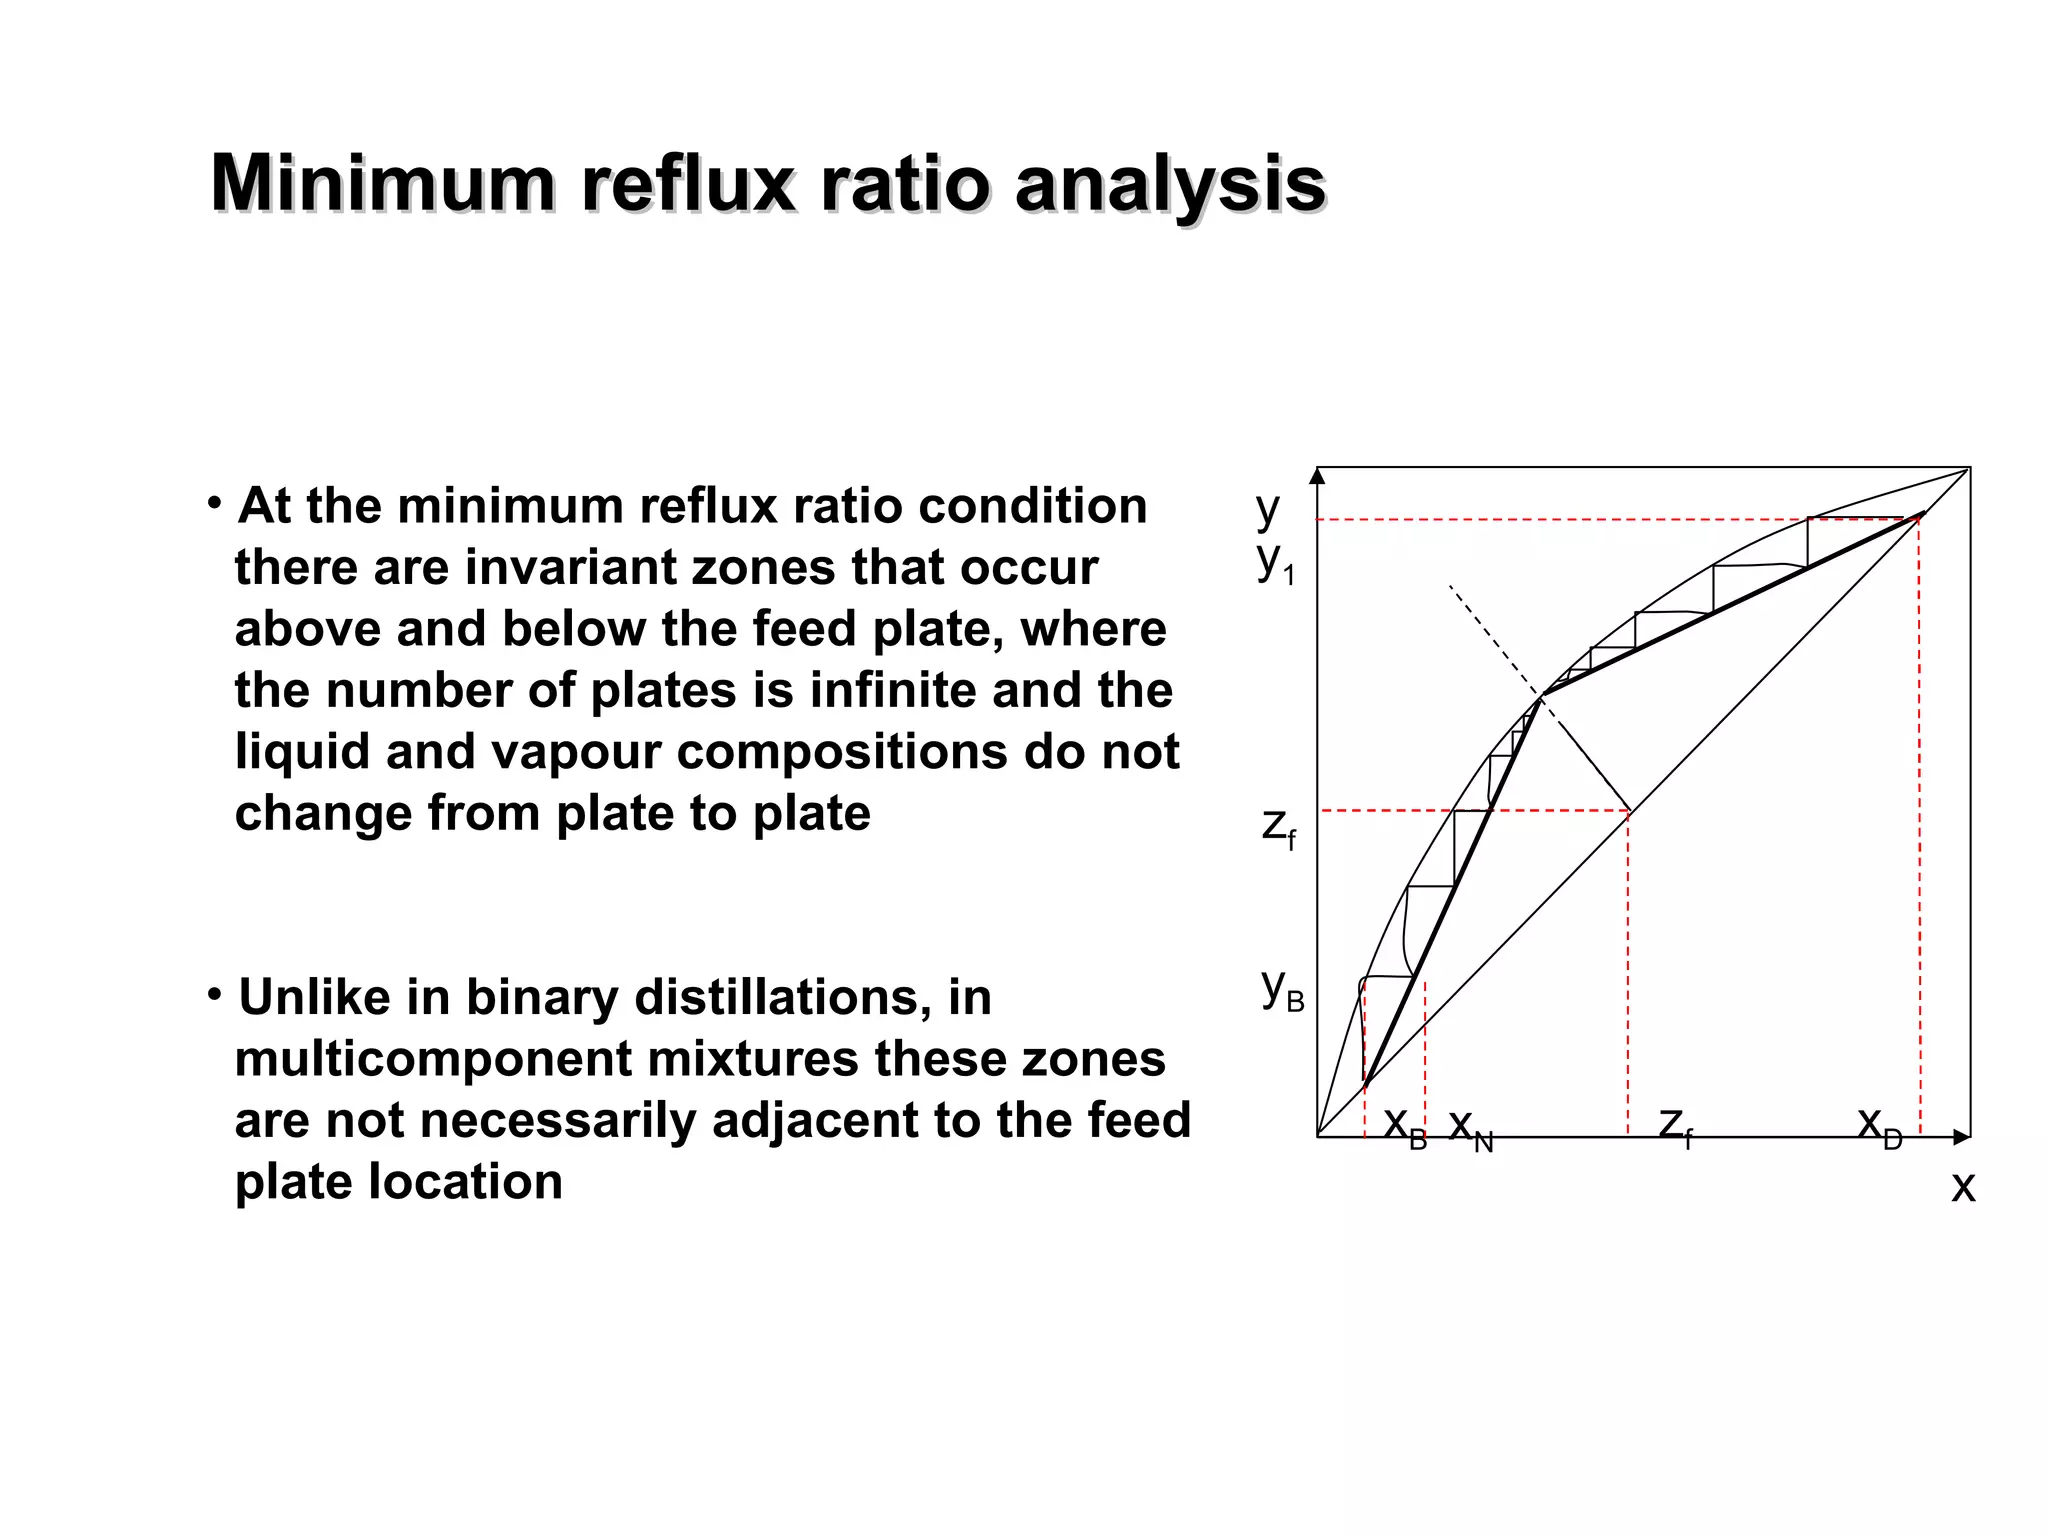
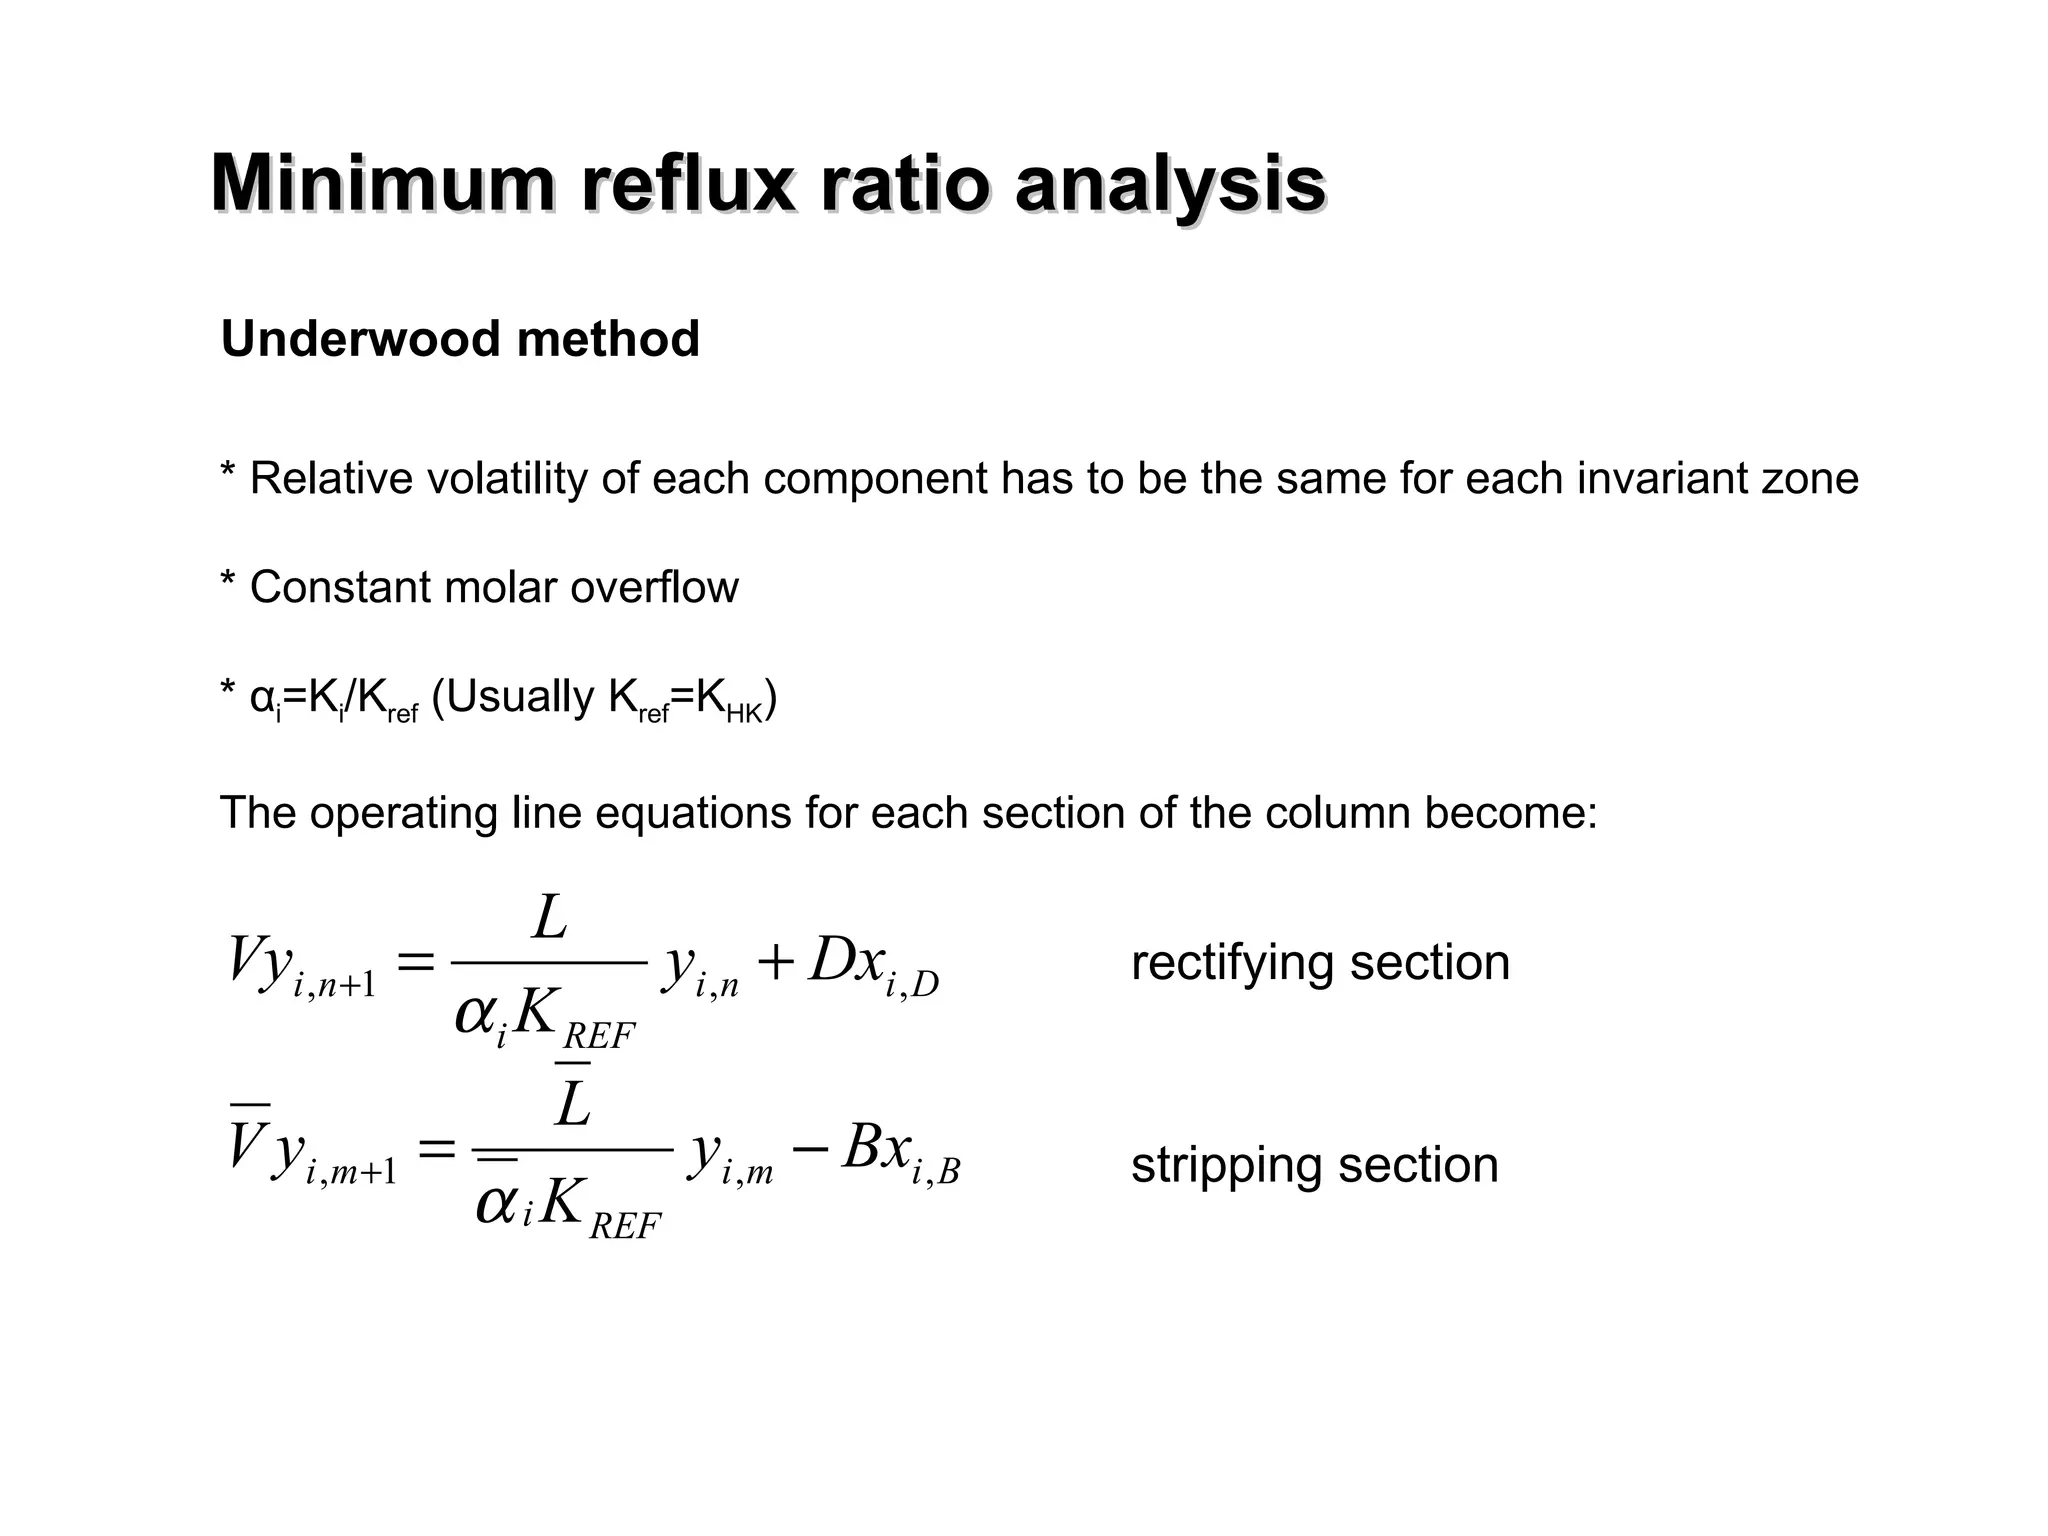
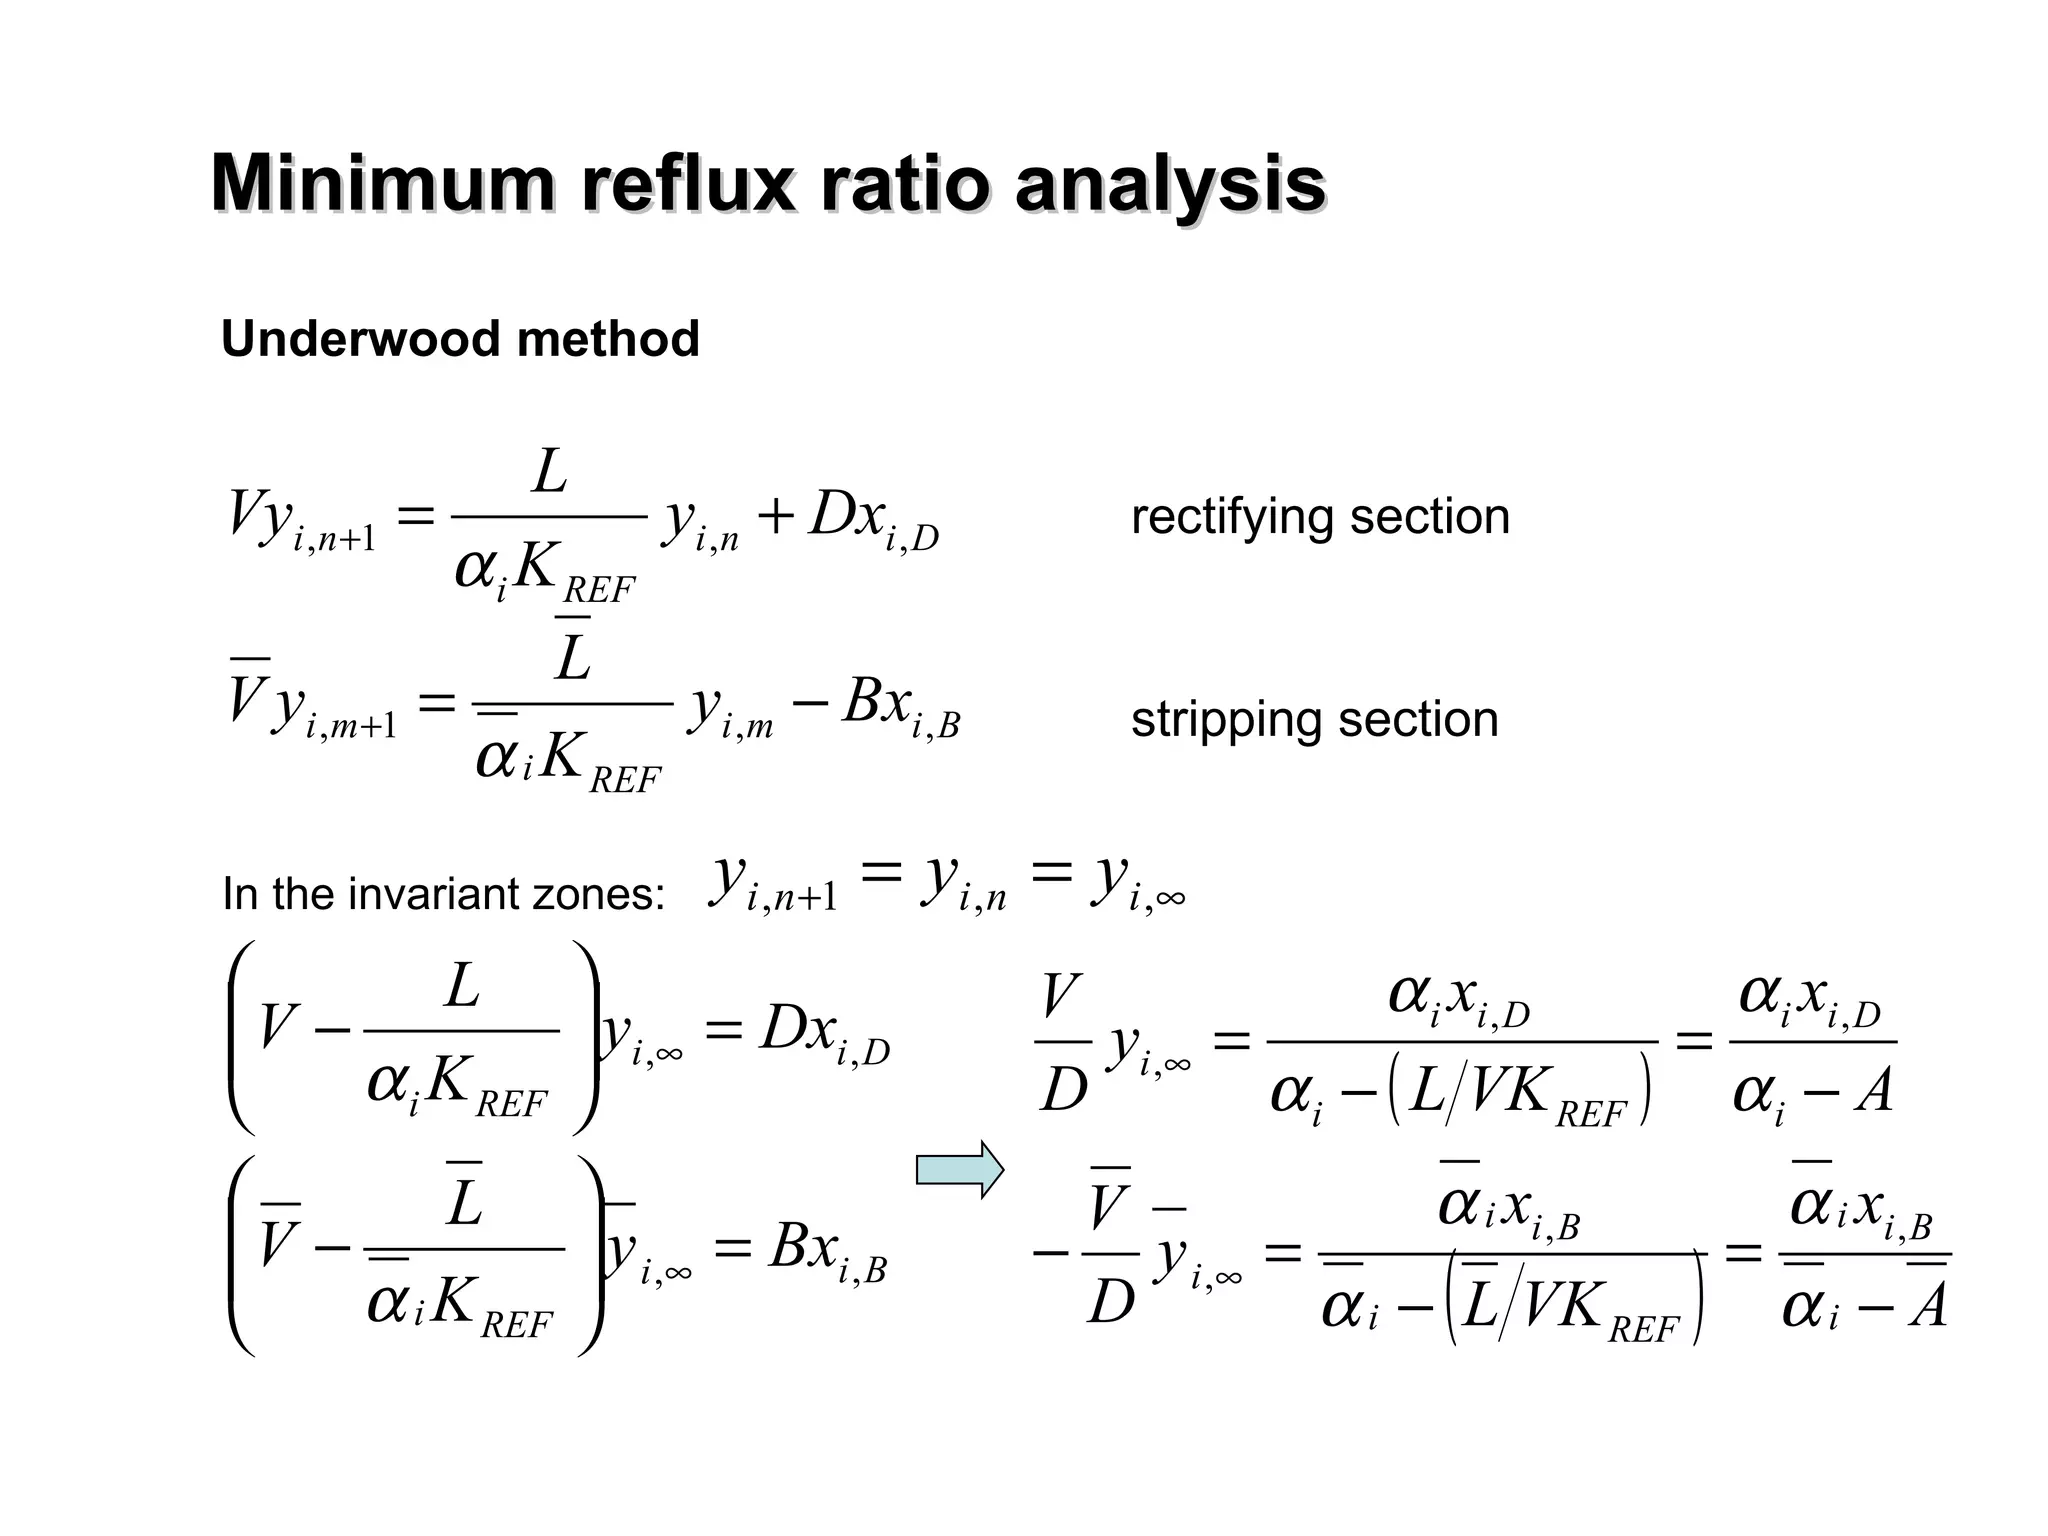
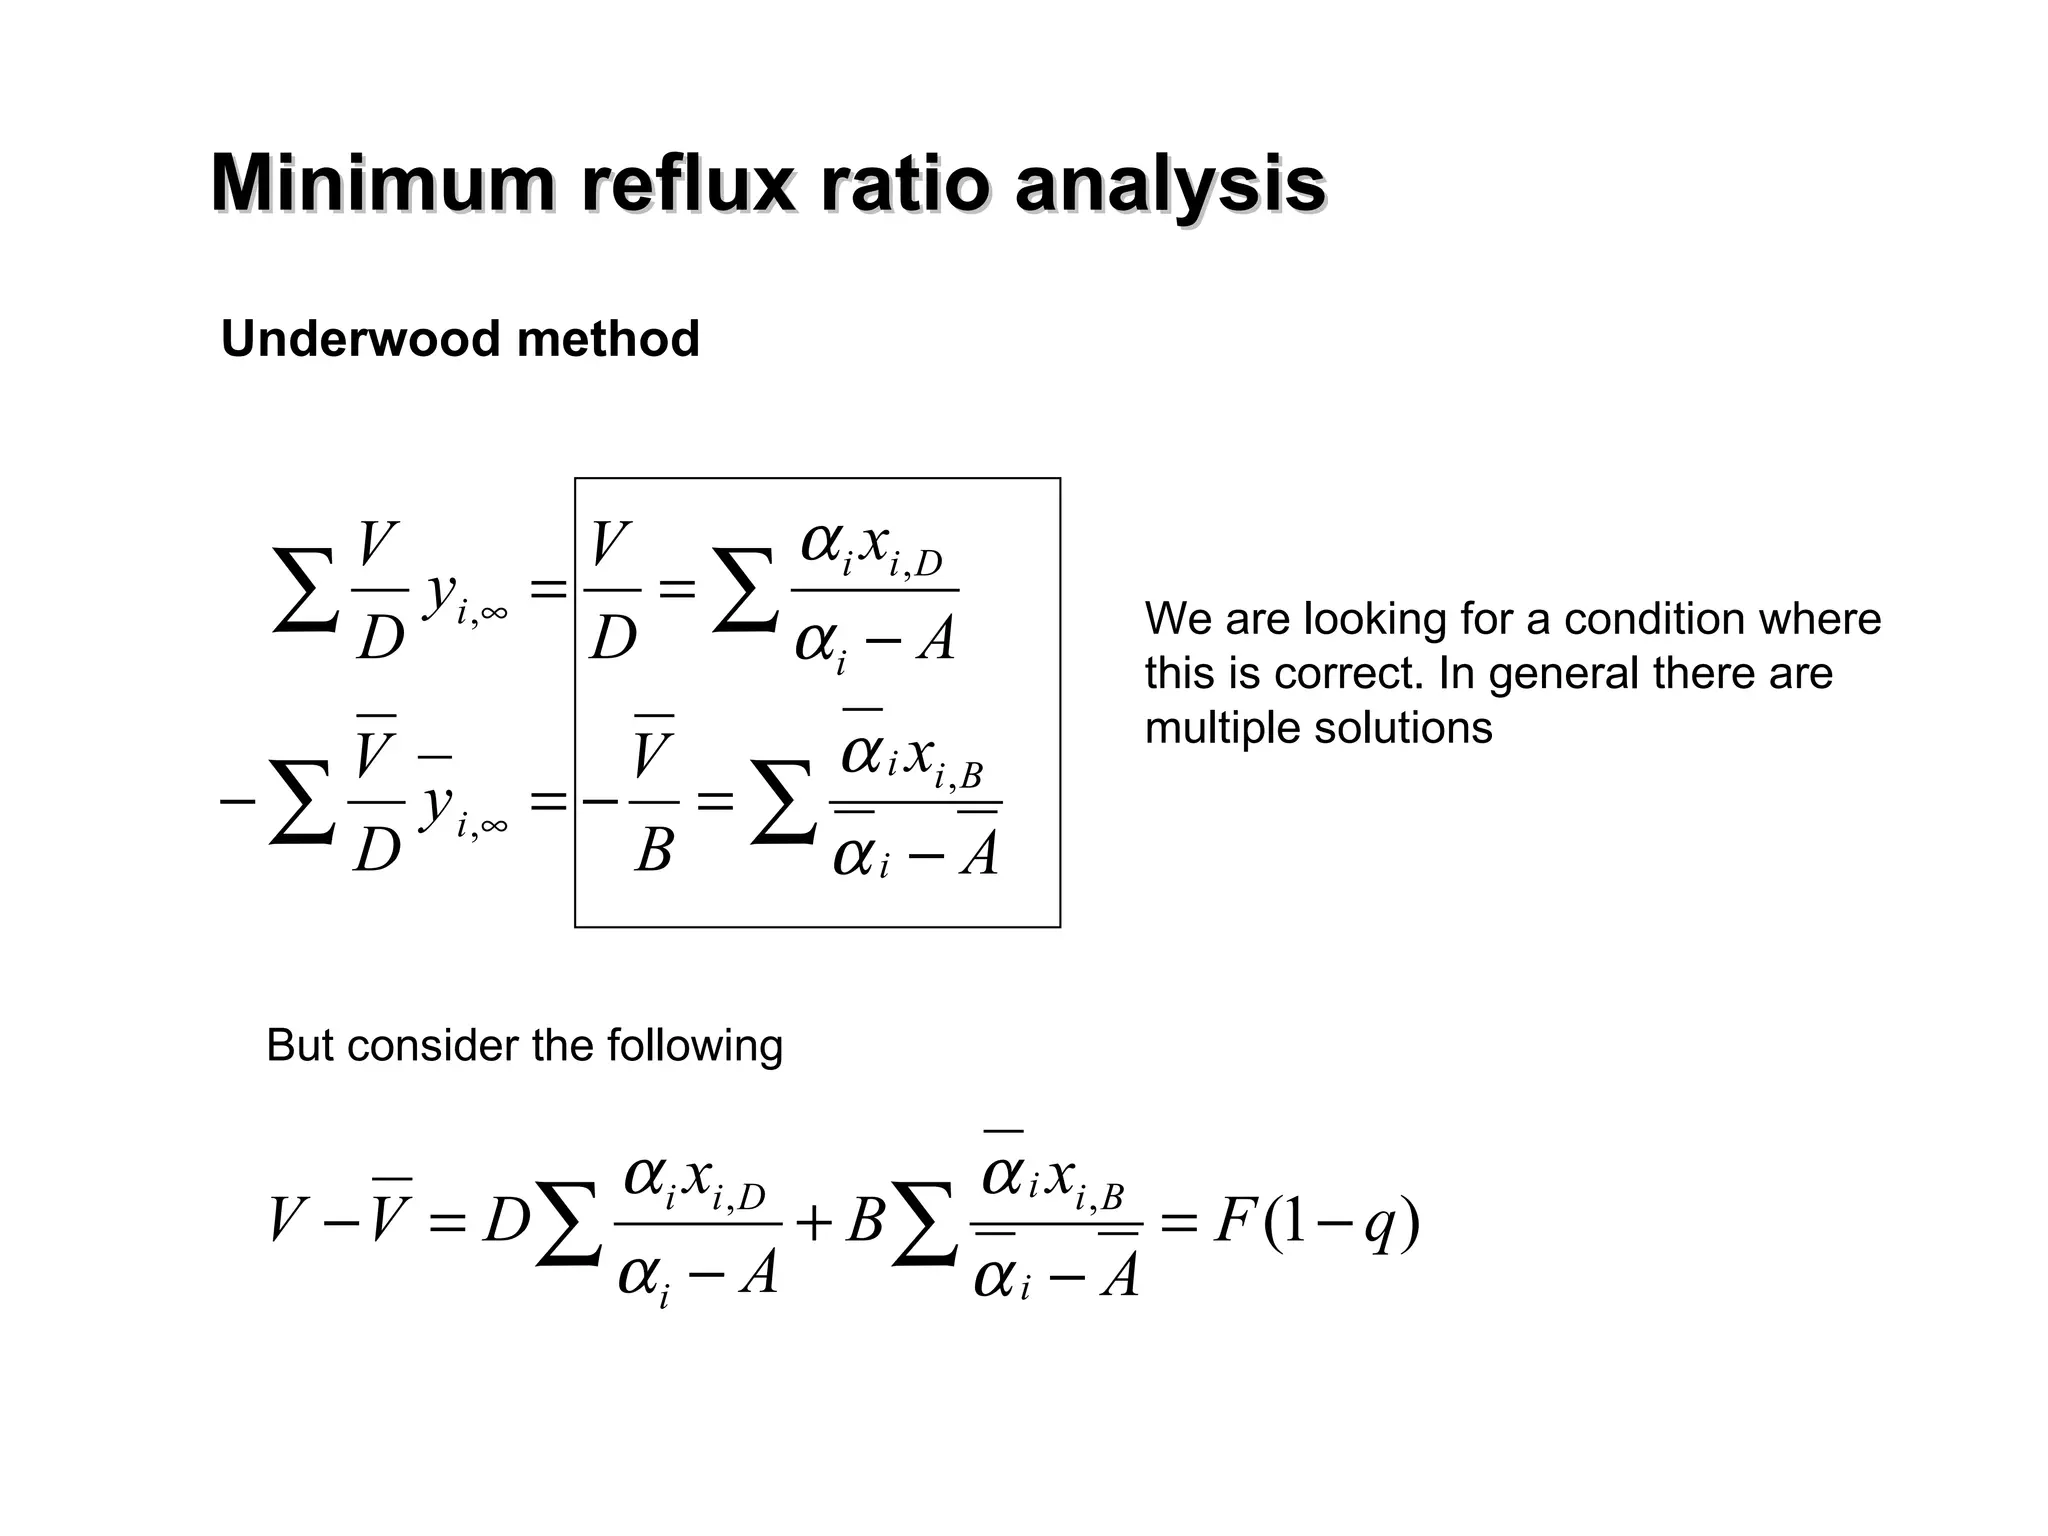
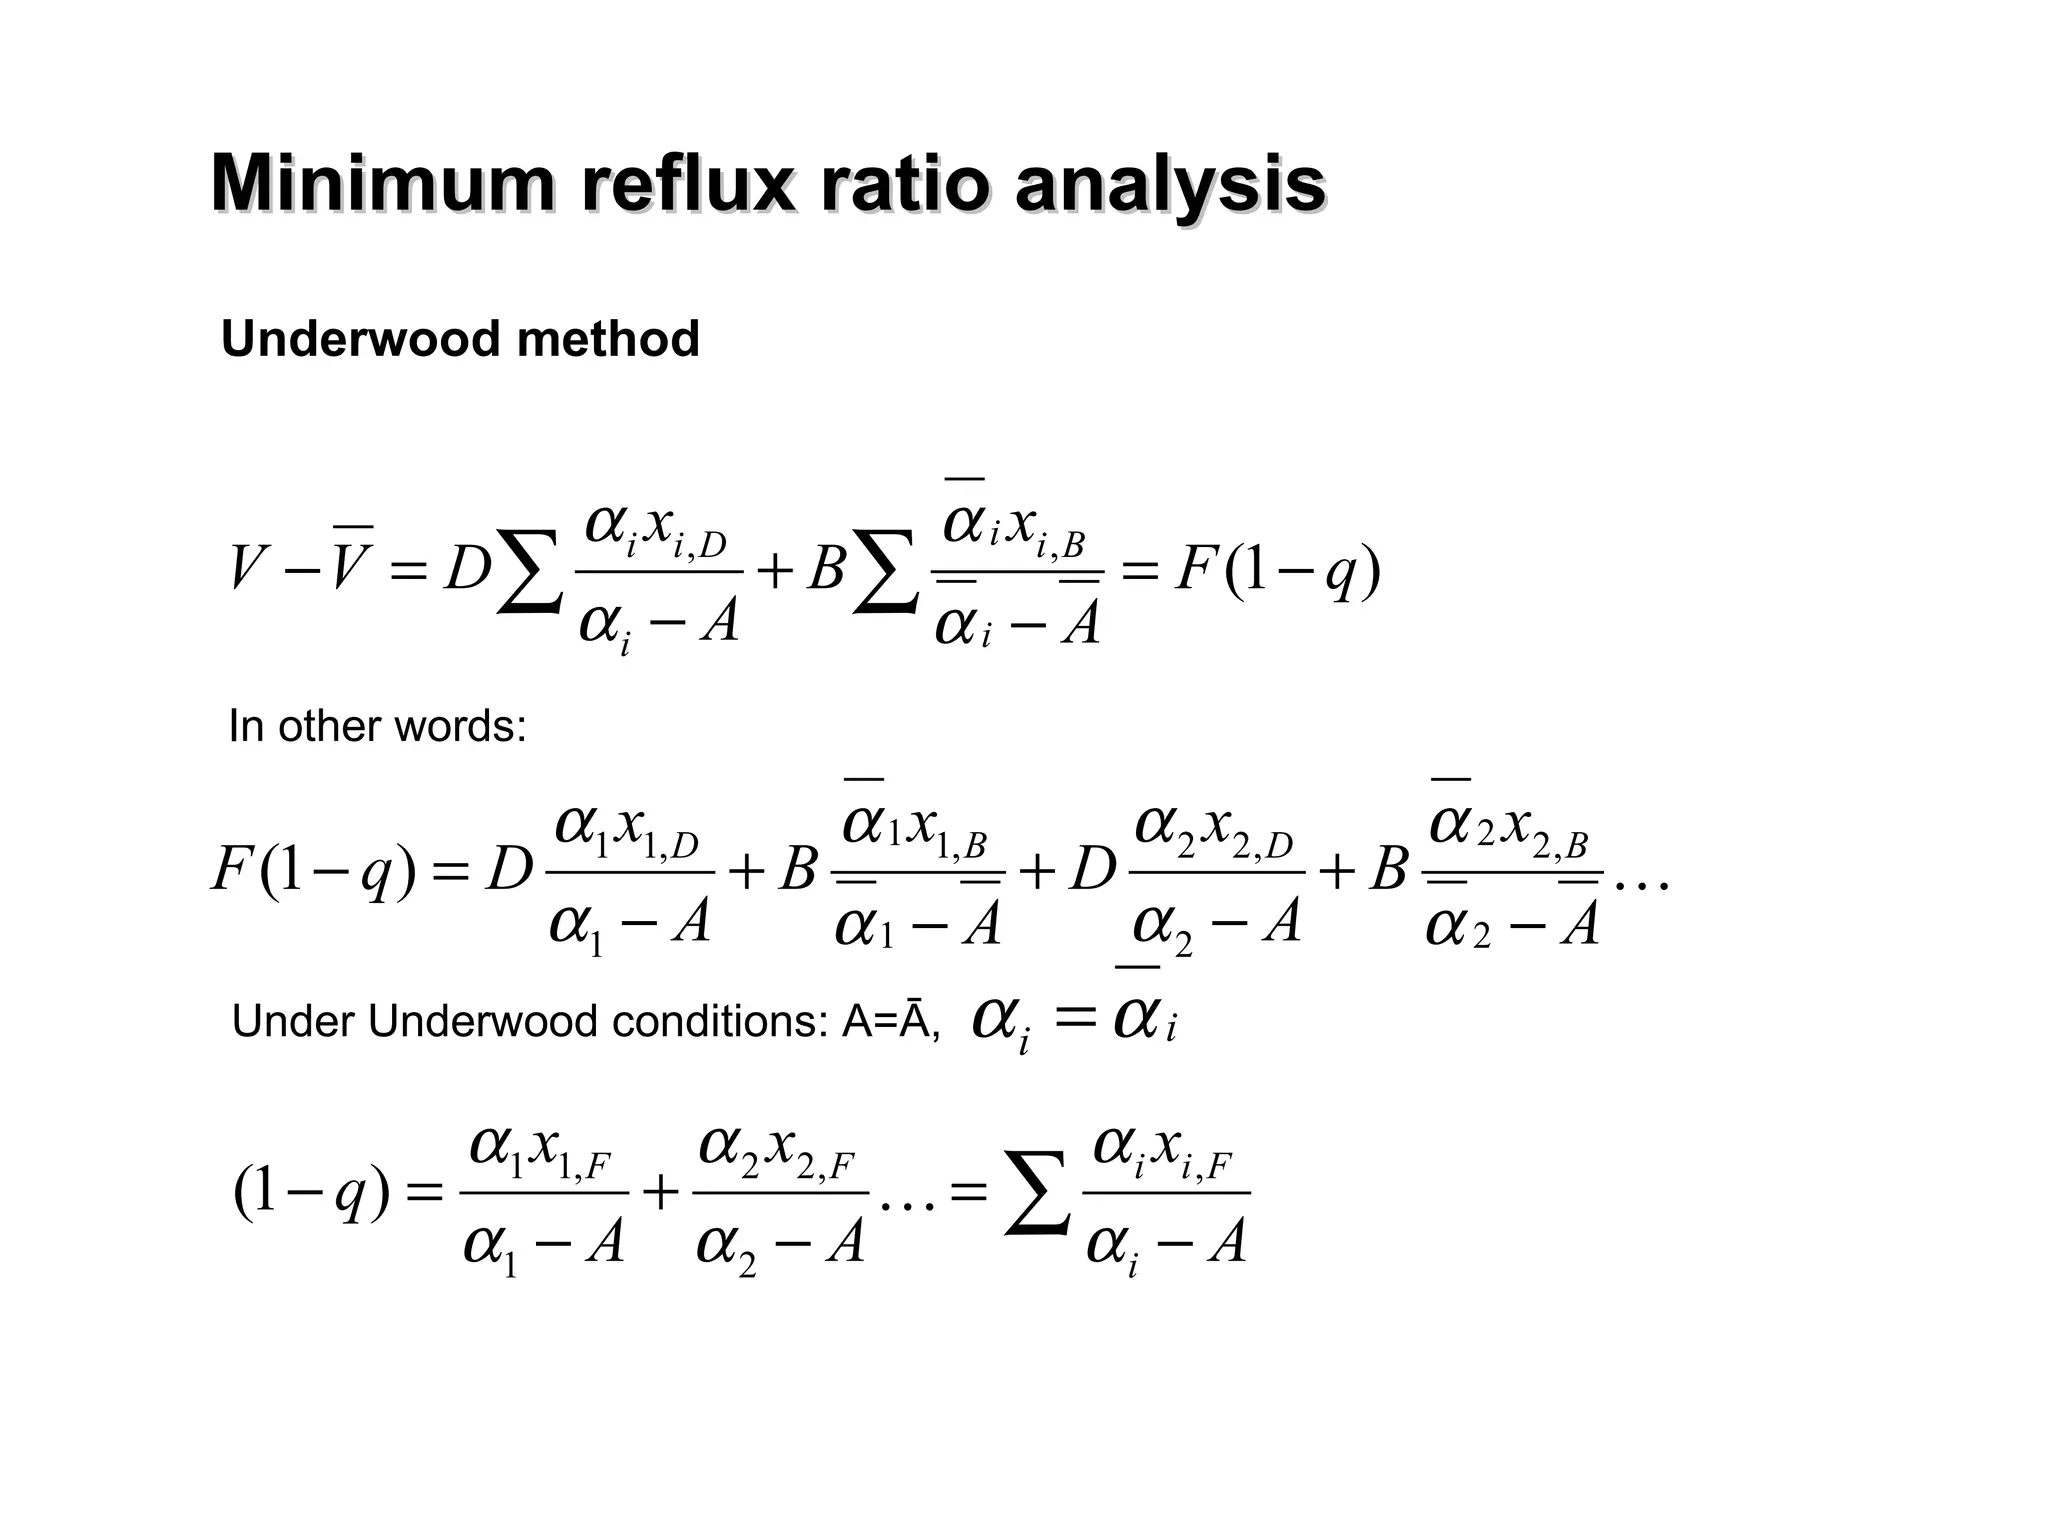
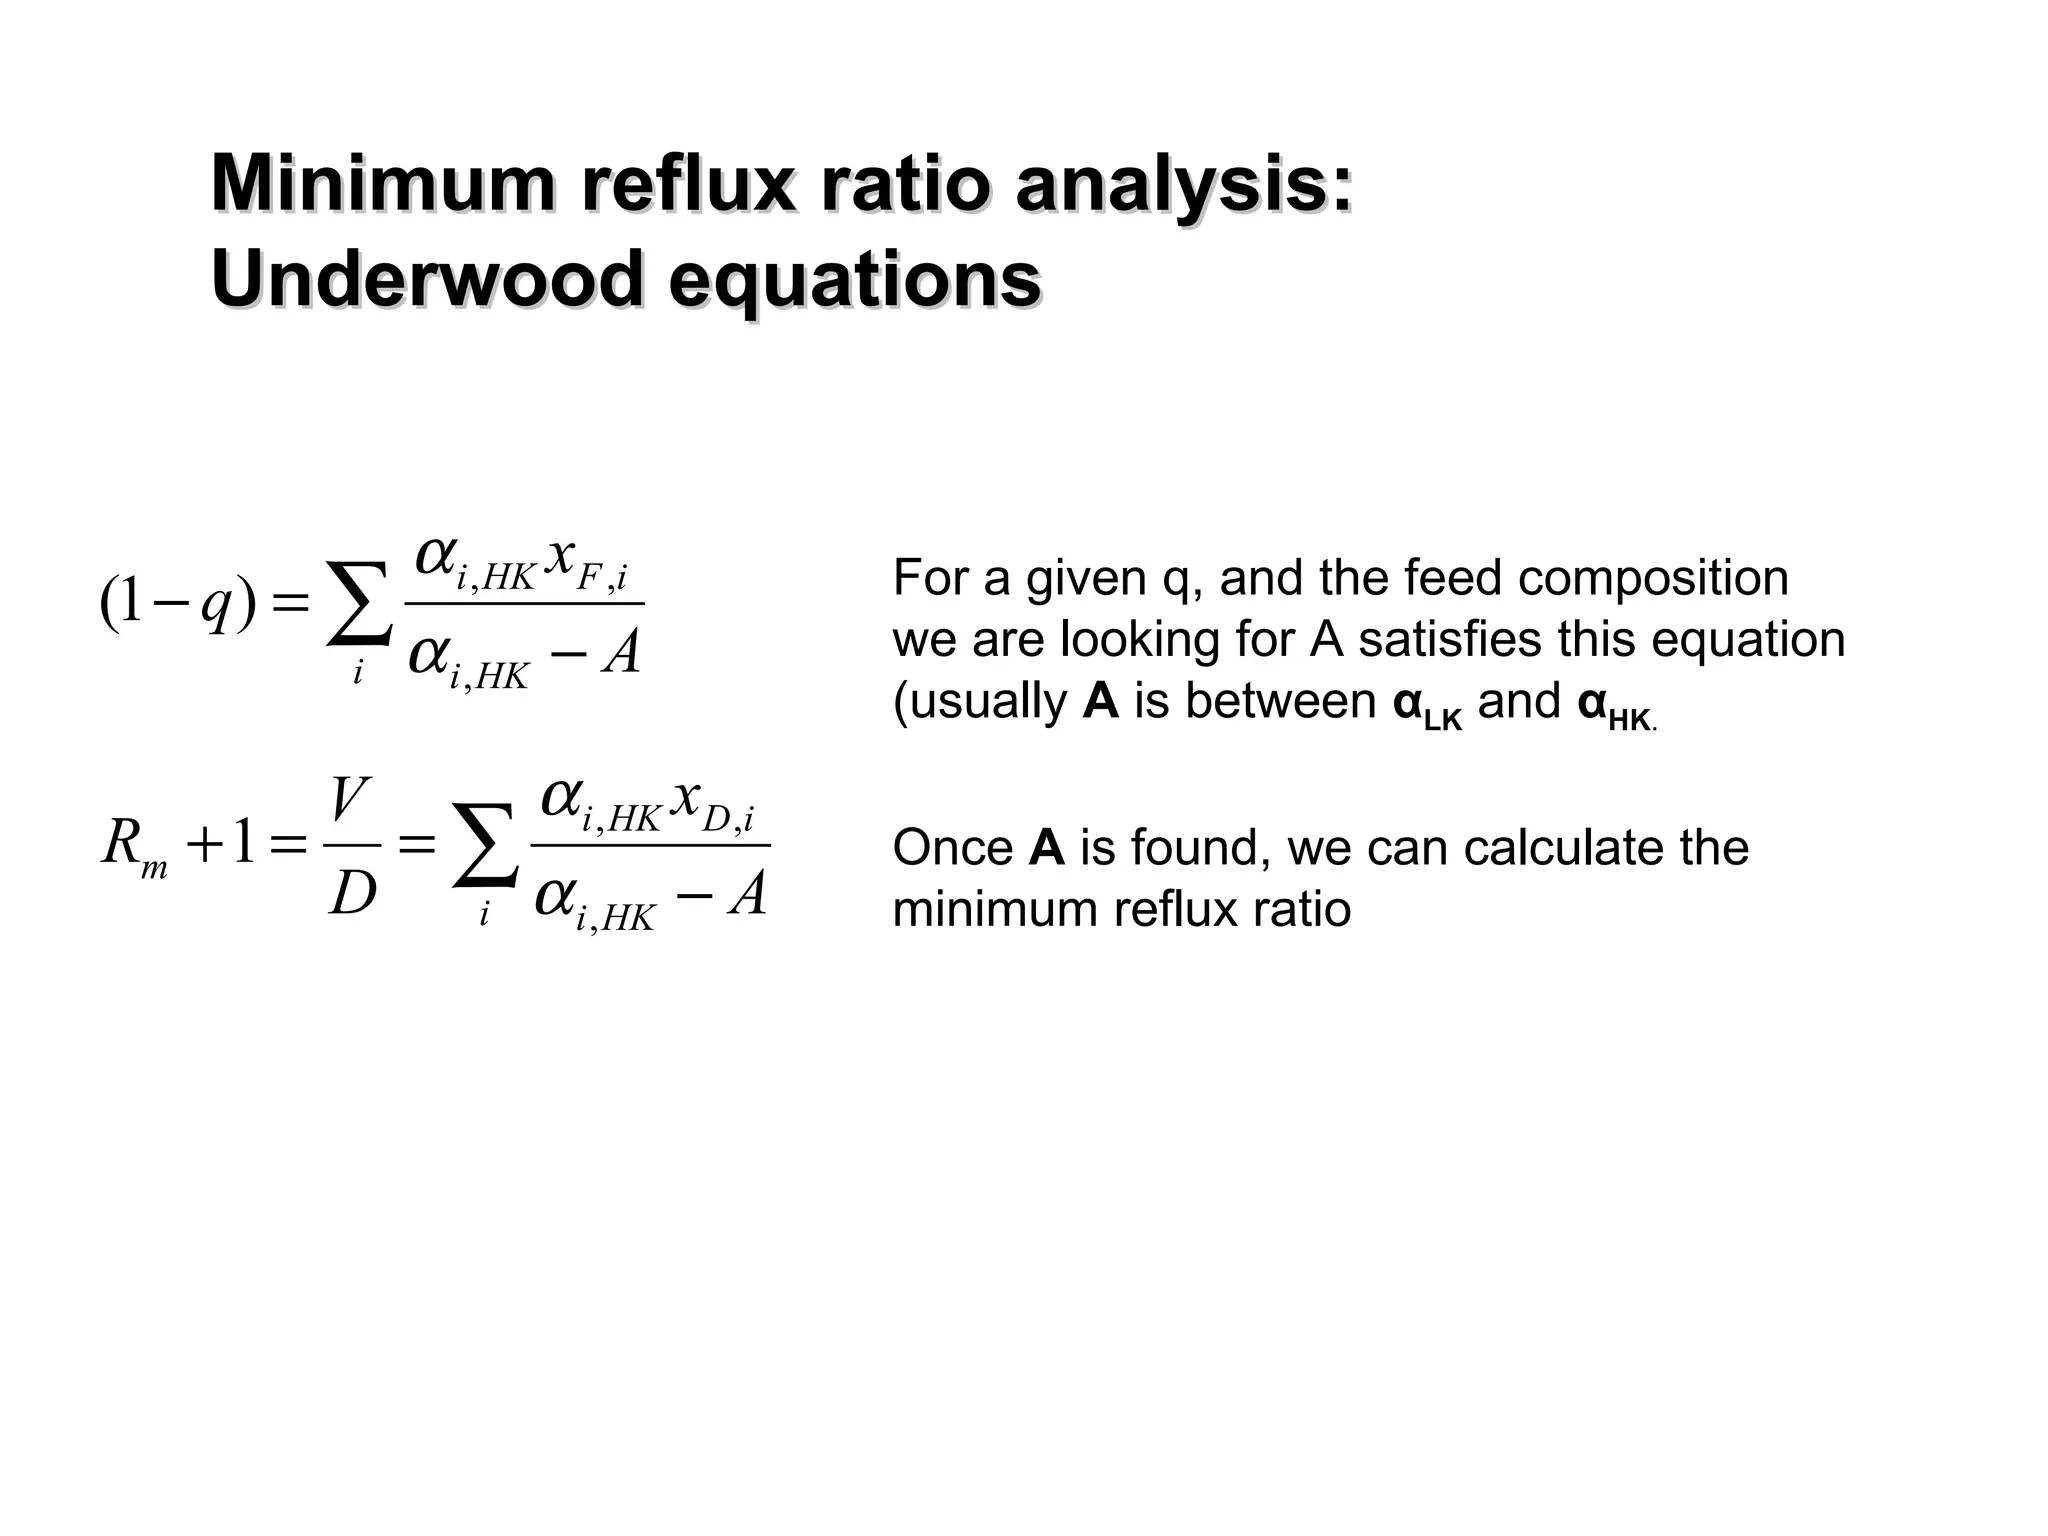
- The Fenske equation is used to determine minimum number of stages assuming constant relative volatility, while the Underwood method determines minimum reflux ratio.
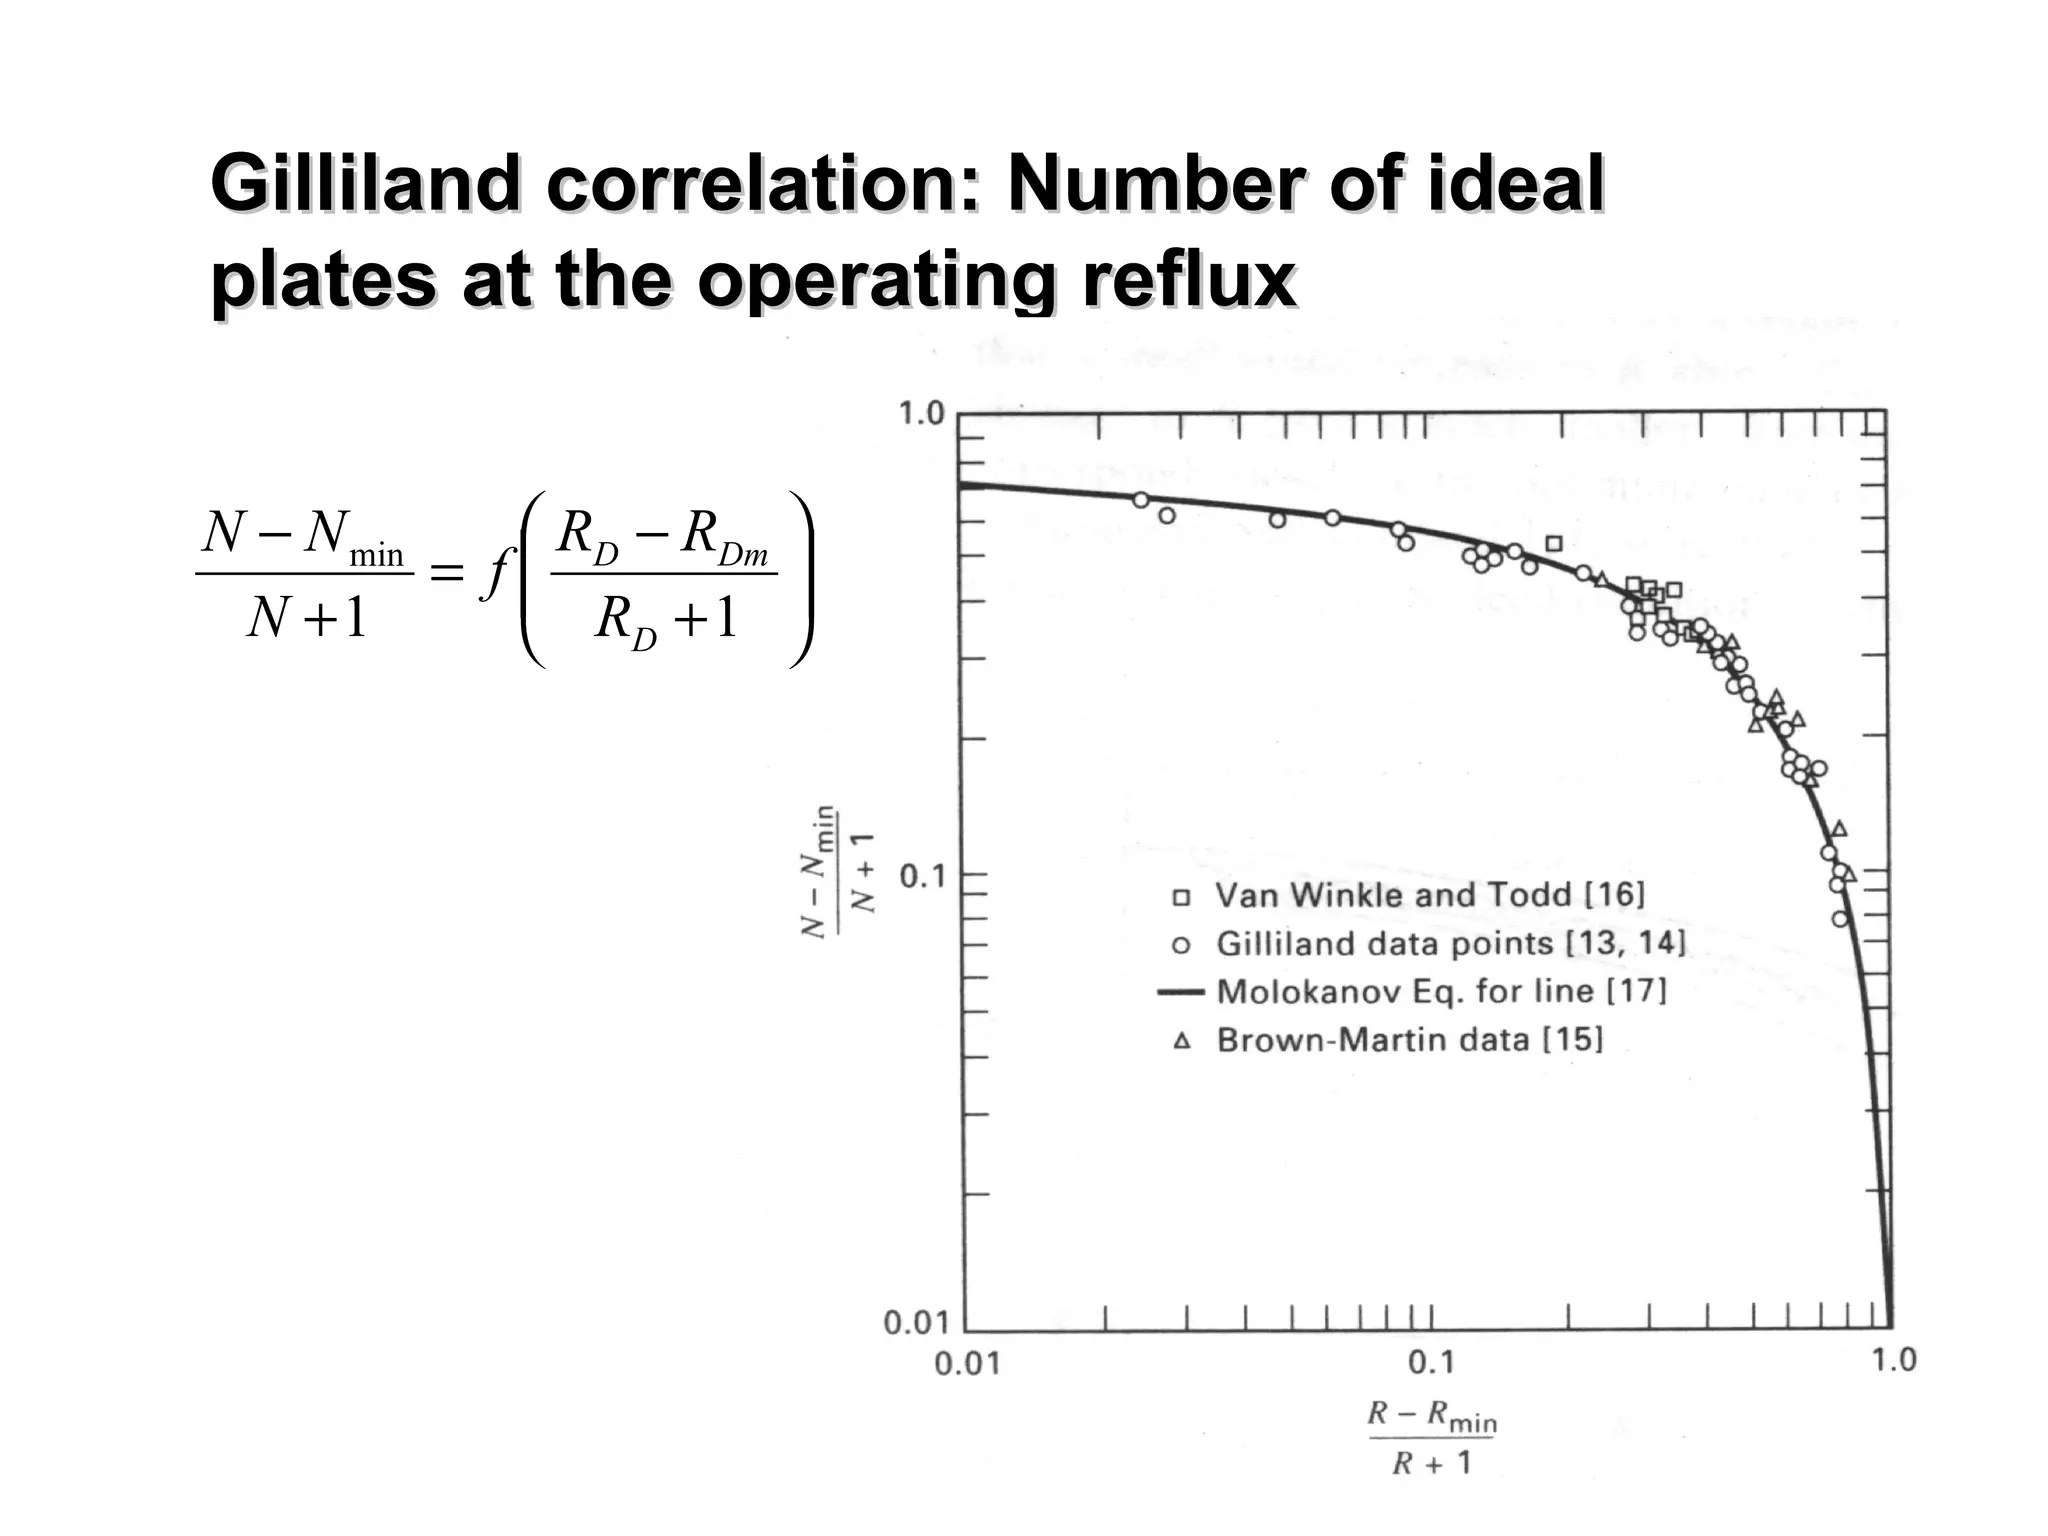
- The Gilliland correlation estimates actual number of stages given operating reflux from minimum values.