Development distribution
•Download as PPTX, PDF•
2 likes•2,425 views

Year 9 class on the uneven distribution of wealth

Recommended
More Related Content
What's hot
What's hot (20)
Viewers also liked
Similar to Development distribution
Similar to Development distribution (20)
More from Steven Heath
More from Steven Heath (20)
Recently uploaded
Recently uploaded (20)
Development distribution
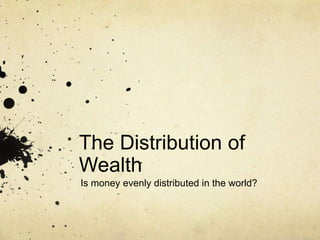
- 1. The Distribution of Wealth Is money evenly distributed in the world?
- 2. The Distribution of Wealth Key Questions: Where is wealth distributed? What is the development gap? What are HICs/MICs/LICs? Can I draw and interpret choropleth maps? So…which continents do you think have the most money? Try to rank them… Let’s see… http://www.rgs.org/webcasts/activities/wherebillionaires. html
- 3. We are what we eat… The following ten pictures are in descending order of the price paid (measured in US dollars) of a family of four’s food consumption for a week. Food as one of the basic staples of life is a good way of measuring the level and type of development that has been achieved around the world. Guess which country each
- 4. 1.
- 5. 2.
- 6. 3.
- 7. 4.
- 8. 5.
- 9. 6.
- 10. 7.
- 11. 8.
- 12. 9.
- 13. 10.
- 14. Source: ‘Hungry Planet: What the World Eats’ by Peter Menzel and Faith D’Aluisio (2005) 1. GERMANY - $500 2. USA (North Carolina) - $342 3. ITALY - $260 4. GREAT BRITAIN - $253 5. MEXICO - $189 6. CHINA - $155 7. EGYPT - $68 8. ECUADOR - $31 9. BHUTAN - $5 10. REFUGEE CAMP Sudanese living in Chad - $1.23
- 15. So where do billionaires live… Look at your table – how are you going to calculate the last column for each region? Copy out the table.Region Population (millions) Billionaires total Billionaires per 100 million population Africa 933 5 Asia 3700 142 Australia & New Zealand 25 13 Europe 810 265 Latin America 556 36 Middle East 193 193 North America 334 441
- 16. Create a choropleth map showing wealth distribution 1. Add a title to your world map 2. Add a key for your map – Colour each category and then the right regions 3. Describe the pattern of distribution 4. Suggest reasons for this distribution
- 18. So what is the ‘development gap’? In 1981, the West German Chancellor Brandt produced a landmark report on uneven global development This became known as the north-south divide….divided by the ‘Brandt line’
- 19. North-South Divide Brandt Commission in 1981 TASK: With help from a world map, name 5 countries north of the Brandt line and 5 south of it
- 20. Does the Brandt line still apply today? TASK: Using your map, try drawing your own Brandt line dividing MEDCs to LEDCs Discuss: What’s changed today? Which countries have become more developed and why?!