Download to read offline
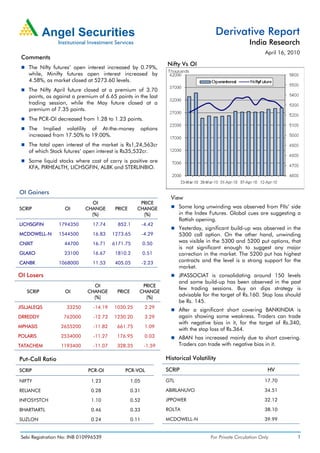

The derivative report summarizes developments in the Indian derivatives market on April 16, 2010. Open interest in Nifty futures increased slightly by 0.79% while open interest in Mini Nifty futures rose more at 4.58%. The report also notes increases and decreases in open interest for various individual stocks and changes in metrics like the put-call ratio. It provides commentary on expected market movements and recommends trading strategies for particular stocks.


