Angel switch 170510
•
0 likes•135 views

The document recommends switching investment from R-Power to Reliance Infrastructure and from National Aluminum to Hindalco due to their stronger growth prospects and more attractive valuations. It also recommends buying SBI and reducing position in PNB as SBI is gaining market share while PNB is losing share, and SBI's earnings quality and valuations are superior.

Recommended
More Related Content
What's hot
What's hot (11)
Viewers also liked
Viewers also liked (20)
Similar to Angel switch 170510
Similar to Angel switch 170510 (20)
More from Angel Broking
More from Angel Broking (20)
Angel switch 170510
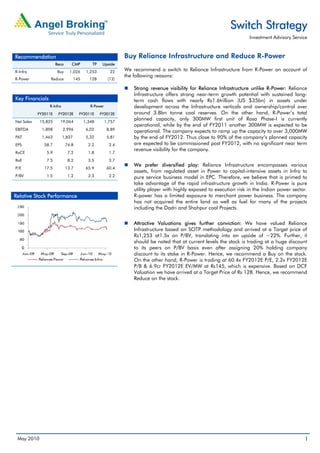
- 1. Switch Strategy Investment Advisory Service Recommendation Buy Reliance Infrastructure and Reduce R-Power Reco CMP TP Upside R-Infra Buy 1,026 1,253 22 We recommend a switch to Reliance Infrastructure from R-Power on account of the following reasons: R-Power Reduce 145 128 (12) Strong revenue visibility for Reliance Infrastructure unlike R-Power: Reliance Infrastructure offers strong near-term growth potential with sustained long- Key Financials term cash flows with nearly Rs1.6trillion (US $35bn) in assets under R-Infra R-Power development across the Infrastructure verticals and ownership/control over FY2011E FY2012E FY2011E FY2012E around 3.8bn tonne coal reserves. On the other hand, R-Power’s total Net Sales 15,825 19,064 1,348 1,757 planned capacity, only 300MW first unit of Rosa Phase-I is currently operational, while by the end of FY2011 another 300MW is expected to be EBITDA 1,898 2,996 6,02 8,89 operational. The company expects to ramp up the capacity to over 3,000MW PAT 1,463 1,837 5,32 5,81 by the end of FY2012. Thus close to 90% of the company’s planned capacity EPS 58.7 74.8 2.2 2.4 are expected to be commissioned post FY2012, with no significant near term revenue visibility for the company. RoCE 5.9 7.2 1.8 1.7 RoE 7.5 8.2 3.5 3.7 We prefer diversified play: Reliance Infrastructure encompasses various P/E 17.5 13.7 65.9 60.4 assets, from regulated asset in Power to capital-intensive assets in Infra to P/BV 1.5 1.2 2.3 2.2 pure service business model in EPC. Therefore, we believe that is primed to take advantage of the rapid infrastructure growth in India. R-Power is pure utility player with highly exposed to execution risk in the Indian power sector. Relative Stock Performance R-power has a limited exposure to merchant power business. The company has not acquired the entire land as well as fuel for many of the projects including the Dadri and Shahpur coal Projects. Attractive Valuations gives further conviction: We have valued Reliance Infrastructure based on SOTP methodology and arrived at a Target price of Rs1,253 at1.5x on P/BV, translating into an upside of ~22%. Further, it should be noted that at current levels the stock is trading at a huge discount to its peers on P/BV basis even after assigning 20% holding company discount to its stake in R-Power. Hence, we recommend a Buy on the stock. On the other hand, R-Power is trading at 60.4x FY2012E P/E, 2.2x FY2012E P/B & 6.9cr FY2012E EV/MW at Rs145, which is expensive. Based on DCF Valuation we have arrived at a Target Price of Rs 128. Hence, we recommend Reduce on the stock. May 2010 1
- 2. Switch Strategy Investment Advisory Service Recommendation Buy Hindalco and Sell National Aluminium Reco CMP TP Upside Hindalco Buy 164 208 22 We recommend a switch to Hindalco from National Aluminum on account of the Nalco Sell 408 316 (23) following reasons: Nalco pretty expensive as compared to Hindalco: We have valued Hindalco Key Financials based on SOTP methodology as it includes Novelis and investment in other subsidiaries and arrived at a Target price of Rs208 translating into an upside Hindalco Nalco of ~22%. Further, Hindalco is trading at 5.6 FY2012E EV/EBITDA which is at FY2011E FY2012E FY2011E FY2012E a huge discount to Nalco trading at expensive valuations of 11.6x FY2012E Net Sales 63,898 67,521 5,665 6,376 EV/EBITDA. We recommend a Sell on Nalco, with a Target Price of Rs316 at EBITDA 8,333 9,325 1,606 2,063 which the stock will trade at 9x FY2012E EV/EBITDA. Even on P/BV basis, Hindalco is trading at 1.1x FY2012E while Nalco is trading at 2.3x FY2012E. PAT 3,761 4,027 995 1,221 On a P/E basis also, Hindalco is trading at 7.8x FY2012E earnings, which EPS 19.7 21.0 15.4 19.0 appears attractive as compared to Nalco which is trading at 21.5x FY2012E RoCE 10.6 10.3 10.7 13.1 earnings. RoE 16.2 15.0 9.4 10.8 P/E 8.3 7.8 26.4 21.5 We like Hindalco unlike Nalco for its growth visibility led by low cost P/BV 1.3 1.1 2.4 2.3 expansion plans: We believe Hindalco is well placed to benefit from its low EV/EBITDA 6.0 5.6 15.3 11.6 cost capacity expansion which is likely to come on-stream in next 2-4 years. Hindalco is more than doubling it aluminium metal capacity to 1.3mn tonnes by FY2012E from current 0.5mn tonnes and increasing it threefold to 1.6mn tonnes by FY2014E. In addition, it is also increasing its alumina capacity in Relative Stock Performance the same proportion which would further lower costs for the company. On the other hand, Nalco is facing delays for its 0.5mn tonne alumina refinery which is now expected to come on-stream by 3QFY2011E and full benefit of the same would be reflected in FY2012E against earlier estimated FY2011E. Apart from the ongoing expansion plan, there is little clarity on the other proposed expansion plans as they are in various stages of financial closure and significant progress is yet to be made. While we expect turnaround at Novelis but coal supply issues at Nalco likely to continue: We believe that Novelis operations are on recovery track as evident from the fact that long term product prices were re-negotiated at higher levels. On the other hand, Nalco has been facing coal supply issues Recent FPOs which have disrupted its operations in the past. The company sources its Peak Price annual coal requirement from Mahanadi Coalfields Ltd (MCL) but the supply FPO price Discount prior to FPO (Rs) (Rs) (%) is not evenly distributed which keep the coal stock of the company sufficient NMDC 300 556 (46.0) for two-three days production. In our view, any disturbance in coal supply would increase its dependence on imported or external coal thereby NTPC 201 236 (14.7) negatively impacting the margins. REC 203 271 (25.1) Divestment of stake in Nalco unlikely at current price: Government holds 87.2% stake and plans to divest upto 10% as per media reports. We believe the disinvestment is unlikely to happen at current price levels on account of expensive valuations and the stock may potentially correct down as seen in the recent FPOs. May 2010 2
- 3. Switch Strategy Investment Advisory Service Recommendation Buy SBI and Reduce PNB Reco CMP TP Upside SBI Buy 2,223 2,596 17 We recommend a switch from PNB to SBI on account of the following reasons: PNB Reduce 1,006 947 (6) SBI is gaining while PNB is losing Savings marketshare: Over FY2007- 9MFY2010, SBI was one of very few PSU Banks to have gained Savings Key Financials marketshare (up 300bp to 23.5%), driven by relatively faster branch expansion (9.5% CAGR v/s 2-5% for most PSBs) leveraging its tremendous SBI PNB trust factor in the country. FY2011E FY2012E FY2011E FY2012E On the other hand, strong legacy apart, over the same period PNB lost Oper. Inc. 45,694 55,200 13,245 15,262 Savings marketshare (down 70bp to 6.9%) in line with relatively slower NIM 2.6 2.7 3.3 3.2 branch expansion. PAT 10,284 14,485 4,002 4,566 EPS 162.0 228.2 126.9 144.8 PNB’s asset yields are unsustainably high, posing downside to RoEs, while the Adj. BV 1,133.3 1,307.6 614.9 728.7 opposite holds true for SBI: Due to strong CASA and Fee Income, SBI’s core RoA 0.9 1.0 1.2 1.2 RoEs have improved over the past few years and unlike virtually all other PSU Banks, actual 9MFY2010 RoEs are below core levels (15.8% vs. ~19%) due RoE 15.9 19.7 22.5 21.6 to low asset yields, providing scope for upside as the CD ratio improves and P/E 13.7 9.7 7.9 6.9 yields normalise to sectoral averages. P/ABV 2.0 1.7 1.6 1.4 On the other hand, PNB’s yield on advances increased by 49bp in 9MFY2010 over FY2008 levels, as against an average decrease of 5bp for Relative Stock Performance PSU Banks. In our view, super-normal RoEs cannot be earned on a 250 sustainable basis through higher than sector average risk-adjusted yield on assets and tend to decline in subsequent years either through an increase in 200 NPA costs or decline in yields. Accordingly, while we believe the bank can 150 deliver healthy core ROEs of 17-18% in the longer run due to its strong legacy, however, actual RoEs are unsustainably high at 25.4% and there is 100 risk of downside. 50 0 SBI’s valuations are far more attractive than PNB: Post correction, SBI Jan-09 May-09 Sep-09 Jan-10 May-10 (excluding value of insurance and capital market subsidiaries), is trading at just 1.3x FY2012E ABV v/s its 5-year range of 1.3-2.0x and median of 1.6x. SBI PNB We believe this provides sufficient margin of safety and attractive upside, especially in light of its dominant position and reach, strong growth and superior Earnings quality. We recommend a Buy on the stock, with a Target Price of Rs2,596. On the other hand, PNB is trading at 1.4x FY2012E ABV, which is expensive considering its 5-year range of 1.0-1.5x and median of 1.3x. We believe that current valuations fairly reflect PNB’s structural positives, but do not provide a sufficient margin of safety from potential near-term asset quality pressures / decline in asset yields. We value the Bank 1.3x FY2012E ABV to arrive at a Target Price of Rs947. Hence, we recommend Reduce on the stock. May 2010 3