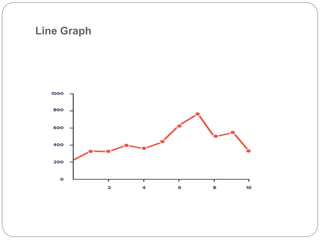
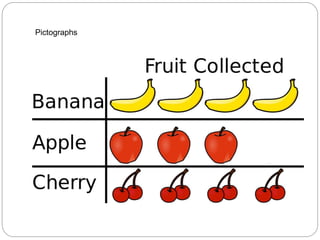
The document provides an overview of data visualization, emphasizing its role in presenting data in a clear and understandable manner for end users. It discusses the requirements for effective visualization, types of charts, and best practices, highlighting the importance of accuracy and appropriate representation of data. Various chart types and the objectives of effective data visualization are outlined to help enhance data comprehension.