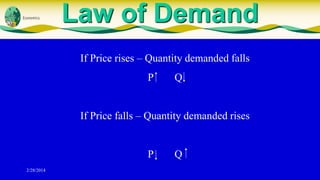
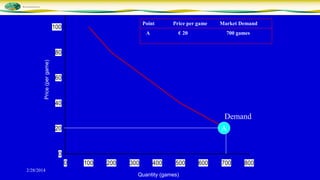
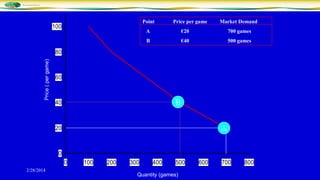
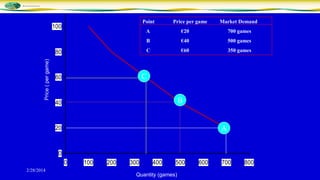
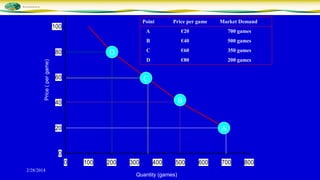
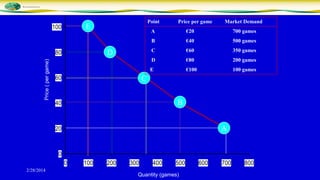
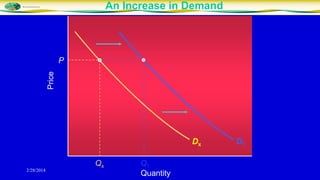
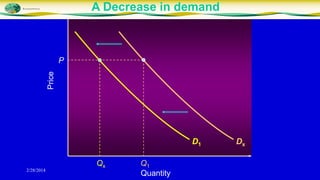
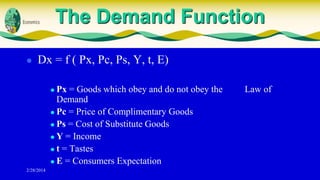
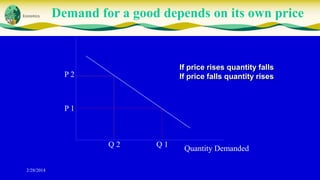
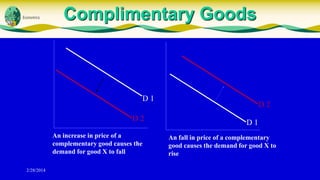
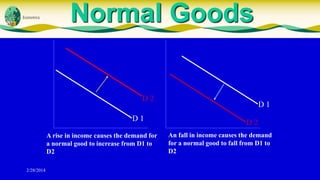
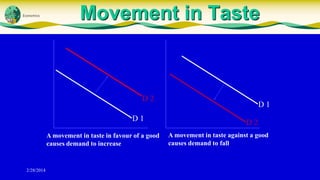
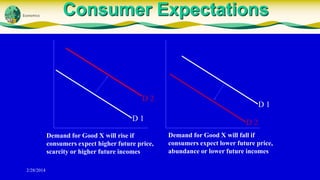
Demand Analysis

By:Mithilesh Trivedi
Demand




2/28/2014

The amount consumers
desire to purchase at
various prices
Demand does not
necessarily mean a
consumer WILL buy,
but refers to a good or
service they WOULD
LIKE to buy
Effective Demand


Consumers must be willing to buy AND be capable of
paying the price set by the supplier

2/28/2014
Law of Demand
If Price rises – Quantity demanded falls
P

Q

If Price falls – Quantity demanded rises

P
2/28/2014

Q
Individual Demand


Individual Demand Schedule
Lists the different quantities of a good that an
individual consumer is prepared to buy at each
price

2/28/2014
Market Demand


Market Demand Schedule
Lists the different quantities of a good that all
consumers in the market are prepared to buy
at each price. It is derived by adding together
all the individual demand schedules for the
good

2/28/2014
Demand Schedule
(Demand for The Wii Games monthly)
(1)
Price

(3)
David’s
demand

(4)
Total market
demand

(# games)

(per game)

(2)
Chris’s
demand

(# games)

(# games)

A

28

16

700

B

40

15

11

500

C

60

5

9

350

D

80

1

7

200

E
2/28/2014

20

100

0

6

100
Demand Curve


At higher prices, consumers generally willing to purchase
less than at lower prices



Demand curve is said to have a negative slope - downward
sloping from left to right

2/28/2014
Point

100

Price per game

€ 20

A

Market Demand

700 games

Price (per game)

80

60

40

Demand
A

20

0
0
2/28/2014

100

200

300

400

500

Quantity (games)

600

700

800
Point

100

Price per game

Market Demand

A

€20

700 games

B

€40

500 games

Price ( per game)

80

60

B

40

A

20

0
0
2/28/2014

100

200

300

400

500

Quantity (games)

600

700

800
Point

100

Price per game

Market Demand

A

Price ( per game)

700 games

B

€40

500 games

C

80

€20

€60

350 games

C

60

B

40

20

A

0
0
2/28/2014

100

200

300

400

500

Quantity (games)

600

700

800
Point

100

Price per game

Market Demand

A

Price ( per game)

500 games

€60

350 games

D

60

€40

C

D

700 games

B

80

€20

€80

200 games

C

B

40

A

20

0
0
2/28/2014

100

200

300

400

500

Quantity (games)

600

700

800
Point

E

100

Price per game

Market Demand

€40

500 games

€60

350 games

D

€80

200 games

E

60

700 games

C

D

80

€20

B

Price ( per game)

A

€100

100 games

C

B

40

A

20

0
0
2/28/2014

100

200

300

400

500

Quantity (games)

600

700

800
An Increase in Demand

Price

P

Dx

2/28/2014

Qx

Q1
Quantity

D1
A Decrease in demand

Price

P

D1

2/28/2014

Qx

Q1
Quantity

Dx
Factors affecting the demand for a good

The Demand Function

Dx = f ( Px, Pc, Ps, Y, t, E)

2/28/2014
The Demand Function


Dx = f ( Px, Pc, Ps, Y, t, E)
Px = Goods which obey and do not obey the
Demand
 Pc = Price of Complimentary Goods
 Ps = Cost of Substitute Goods
 Y = Income
 t = Tastes
 E = Consumers Expectation


2/28/2014

Law of
Demand for a good depends on its own price

If price rises quantity falls
If price falls quantity rises

P2

P1

Q2
2/28/2014

Q1

Quantity Demanded
Demand for a good depends on its own price
• Complimentary Goods
Goods which are used
jointly. The use of one
involves the use of the other

• Substitute Goods
Goods which satisfy the
same needs and thus can be
considered as alternatives to
each other

2/28/2014
Complimentary Goods

D1
D2
An increase in price of a
complementary good causes the
demand for good X to fall
2/28/2014

D2
D1
An fall in price of a complementary
good causes the demand for good X to
rise
Substitute Goods
(The Substitute Effect)

D2
D1
An increase in price of a substitute
good causes the demand for good X to
rise
2/28/2014

D1
D2
An fall in price of a substitute good
causes the demand for good X to fall
Demand for a good depends on level of
income (The Income Effect)

• Normal Goods
A normal good is a good with a positive income effect. A rise in income causes
more of it to be demanded, while a fall in income causes less of it to be
demanded

2/28/2014
Normal Goods

D2
D1
A rise in income causes the demand for
a normal good to increase from D1 to
D2
2/28/2014

D1
D2
An fall in income causes the demand
for a normal good to fall from D1 to
D2
Demand Depends on Taste


If the movement in taste is in favour of the good, it causes
an increase in demand, which shifts the demand curve to the
right



If the movement in taste is against the good, it causes a fall
in demand, which shifts the demand curve to the left

2/28/2014
Movement in Taste

D2
D1
A movement in taste in favour of a good
causes demand to increase

2/28/2014

D1
D2
A movement in taste against a good
causes demand to fall
Demand for a good depends on the
expectations of consumers


Demand for a good will shift to the right if consumers
expect:
1.
2.
3.



The price of good X to be higher in the future
A scarcity of good X in the future
Their incomes to be higher in the future

Demand for a good will shift to the left if consumers
expect:
The price of good X to be lower in the future
2.
A plentiful supply of good X in the future
3.
2/28/2014Their incomes will be lower in the future
1.
Consumer Expectations

D2
D1
Demand for Good X will rise if
consumers expect higher future price,
scarcity or higher future incomes
2/28/2014

D1
D2
Demand for Good X will fall if
consumers expect lower future price,
abundance or lower future incomes
Demand Analysis

Demand Analysis

  • 1.
  • 2.
    Demand   2/28/2014 The amount consumers desireto purchase at various prices Demand does not necessarily mean a consumer WILL buy, but refers to a good or service they WOULD LIKE to buy
  • 3.
    Effective Demand  Consumers mustbe willing to buy AND be capable of paying the price set by the supplier 2/28/2014
  • 4.
    Law of Demand IfPrice rises – Quantity demanded falls P Q If Price falls – Quantity demanded rises P 2/28/2014 Q
  • 5.
    Individual Demand  Individual DemandSchedule Lists the different quantities of a good that an individual consumer is prepared to buy at each price 2/28/2014
  • 6.
    Market Demand  Market DemandSchedule Lists the different quantities of a good that all consumers in the market are prepared to buy at each price. It is derived by adding together all the individual demand schedules for the good 2/28/2014
  • 7.
    Demand Schedule (Demand forThe Wii Games monthly) (1) Price (3) David’s demand (4) Total market demand (# games) (per game) (2) Chris’s demand (# games) (# games) A 28 16 700 B 40 15 11 500 C 60 5 9 350 D 80 1 7 200 E 2/28/2014 20 100 0 6 100
  • 8.
    Demand Curve  At higherprices, consumers generally willing to purchase less than at lower prices  Demand curve is said to have a negative slope - downward sloping from left to right 2/28/2014
  • 9.
    Point 100 Price per game €20 A Market Demand 700 games Price (per game) 80 60 40 Demand A 20 0 0 2/28/2014 100 200 300 400 500 Quantity (games) 600 700 800
  • 10.
    Point 100 Price per game MarketDemand A €20 700 games B €40 500 games Price ( per game) 80 60 B 40 A 20 0 0 2/28/2014 100 200 300 400 500 Quantity (games) 600 700 800
  • 11.
    Point 100 Price per game MarketDemand A Price ( per game) 700 games B €40 500 games C 80 €20 €60 350 games C 60 B 40 20 A 0 0 2/28/2014 100 200 300 400 500 Quantity (games) 600 700 800
  • 12.
    Point 100 Price per game MarketDemand A Price ( per game) 500 games €60 350 games D 60 €40 C D 700 games B 80 €20 €80 200 games C B 40 A 20 0 0 2/28/2014 100 200 300 400 500 Quantity (games) 600 700 800
  • 13.
    Point E 100 Price per game MarketDemand €40 500 games €60 350 games D €80 200 games E 60 700 games C D 80 €20 B Price ( per game) A €100 100 games C B 40 A 20 0 0 2/28/2014 100 200 300 400 500 Quantity (games) 600 700 800
  • 14.
    An Increase inDemand Price P Dx 2/28/2014 Qx Q1 Quantity D1
  • 15.
    A Decrease indemand Price P D1 2/28/2014 Qx Q1 Quantity Dx
  • 16.
    Factors affecting thedemand for a good The Demand Function Dx = f ( Px, Pc, Ps, Y, t, E) 2/28/2014
  • 17.
    The Demand Function  Dx= f ( Px, Pc, Ps, Y, t, E) Px = Goods which obey and do not obey the Demand  Pc = Price of Complimentary Goods  Ps = Cost of Substitute Goods  Y = Income  t = Tastes  E = Consumers Expectation  2/28/2014 Law of
  • 18.
    Demand for agood depends on its own price If price rises quantity falls If price falls quantity rises P2 P1 Q2 2/28/2014 Q1 Quantity Demanded
  • 19.
    Demand for agood depends on its own price • Complimentary Goods Goods which are used jointly. The use of one involves the use of the other • Substitute Goods Goods which satisfy the same needs and thus can be considered as alternatives to each other 2/28/2014
  • 20.
    Complimentary Goods D1 D2 An increasein price of a complementary good causes the demand for good X to fall 2/28/2014 D2 D1 An fall in price of a complementary good causes the demand for good X to rise
  • 21.
    Substitute Goods (The SubstituteEffect) D2 D1 An increase in price of a substitute good causes the demand for good X to rise 2/28/2014 D1 D2 An fall in price of a substitute good causes the demand for good X to fall
  • 22.
    Demand for agood depends on level of income (The Income Effect) • Normal Goods A normal good is a good with a positive income effect. A rise in income causes more of it to be demanded, while a fall in income causes less of it to be demanded 2/28/2014
  • 23.
    Normal Goods D2 D1 A risein income causes the demand for a normal good to increase from D1 to D2 2/28/2014 D1 D2 An fall in income causes the demand for a normal good to fall from D1 to D2
  • 24.
    Demand Depends onTaste  If the movement in taste is in favour of the good, it causes an increase in demand, which shifts the demand curve to the right  If the movement in taste is against the good, it causes a fall in demand, which shifts the demand curve to the left 2/28/2014
  • 25.
    Movement in Taste D2 D1 Amovement in taste in favour of a good causes demand to increase 2/28/2014 D1 D2 A movement in taste against a good causes demand to fall
  • 26.
    Demand for agood depends on the expectations of consumers  Demand for a good will shift to the right if consumers expect: 1. 2. 3.  The price of good X to be higher in the future A scarcity of good X in the future Their incomes to be higher in the future Demand for a good will shift to the left if consumers expect: The price of good X to be lower in the future 2. A plentiful supply of good X in the future 3. 2/28/2014Their incomes will be lower in the future 1.
  • 27.
    Consumer Expectations D2 D1 Demand forGood X will rise if consumers expect higher future price, scarcity or higher future incomes 2/28/2014 D1 D2 Demand for Good X will fall if consumers expect lower future price, abundance or lower future incomes