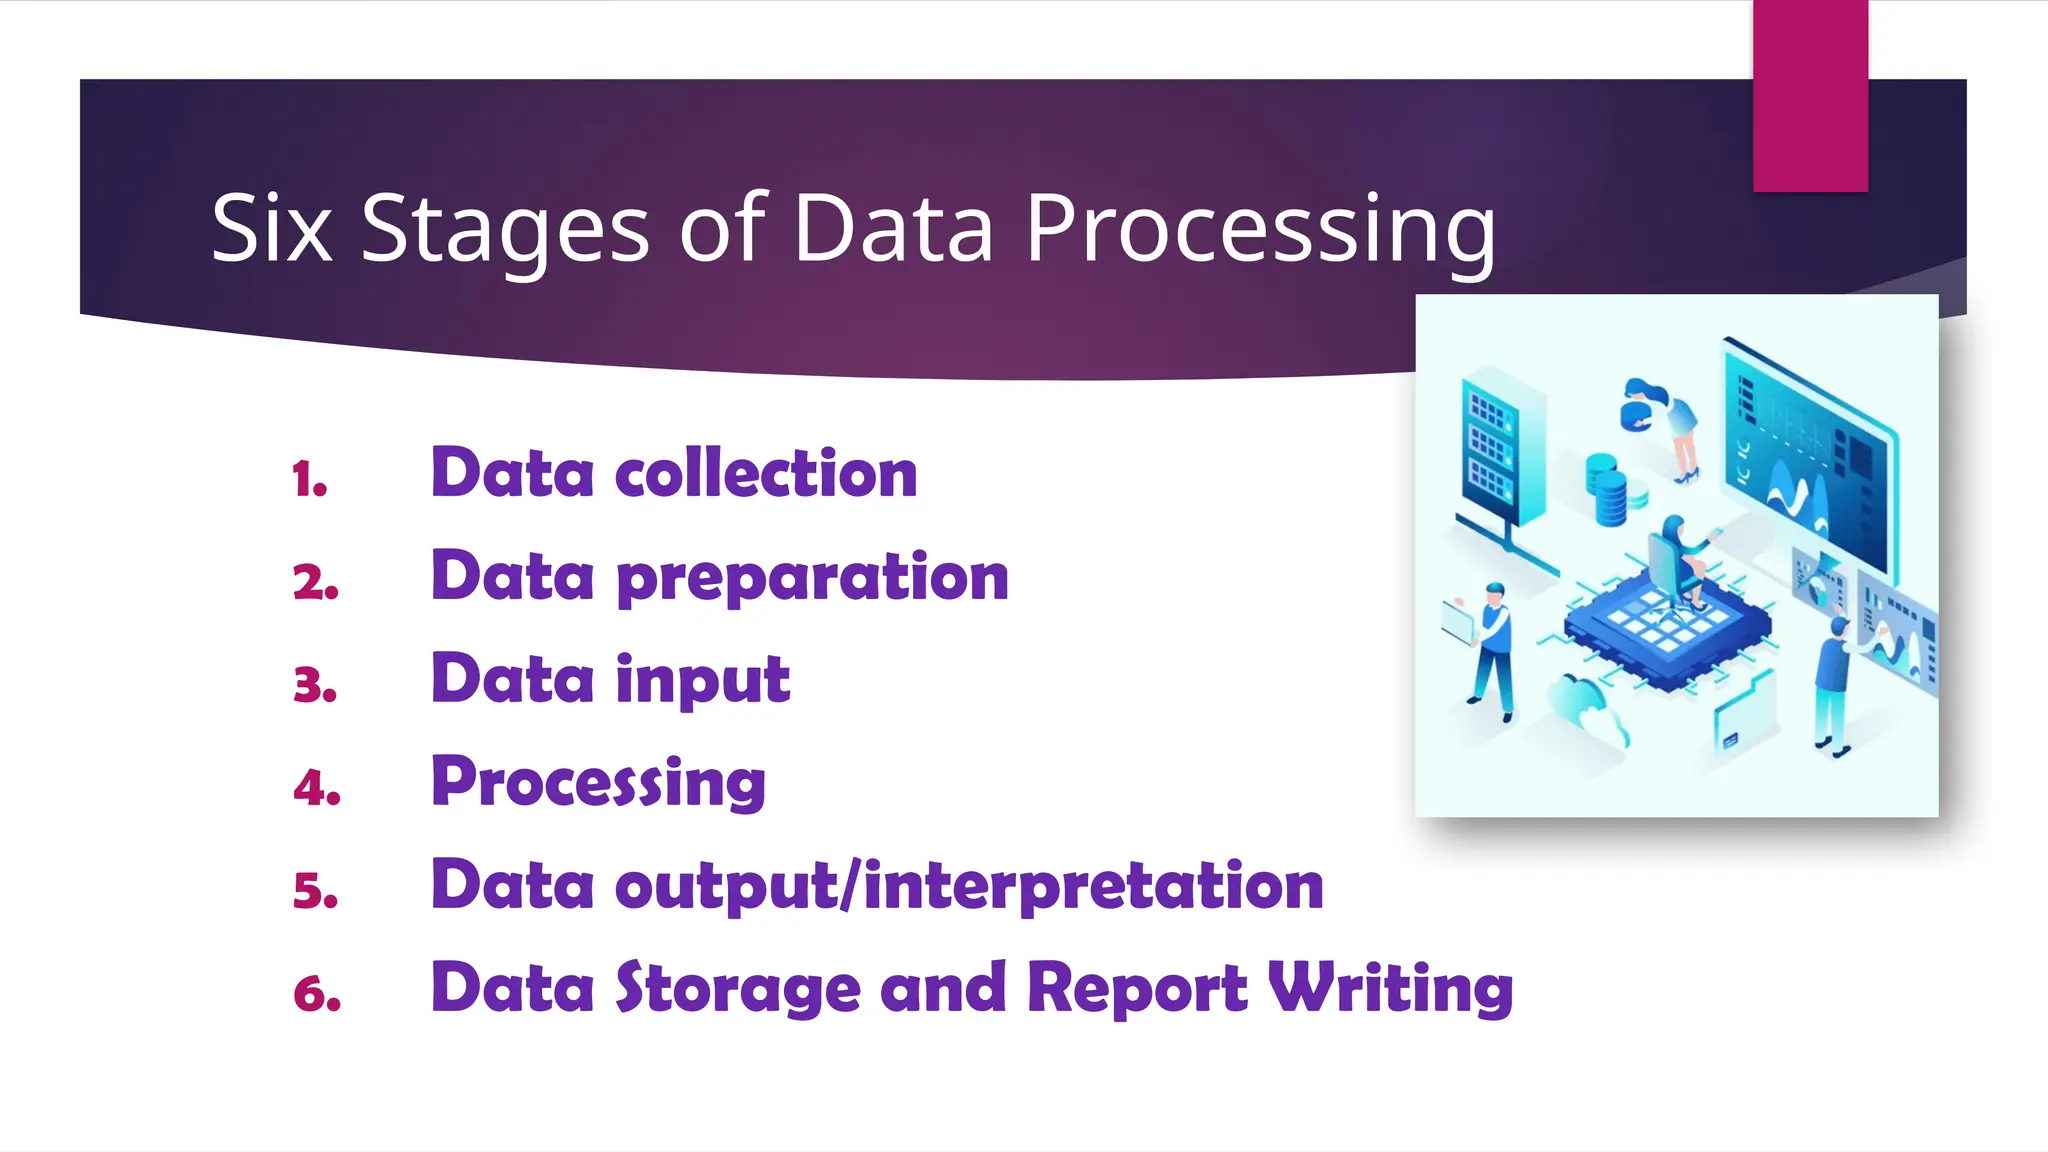
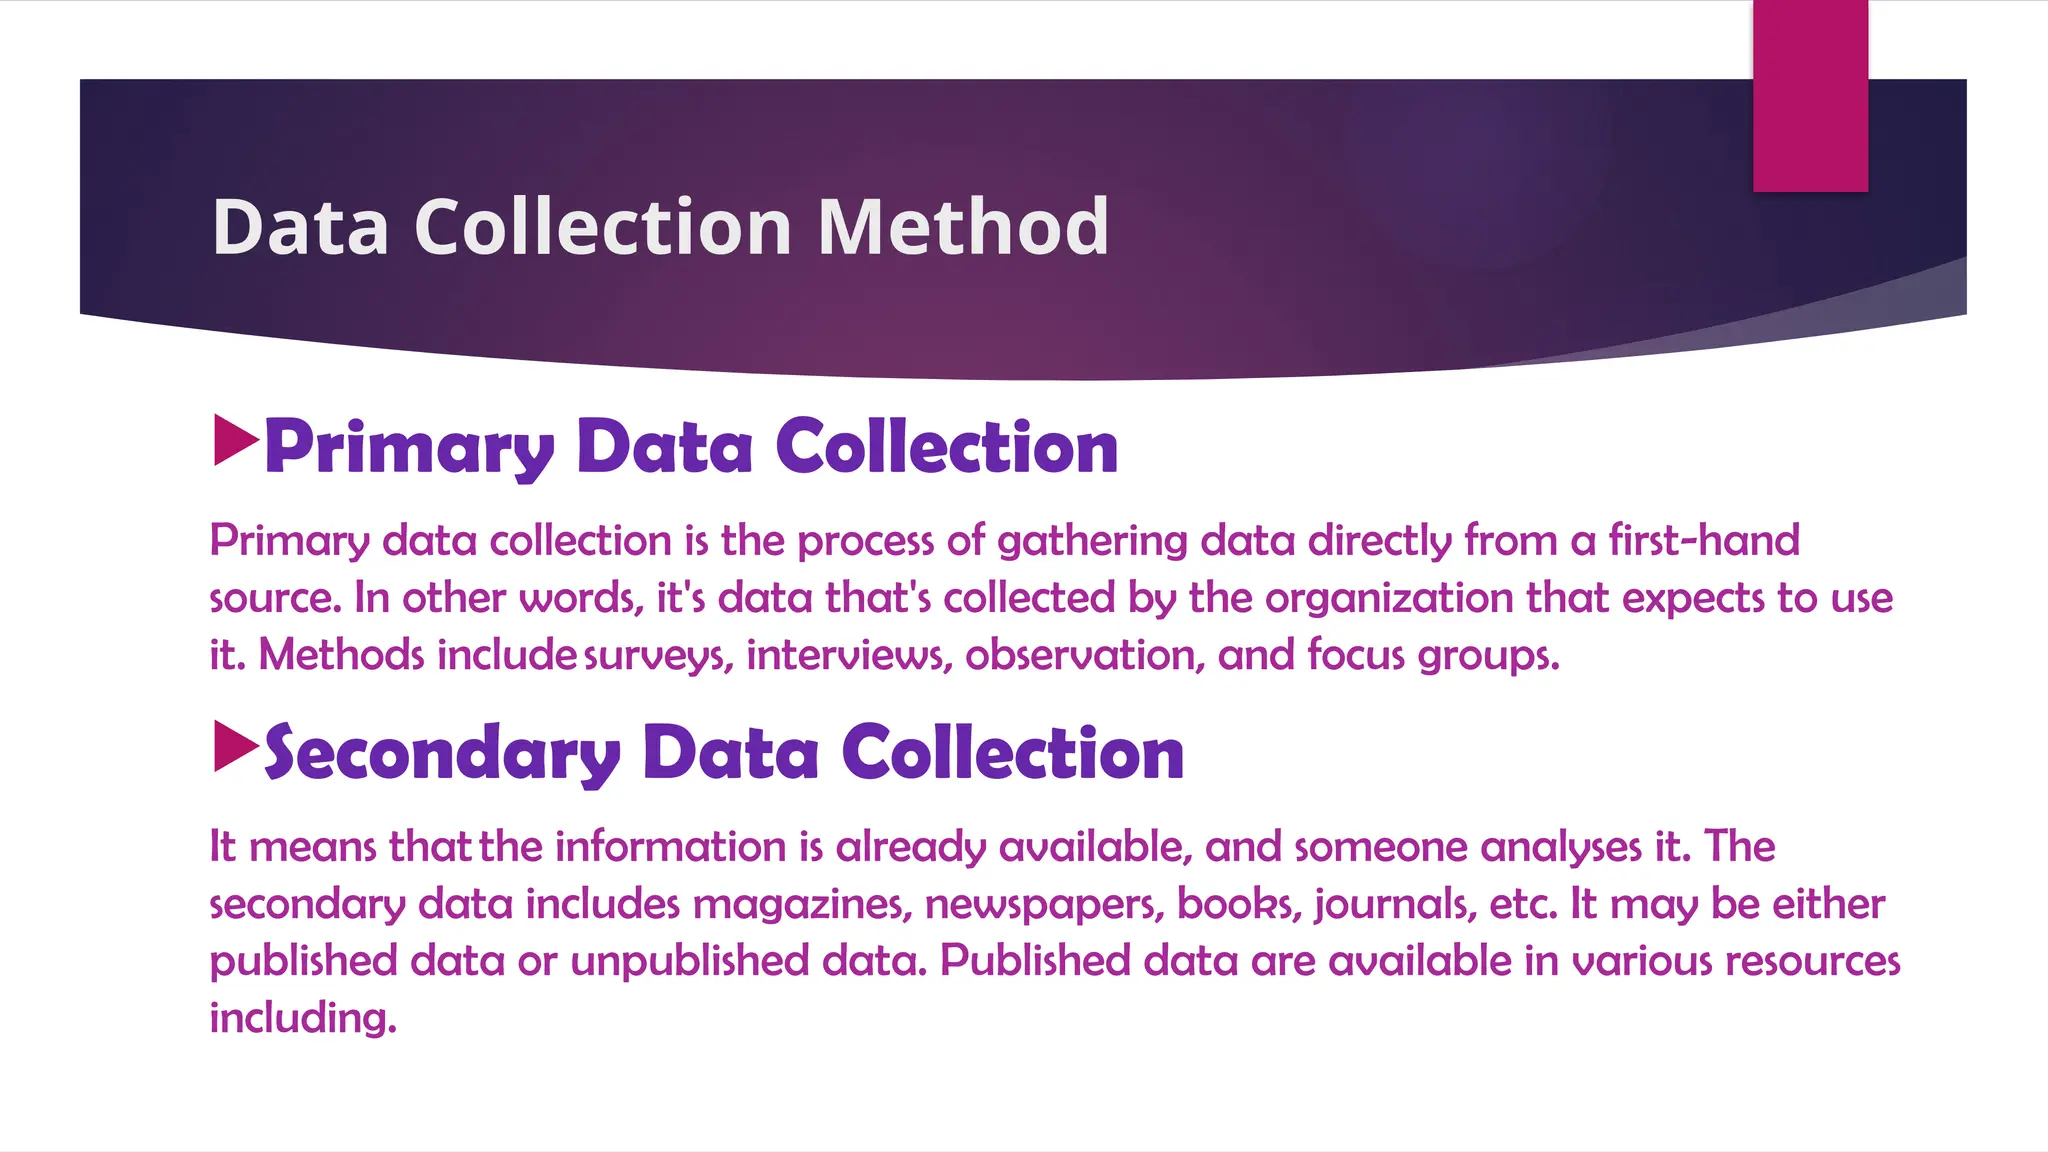
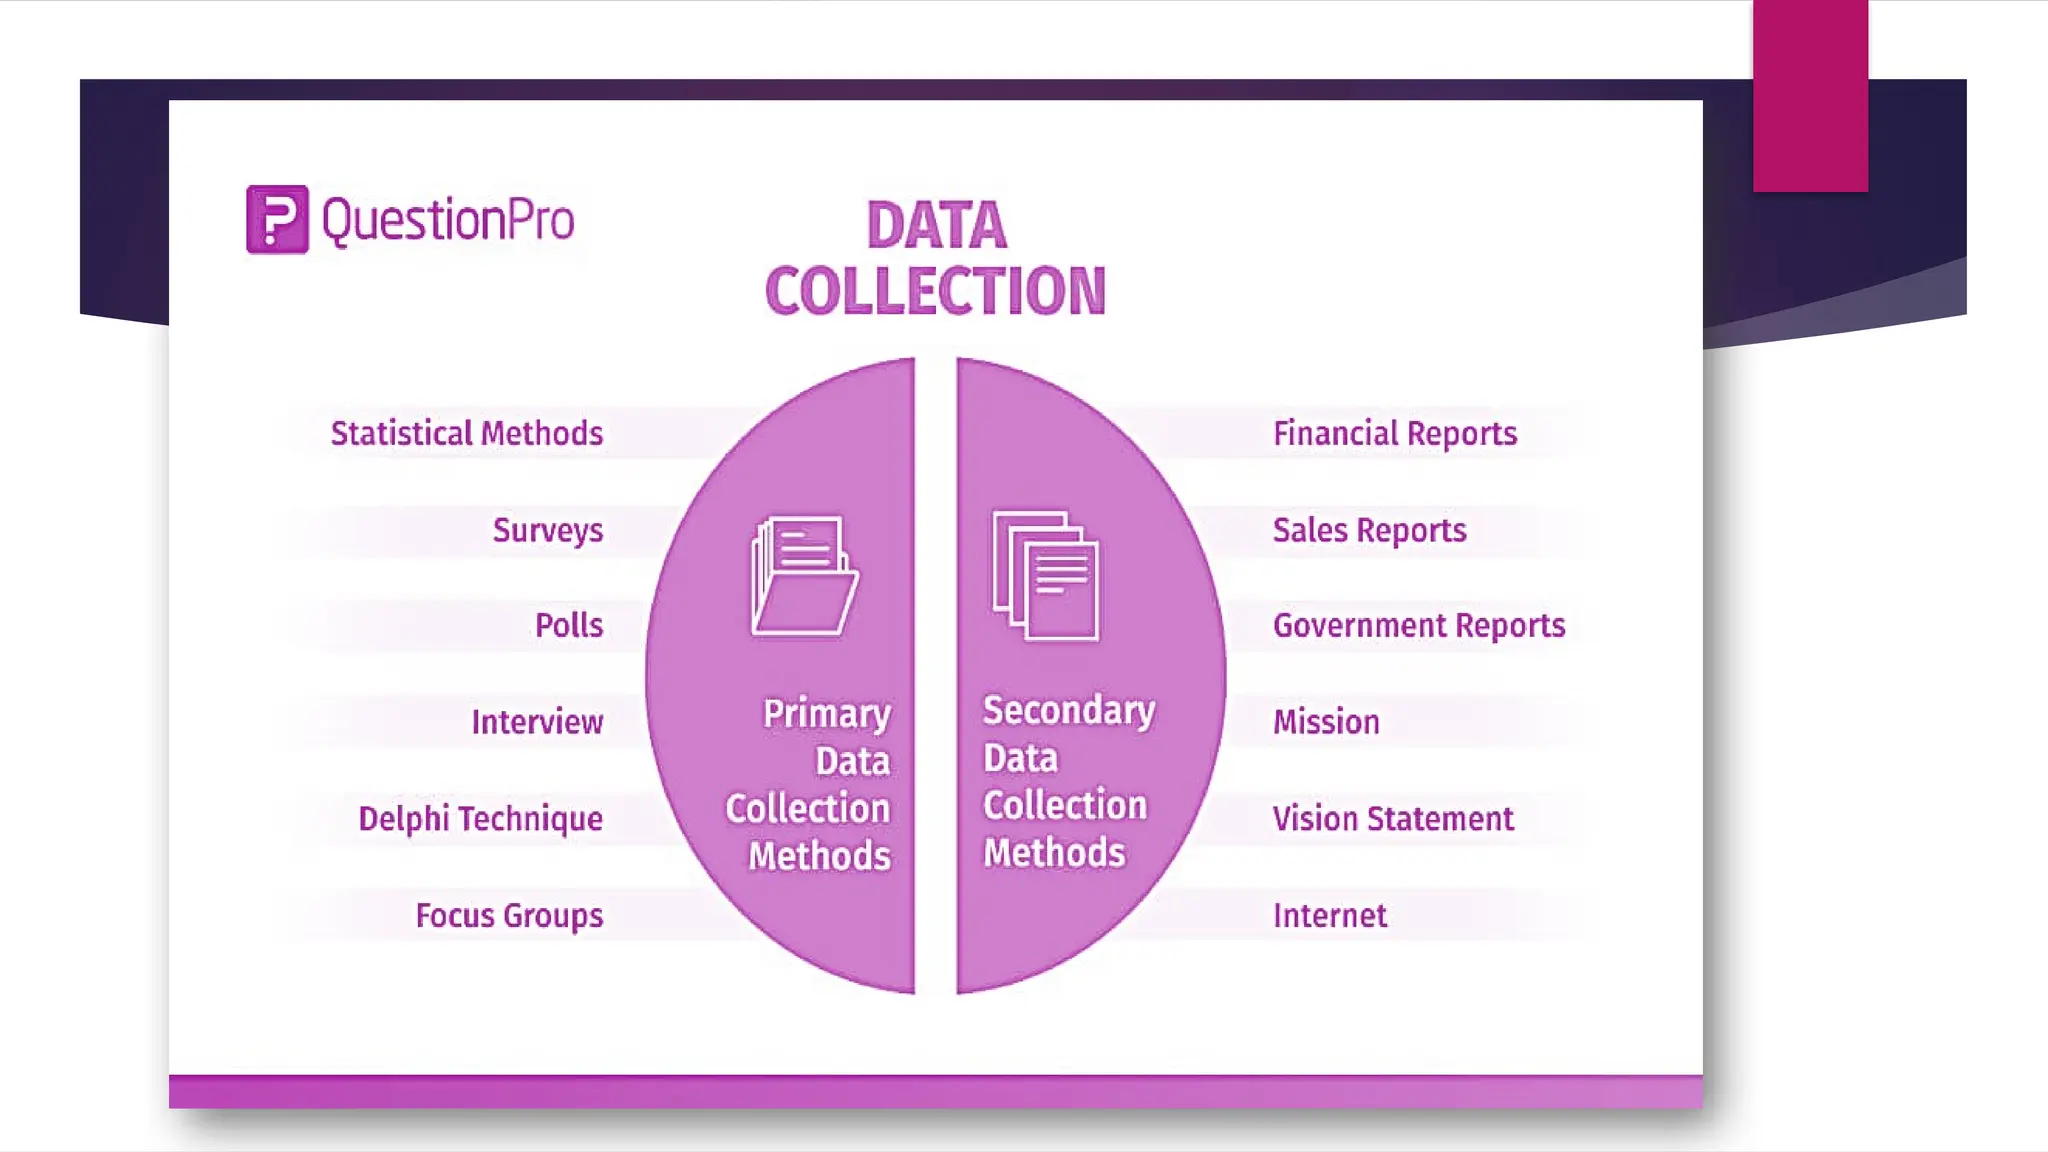
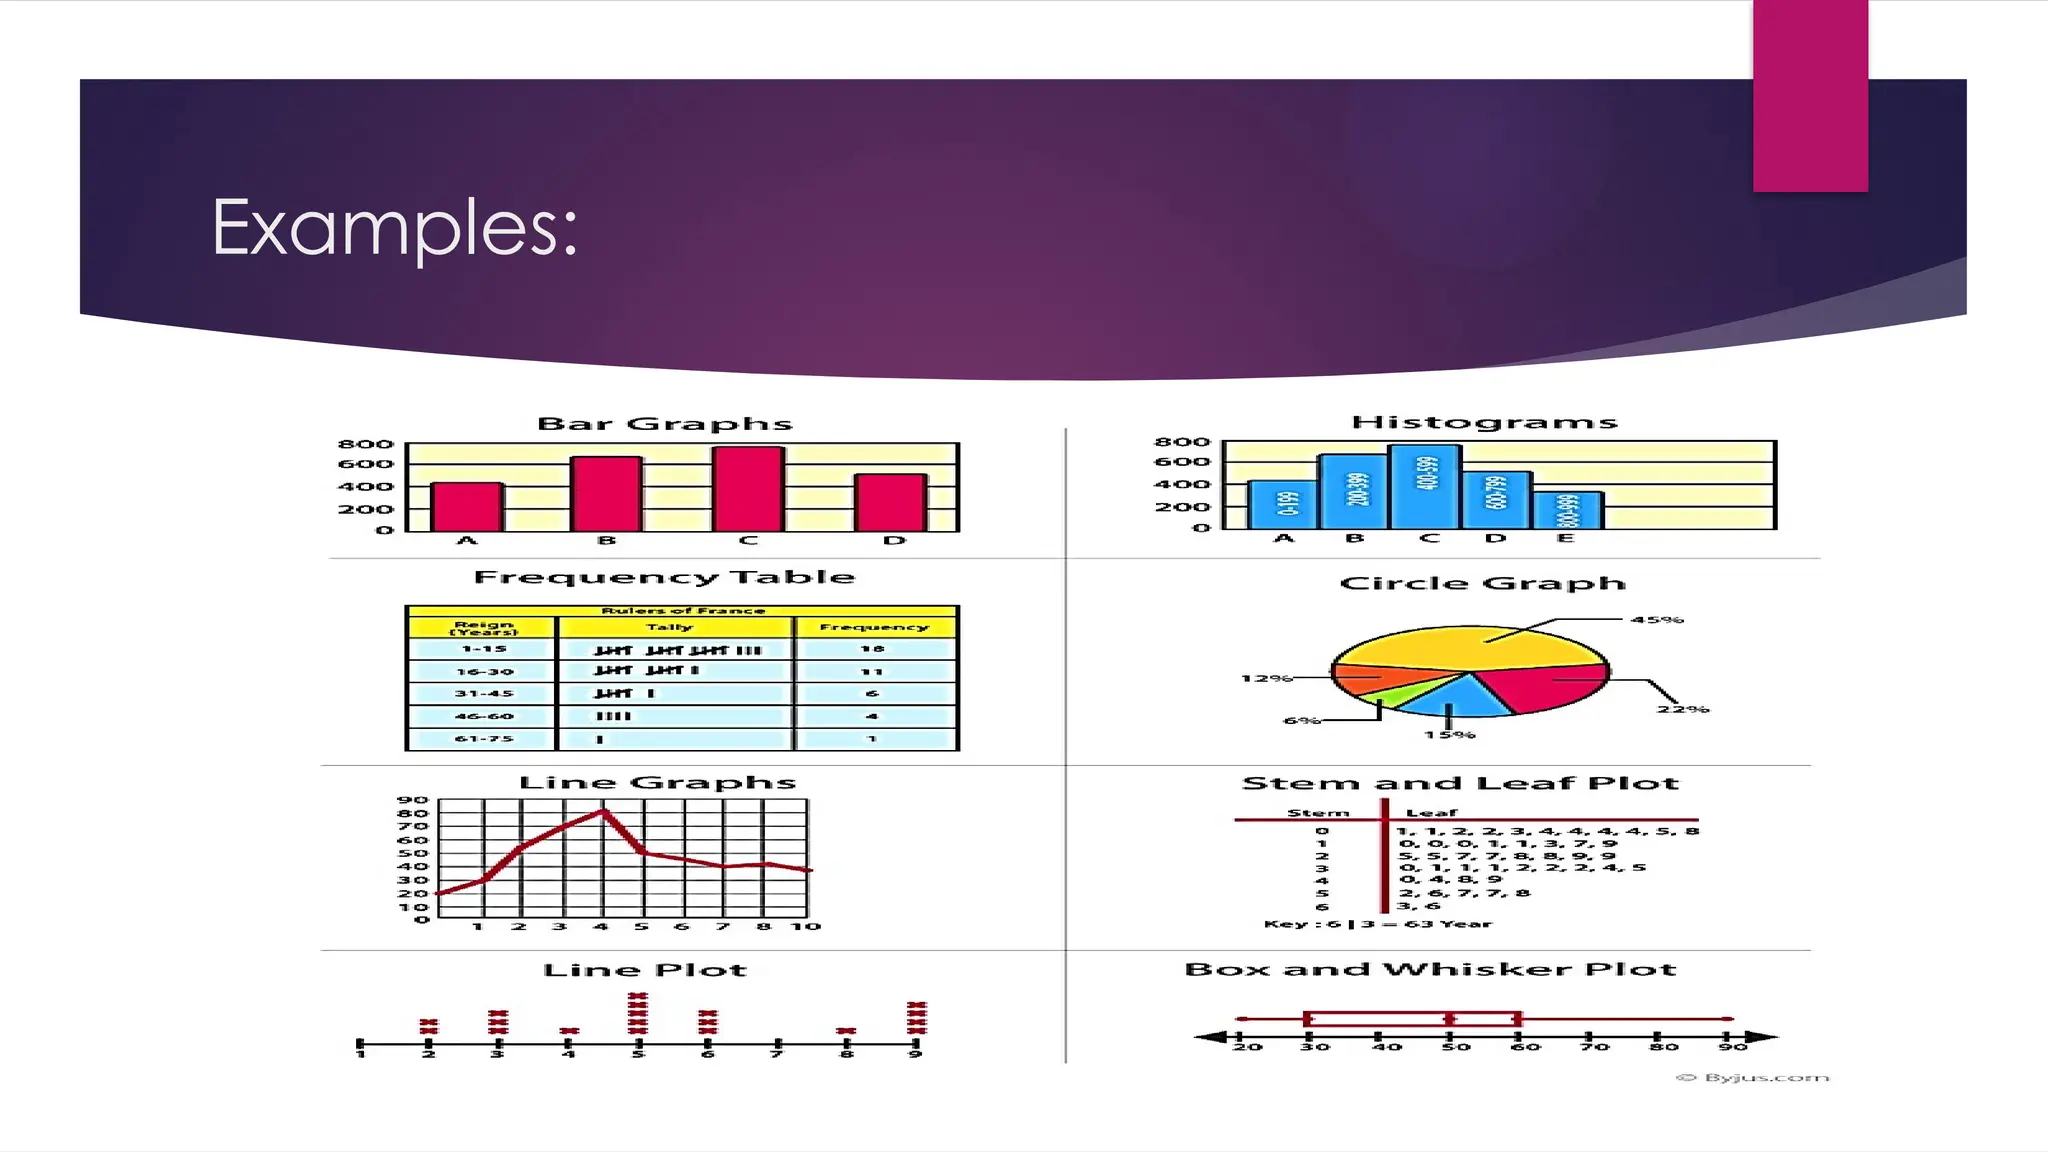
PROCESSING, ORGANIZING AND
PRESENTATION OF DATA
DATA PROCESSING
 it is the collection and translation of a data
set into valuable, usable information.
 through this process, a researcher, data
engineer or data scientist takes raw data
and converts it into a more readable format,
such as a graph, report or chart, either
manually or through an automated tool.
Six Stages of Data Processing
1. Data collection
2. Data preparation
3. Data input
4. Processing
5. Data output/interpretation
6. Data Storage and Report Writing
1. Data collection
 Data collection is the process of gathering and
measuring information on variables of
interest, in an established systematic fashion
that enables one to answer stated research
questions, test hypotheses, and evaluate
outcomes.
Data Collection Method
Primary Data Collection
Primary data collection is the process of gathering data directly from a first-hand
source. In other words, it's data that's collected by the organization that expects to use
it. Methods includesurveys, interviews, observation, and focus groups.
Secondary Data Collection
It means thatthe information is already available, and someone analyses it. The
secondary data includes magazines, newspapers, books, journals, etc. It may be either
published data or unpublished data. Published data are available in various resources
including.
2. Data Preparation
 Data preparation or data cleaning is the process of
sorting and filtering the raw data to remove
unnecessary and inaccurate data. Raw data is
checked for errors, duplication, miscalculations or
missing data, and transformed into a suitable form
for further analysis and processing.
Examples:
3. Data input
 In this step, the raw data is converted into
machine readable form and fed into the
processing unit. This can be in the form of
data entry through a keyboard, scanner or
any other input source.
4. Processing
 Data processing is the collection and translation of a
data set into valuable, usable information. Through
this process, a researcher, data engineer or data
scientist takes raw data and converts it into a more
readable format, such as a graph, report or chart,
either manually or through an automated tool.
5. Data output
 Output is where the computer takes the pixels from the
processing stage and displays them in a way that the
user can see them. There are many kinds of output
devices, such asprinters, screens, video and audio devices
 The data is finally transmitted and displayed to the user
in a readable form like graphs, tables, vector files,
audio, video, documents, etc. This output can be stored
and further processed in the next data processing cycle.
6. Data Storage
 The last step of the data processing cycle is storage,
where data and metadata are stored for further
use. This allows for quick access and retrieval of
information whenever needed, and also allows it to
be used as input in the next data processing cycle
directly.
Five (5) Important Steps in
processing data in research
1. EDITING OF DATA
2. CODING OF DATA
3. CLASSIFICATION OF DATA
4. TABULATION OF DATA
5. GRAPHING OF DATA
EDITING OF DATA
 Data editing is defined as the process involving the review and
adjustment of collected survey data.
 It is defined as the process involving the review and adjustment of
collected survey data.
 Data editing helps define guidelines that will reduce potential bias and
ensure consistent estimates leading to a clear analysis of the data set
by correct inconsistent data using the methods later in this article.
CODING OF DATA
 Coding is the process of labeling and organizing your qualitative
data to identify different themes and the relationships between
them.
 the process of assigning some symbols (either) alphabetical or
numerals or (both) to the answers so that the responses can be
recorded into a limited number of classes or categories. The classes
should be appropriate to the research problem being studied.
Examples:
Thematic Coding
Numerical Coding
Descriptive Coding
CLASSIFICATION/ORGANIZING
OF DATA
Data Classification is grouping data together with
similar characteristics.
Data classification isthe process of analyzing
structured or unstructured data and organizing it
into categories based on file type, contents, and
other metadata.
The bases of classification are the
following:
 Qualitative. Those having the same quality or are of the same kind are grouped
together. The grouping element in the examples given under analysis is qualitative. See
examples under analysis.
 Quantitative. Data are grouped according to their quantity. In age, for instance,
people may be grouped into ages of 10-14, 15-19, 20-24, 25-29, etc.
 Geographical. Data may be classified according to their location for instance; the
schools in the secondary level in Province A may be grouped by district, as District 1,
District 2, District 3, etc.
 Chronological. In this, data are classified according to the order of their occurrence.
Example: The enrolments of the high schools of Province A may be classified according to
school years, as for, instance, enrolments during the school years 1985-’86, 1986-’87,
1987-’88.
TABULATION OF DATA
Tabulation is a method of presenting
numeric data in rows and columns in a
logical and systematic manner to aid
comparison and statistical analysis.
Example:
GRAPHING OF DATA
 Graphical representation refers tothe use of charts and
graphs to visually display, analyze, clarify, and interpret
numerical data, functions, and other qualitative structures.
 It a common method to visually illustrate relationships in
the data. The purpose of a graph is to present data that are
too numerous or complicated to be described adequately in
the text and in less space.
Examples:
REFERENCES:
 Aquino, Gaudencio V. Essentials of Research and Thesis Writing. Quezon
City: Alemars-Phoenix Publishing House, Inc., 1974
 Manlapaz, Edna Z. and Ma. Eloisa N. Francisco. The College Research
Paper. Manila:National Book Store, Inc., 1985.
 https://www.simplilearn.com/what-is-data-processing-article
 https://www.slideshare.net/CharleneEveSaligumba/presentation-of-data-t
hesis-writing

PROCESSING-ORGANIZING-AND-PRESENTATION-OF-DATA.pptx

  • 1.
  • 2.
    DATA PROCESSING  itis the collection and translation of a data set into valuable, usable information.  through this process, a researcher, data engineer or data scientist takes raw data and converts it into a more readable format, such as a graph, report or chart, either manually or through an automated tool.
  • 3.
    Six Stages ofData Processing 1. Data collection 2. Data preparation 3. Data input 4. Processing 5. Data output/interpretation 6. Data Storage and Report Writing
  • 4.
    1. Data collection Data collection is the process of gathering and measuring information on variables of interest, in an established systematic fashion that enables one to answer stated research questions, test hypotheses, and evaluate outcomes.
  • 5.
    Data Collection Method PrimaryData Collection Primary data collection is the process of gathering data directly from a first-hand source. In other words, it's data that's collected by the organization that expects to use it. Methods includesurveys, interviews, observation, and focus groups. Secondary Data Collection It means thatthe information is already available, and someone analyses it. The secondary data includes magazines, newspapers, books, journals, etc. It may be either published data or unpublished data. Published data are available in various resources including.
  • 7.
    2. Data Preparation Data preparation or data cleaning is the process of sorting and filtering the raw data to remove unnecessary and inaccurate data. Raw data is checked for errors, duplication, miscalculations or missing data, and transformed into a suitable form for further analysis and processing.
  • 8.
  • 9.
    3. Data input In this step, the raw data is converted into machine readable form and fed into the processing unit. This can be in the form of data entry through a keyboard, scanner or any other input source.
  • 10.
    4. Processing  Dataprocessing is the collection and translation of a data set into valuable, usable information. Through this process, a researcher, data engineer or data scientist takes raw data and converts it into a more readable format, such as a graph, report or chart, either manually or through an automated tool.
  • 11.
    5. Data output Output is where the computer takes the pixels from the processing stage and displays them in a way that the user can see them. There are many kinds of output devices, such asprinters, screens, video and audio devices  The data is finally transmitted and displayed to the user in a readable form like graphs, tables, vector files, audio, video, documents, etc. This output can be stored and further processed in the next data processing cycle.
  • 12.
    6. Data Storage The last step of the data processing cycle is storage, where data and metadata are stored for further use. This allows for quick access and retrieval of information whenever needed, and also allows it to be used as input in the next data processing cycle directly.
  • 13.
    Five (5) ImportantSteps in processing data in research 1. EDITING OF DATA 2. CODING OF DATA 3. CLASSIFICATION OF DATA 4. TABULATION OF DATA 5. GRAPHING OF DATA
  • 14.
    EDITING OF DATA Data editing is defined as the process involving the review and adjustment of collected survey data.  It is defined as the process involving the review and adjustment of collected survey data.  Data editing helps define guidelines that will reduce potential bias and ensure consistent estimates leading to a clear analysis of the data set by correct inconsistent data using the methods later in this article.
  • 15.
    CODING OF DATA Coding is the process of labeling and organizing your qualitative data to identify different themes and the relationships between them.  the process of assigning some symbols (either) alphabetical or numerals or (both) to the answers so that the responses can be recorded into a limited number of classes or categories. The classes should be appropriate to the research problem being studied.
  • 16.
  • 17.
    CLASSIFICATION/ORGANIZING OF DATA Data Classificationis grouping data together with similar characteristics. Data classification isthe process of analyzing structured or unstructured data and organizing it into categories based on file type, contents, and other metadata.
  • 18.
    The bases ofclassification are the following:  Qualitative. Those having the same quality or are of the same kind are grouped together. The grouping element in the examples given under analysis is qualitative. See examples under analysis.  Quantitative. Data are grouped according to their quantity. In age, for instance, people may be grouped into ages of 10-14, 15-19, 20-24, 25-29, etc.  Geographical. Data may be classified according to their location for instance; the schools in the secondary level in Province A may be grouped by district, as District 1, District 2, District 3, etc.  Chronological. In this, data are classified according to the order of their occurrence. Example: The enrolments of the high schools of Province A may be classified according to school years, as for, instance, enrolments during the school years 1985-’86, 1986-’87, 1987-’88.
  • 19.
    TABULATION OF DATA Tabulationis a method of presenting numeric data in rows and columns in a logical and systematic manner to aid comparison and statistical analysis.
  • 20.
  • 21.
    GRAPHING OF DATA Graphical representation refers tothe use of charts and graphs to visually display, analyze, clarify, and interpret numerical data, functions, and other qualitative structures.  It a common method to visually illustrate relationships in the data. The purpose of a graph is to present data that are too numerous or complicated to be described adequately in the text and in less space.
  • 22.
  • 23.
    REFERENCES:  Aquino, GaudencioV. Essentials of Research and Thesis Writing. Quezon City: Alemars-Phoenix Publishing House, Inc., 1974  Manlapaz, Edna Z. and Ma. Eloisa N. Francisco. The College Research Paper. Manila:National Book Store, Inc., 1985.  https://www.simplilearn.com/what-is-data-processing-article  https://www.slideshare.net/CharleneEveSaligumba/presentation-of-data-t hesis-writing