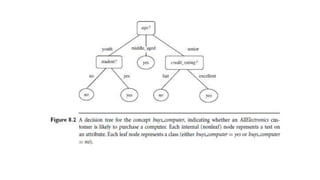
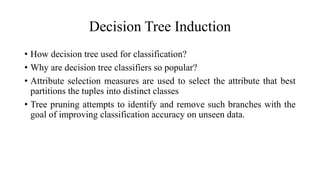
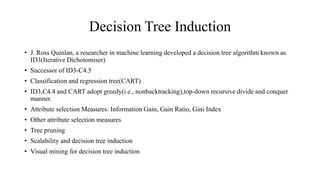
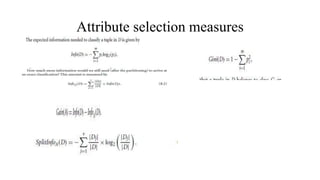
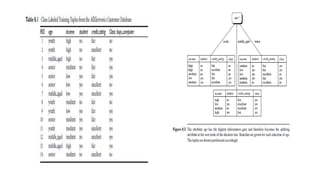
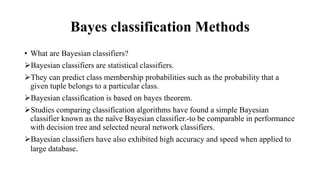
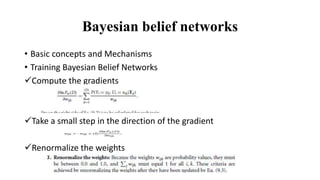
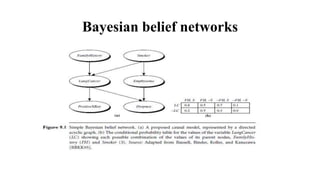
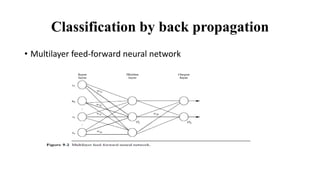
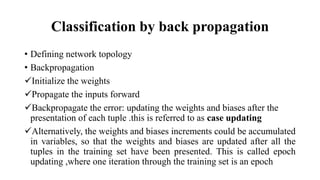
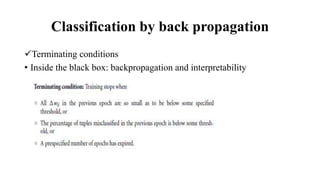
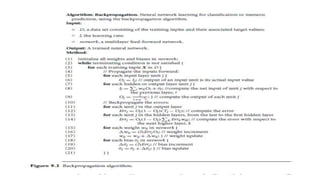
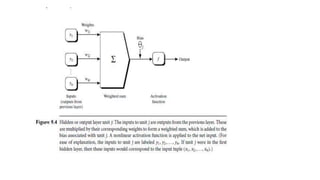
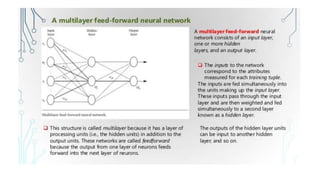
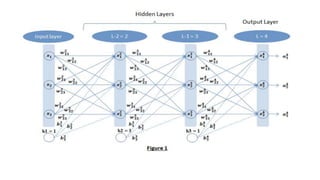
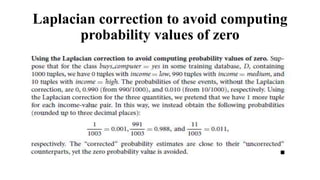
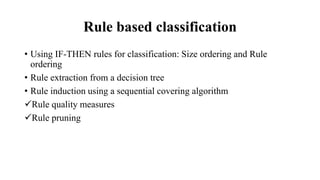
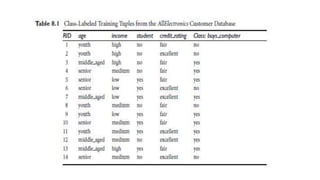
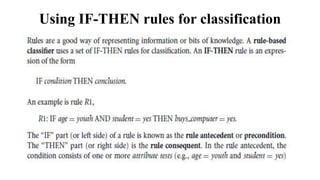
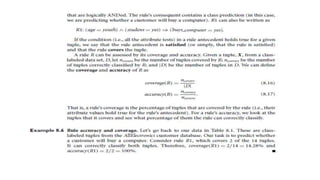
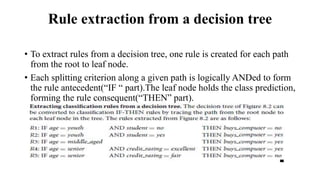
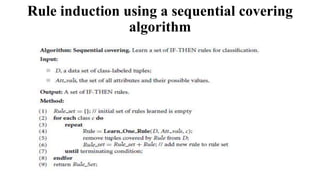
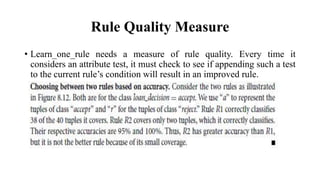
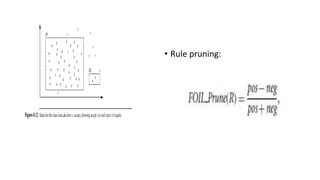
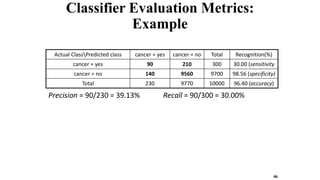
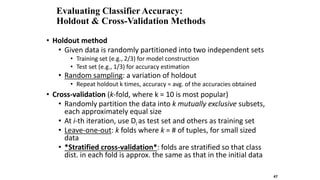
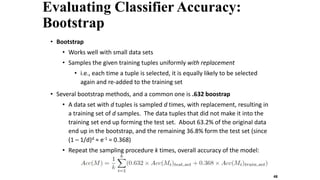
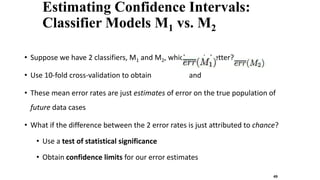
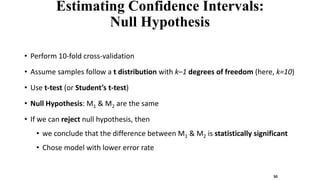
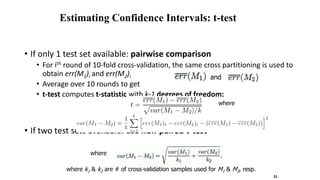
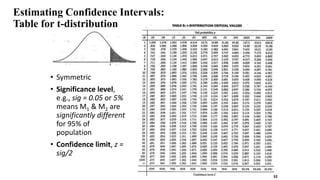
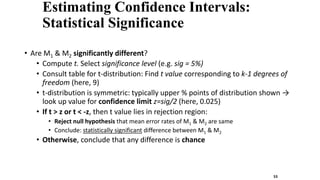
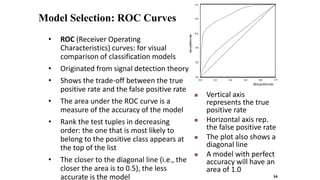
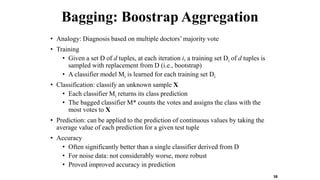
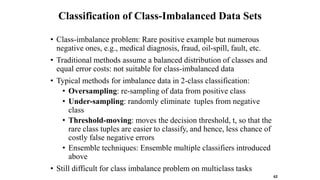
SlideShare a Scribd company logo
DATA MINING
TECHNIQUES
UNIT-IV
Classification-Basic Concept
• Decision Tree Induction – Bayes Classification Methods – Rule-Based Classification – Model Evaluation and
Selection – Techniques to improve Classification Accuracy - Bayesian Belief Networks – Classification by
Backpropagation.
• Classification and prediction are two forms of data analysis that can be used to extract models describing
important data classes or to predict future data trends
• Classification predicts categorical, discrete and unordered labels
• Prediction model –continuous valued functions
• eg,., bank loan application, all electronics
• Regression analysis is a statistical methodology that is most often used for numeric prediction.
• Data classification is a two step process
 Learning
 Classification
Classification-Basic Concept
• What is trained data and test data?
• What is supervised learning and unsupervised learning?
• Issues regarding classification and prediction
Pre processing the data for classification and prediction
Data cleaning
Relevance analysis
Data transformation and reduction-normalization
• Comparing classification and prediction methods
Accuracy , speed, robustness, scalability,interpretability
Decision Tree Induction
• Decision tree induction is the learning of decision tree from class-
labelled training tuples.
• A decision tree is a flow chart like tree structure where internal
node(non leaf node) denotes a test on an attribute, each branch
represents an outcome of the test and each leaf node(or terminal node)
holds a class label.
• The topmost node in a tree is the root node.
Decision Tree Induction
• How decision tree used for classification?
• Why are decision tree classifiers so popular?
• Attribute selection measures are used to select the attribute that best
partitions the tuples into distinct classes
• Tree pruning attempts to identify and remove such branches with the
goal of improving classification accuracy on unseen data.
Decision Tree Induction
• J. Ross Quinlan, a researcher in machine learning developed a decision tree algorithm known as
ID3(Iterative Dichotomiser)
• Successor of ID3-C4.5
• Classification and regression tree(CART)
• ID3,C4.4 and CART adopt greedy(i.e., nonbacktracking),top-down recursive divide and conquer
manner.
• Attribute selection Measures: Information Gain, Gain Ratio, Gini Index
• Other attribute selection measures
• Tree pruning
• Scalability and decision tree induction
• Visual mining for decision tree induction
Attribute selection measures
Bayes classification Methods
• What are Bayesian classifiers?
Bayesian classifiers are statistical classifiers.
They can predict class membership probabilities such as the probability that a
given tuple belongs to a particular class.
Bayesian classification is based on bayes theorem.
Studies comparing classification algorithms have found a simple Bayesian
classifier known as the naïve Bayesian classifier.-to be comparable in performance
with decision tree and selected neural network classifiers.
Bayesian classifiers have also exhibited high accuracy and speed when applied to
large database.
Bayes classification Methods
Naïve Bayesian classifiers assume that the effect of an attribute value
on a given class is independent of the values of the other attributes.
This assumption is called class conditional independence.
Bayes Theorem
Naïve Bayesian classification
Bayesian belief networks
Training Bayesian belief networks.
Bayesian belief networks
• Basic concepts and Mechanisms
• Training Bayesian Belief Networks
Compute the gradients
Take a small step in the direction of the gradient
Renormalize the weights
Bayesian belief networks
Classification by back propagation
• Multilayer feed-forward neural network
Classification by back propagation
• Defining network topology
• Backpropagation
Initialize the weights
Propagate the inputs forward
Backpropagate the error: updating the weights and biases after the
presentation of each tuple .this is referred to as case updating
Alternatively, the weights and biases increments could be accumulated
in variables, so that the weights and biases are updated after all the
tuples in the training set have been presented. This is called epoch
updating ,where one iteration through the training set is an epoch
Classification by back propagation
Terminating conditions
• Inside the black box: backpropagation and interpretability
Laplacian correction to avoid computing
probability values of zero
Rule based classification
• Using IF-THEN rules for classification: Size ordering and Rule
ordering
• Rule extraction from a decision tree
• Rule induction using a sequential covering algorithm
Rule quality measures
Rule pruning
Using IF-THEN rules for classification
Rule extraction from a decision tree
• To extract rules from a decision tree, one rule is created for each path
from the root to leaf node.
• Each splitting criterion along a given path is logically ANDed to form
the rule antecedent(“IF “ part).The leaf node holds the class prediction,
forming the rule consequent(“THEN” part).
Rule induction using a sequential covering
algorithm
Rule Quality Measure
• Learn_one_rule needs a measure of rule quality. Every time it
considers an attribute test, it must check to see if appending such a test
to the current rule’s condition will result in an improved rule.
• Rule pruning:
Model Evaluation and Selection
Choosing one classifier over another
• Metrics for evaluating classifier performance
Positive tuples(tuples of main class of interest)
Negative tuples(all other tuples)
• Holdout method and random subsampling
• Cross validation
• Bootstrap
• Model selection using statistical tests of significance
• Comparing classifiers based on cost-benefit and ROC curves
Metrics for evaluating classifier
performance
Model Evaluation and Selection
• Evaluation metrics: How can we measure accuracy? Other metrics to consider?
• Use validation test set of class-labeled tuples instead of training set when
assessing accuracy
• Methods for estimating a classifier’s accuracy:
• Holdout method, random subsampling
• Cross-validation
• Bootstrap
• Comparing classifiers:
• Confidence intervals
• Cost-benefit analysis and ROC Curves
Classifier Evaluation Metrics:
Confusion Matrix
Actual classPredicted
class
buy_computer
= yes
buy_computer
= no
Total
buy_computer = yes 6954 46 7000
buy_computer = no 412 2588 3000
Total 7366 2634 10000
• Given m classes, an entry, CMi,j in a confusion matrix indicates #
of tuples in class i that were labeled by the classifier as class j
• May have extra rows/columns to provide totals
Confusion Matrix:
Actual classPredicted class C1 ¬ C1
C1 True Positives (TP) False Negatives (FN)
¬ C1 False Positives (FP) True Negatives (TN)
Example of Confusion Matrix:
43
Classifier Evaluation Metrics: Accuracy, Error Rate,
Sensitivity and Specificity
• Classifier Accuracy, or recognition
rate: percentage of test set tuples
that are correctly classified
Accuracy = (TP + TN)/All
• Error rate: 1 – accuracy, or
Error rate = (FP + FN)/All
 Class Imbalance Problem:
 One class may be rare, e.g.
fraud, or HIV-positive
 Significant majority of the
negative class and minority of
the positive class
 Sensitivity: True Positive
recognition rate
 Sensitivity = TP/P
 Specificity: True Negative
recognition rate
 Specificity = TN/N
AP C ¬C
C TP FN P
¬C FP TN N
P’ N’ All
44
Classifier Evaluation Metrics:
Precision and Recall, and F-measures
• Precision: exactness – what % of tuples that the classifier
labeled as positive are actually positive
• Recall: completeness – what % of positive tuples did the
classifier label as positive?
• Perfect score is 1.0
• Inverse relationship between precision & recall
• F measure (F1 or F-score): harmonic mean of precision and
recall,
• Fß: weighted measure of precision and recall
• assigns ß times as much weight to recall as to precision
45
Classifier Evaluation Metrics:
Example
46
Precision = 90/230 = 39.13% Recall = 90/300 = 30.00%
Actual ClassPredicted class cancer = yes cancer = no Total Recognition(%)
cancer = yes 90 210 300 30.00 (sensitivity
cancer = no 140 9560 9700 98.56 (specificity)
Total 230 9770 10000 96.40 (accuracy)
Evaluating Classifier Accuracy:
Holdout & Cross-Validation Methods
• Holdout method
• Given data is randomly partitioned into two independent sets
• Training set (e.g., 2/3) for model construction
• Test set (e.g., 1/3) for accuracy estimation
• Random sampling: a variation of holdout
• Repeat holdout k times, accuracy = avg. of the accuracies obtained
• Cross-validation (k-fold, where k = 10 is most popular)
• Randomly partition the data into k mutually exclusive subsets,
each approximately equal size
• At i-th iteration, use Di as test set and others as training set
• Leave-one-out: k folds where k = # of tuples, for small sized
data
• *Stratified cross-validation*: folds are stratified so that class
dist. in each fold is approx. the same as that in the initial data
47
Evaluating Classifier Accuracy:
Bootstrap
• Bootstrap
• Works well with small data sets
• Samples the given training tuples uniformly with replacement
• i.e., each time a tuple is selected, it is equally likely to be selected
again and re-added to the training set
• Several bootstrap methods, and a common one is .632 boostrap
• A data set with d tuples is sampled d times, with replacement, resulting in
a training set of d samples. The data tuples that did not make it into the
training set end up forming the test set. About 63.2% of the original data
end up in the bootstrap, and the remaining 36.8% form the test set (since
(1 – 1/d)d ≈ e-1 = 0.368)
• Repeat the sampling procedure k times, overall accuracy of the model:
48
Estimating Confidence Intervals:
Classifier Models M1 vs. M2
• Suppose we have 2 classifiers, M1 and M2, which one is better?
• Use 10-fold cross-validation to obtain and
• These mean error rates are just estimates of error on the true population of
future data cases
• What if the difference between the 2 error rates is just attributed to chance?
• Use a test of statistical significance
• Obtain confidence limits for our error estimates
49
Estimating Confidence Intervals:
Null Hypothesis
• Perform 10-fold cross-validation
• Assume samples follow a t distribution with k–1 degrees of freedom (here, k=10)
• Use t-test (or Student’s t-test)
• Null Hypothesis: M1 & M2 are the same
• If we can reject null hypothesis, then
• we conclude that the difference between M1 & M2 is statistically significant
• Chose model with lower error rate
50
Estimating Confidence Intervals: t-test
• If only 1 test set available: pairwise comparison
• For ith round of 10-fold cross-validation, the same cross partitioning is used to
obtain err(M1)i and err(M2)i
• Average over 10 rounds to get
• t-test computes t-statistic with k-1 degrees of freedom:
• If two test sets available: use non-paired t-test
where
and
where
where k1 & k2 are # of cross-validation samples used for M1 & M2, resp.
51
Estimating Confidence Intervals:
Table for t-distribution
• Symmetric
• Significance level,
e.g., sig = 0.05 or 5%
means M1 & M2 are
significantly different
for 95% of
population
• Confidence limit, z =
sig/2
52
Estimating Confidence Intervals:
Statistical Significance
• Are M1 & M2 significantly different?
• Compute t. Select significance level (e.g. sig = 5%)
• Consult table for t-distribution: Find t value corresponding to k-1 degrees of
freedom (here, 9)
• t-distribution is symmetric: typically upper % points of distribution shown →
look up value for confidence limit z=sig/2 (here, 0.025)
• If t > z or t < -z, then t value lies in rejection region:
• Reject null hypothesis that mean error rates of M1 & M2 are same
• Conclude: statistically significant difference between M1 & M2
• Otherwise, conclude that any difference is chance
53
Model Selection: ROC Curves
• ROC (Receiver Operating
Characteristics) curves: for visual
comparison of classification models
• Originated from signal detection theory
• Shows the trade-off between the true
positive rate and the false positive rate
• The area under the ROC curve is a
measure of the accuracy of the model
• Rank the test tuples in decreasing
order: the one that is most likely to
belong to the positive class appears at
the top of the list
• The closer to the diagonal line (i.e., the
closer the area is to 0.5), the less
accurate is the model
 Vertical axis
represents the true
positive rate
 Horizontal axis rep.
the false positive rate
 The plot also shows a
diagonal line
 A model with perfect
accuracy will have an
area of 1.0
54
Issues Affecting Model Selection
• Accuracy
• classifier accuracy: predicting class label
• Speed
• time to construct the model (training time)
• time to use the model (classification/prediction time)
• Robustness: handling noise and missing values
• Scalability: efficiency in disk-resident databases
• Interpretability
• understanding and insight provided by the model
• Other measures, e.g., goodness of rules, such as decision tree
size or compactness of classification rules 55
Techniques to Improve Classification
Accuracy
• Introducing Ensemble Methods
• Bagging
• Boosting and AdaBoost
• Random forest
• Improving classification accuracy of class Imbalanced data
Ensemble Methods: Increasing the
Accuracy
• Ensemble methods
• Use a combination of models to increase accuracy
• Combine a series of k learned models, M1, M2, …, Mk, with
the aim of creating an improved model M*
• Popular ensemble methods
• Bagging: averaging the prediction over a collection of
classifiers
• Boosting: weighted vote with a collection of classifiers
• Ensemble: combining a set of heterogeneous classifiers
57
Bagging: Boostrap Aggregation
• Analogy: Diagnosis based on multiple doctors’ majority vote
• Training
• Given a set D of d tuples, at each iteration i, a training set Di of d tuples is
sampled with replacement from D (i.e., bootstrap)
• A classifier model Mi is learned for each training set Di
• Classification: classify an unknown sample X
• Each classifier Mi returns its class prediction
• The bagged classifier M* counts the votes and assigns the class with the
most votes to X
• Prediction: can be applied to the prediction of continuous values by taking the
average value of each prediction for a given test tuple
• Accuracy
• Often significantly better than a single classifier derived from D
• For noise data: not considerably worse, more robust
• Proved improved accuracy in prediction
58
Boosting
• Analogy: Consult several doctors, based on a combination of
weighted diagnoses—weight assigned based on the previous
diagnosis accuracy
• How boosting works?
• Weights are assigned to each training tuple
• A series of k classifiers is iteratively learned
• After a classifier Mi is learned, the weights are updated to
allow the subsequent classifier, Mi+1, to pay more attention to
the training tuples that were misclassified by Mi
• The final M* combines the votes of each individual classifier,
where the weight of each classifier's vote is a function of its
accuracy
• Boosting algorithm can be extended for numeric prediction
• Comparing with bagging: Boosting tends to have greater accuracy,
but it also risks overfitting the model to misclassified data 59
60
Adaboost (Freund and Schapire,
1997)
• Given a set of d class-labeled tuples, (X1, y1), …, (Xd, yd)
• Initially, all the weights of tuples are set the same (1/d)
• Generate k classifiers in k rounds. At round i,
• Tuples from D are sampled (with replacement) to form a training set Di
of the same size
• Each tuple’s chance of being selected is based on its weight
• A classification model Mi is derived from Di
• Its error rate is calculated using Di as a test set
• If a tuple is misclassified, its weight is increased, o.w. it is decreased
• Error rate: err(Xj) is the misclassification error of tuple Xj. Classifier Mi
error rate is the sum of the weights of the misclassified tuples:
• The weight of classifier Mi’s vote is )
(
)
(
1
log
i
i
M
error
M
error

 

d
j
j
i err
w
M
error )
(
)
( j
X
Random Forest (Breiman 2001)
• Random Forest:
• Each classifier in the ensemble is a decision tree classifier and is
generated using a random selection of attributes at each node to determine
the split
• During classification, each tree votes and the most popular class is
returned
• Two Methods to construct Random Forest:
• Forest-RI (random input selection): Randomly select, at each node, F
attributes as candidates for the split at the node. The CART methodology
is used to grow the trees to maximum size
• Forest-RC (random linear combinations): Creates new attributes (or
features) that are a linear combination of the existing attributes (reduces
the correlation between individual classifiers)
• Comparable in accuracy to Adaboost, but more robust to errors and outliers
• Insensitive to the number of attributes selected for consideration at each split,
and faster than bagging or boosting
61
Classification of Class-Imbalanced Data Sets
• Class-imbalance problem: Rare positive example but numerous
negative ones, e.g., medical diagnosis, fraud, oil-spill, fault, etc.
• Traditional methods assume a balanced distribution of classes and
equal error costs: not suitable for class-imbalanced data
• Typical methods for imbalance data in 2-class classification:
• Oversampling: re-sampling of data from positive class
• Under-sampling: randomly eliminate tuples from negative
class
• Threshold-moving: moves the decision threshold, t, so that the
rare class tuples are easier to classify, and hence, less chance of
costly false negative errors
• Ensemble techniques: Ensemble multiple classifiers introduced
above
• Still difficult for class imbalance problem on multiclass tasks
62

More Related Content

What's hot

04 Classification in Data Mining
04 Classification in Data Mining04 Classification in Data Mining
04 Classification in Data Mining
Valerii Klymchuk
 
Data Mining
Data MiningData Mining
Data Mining
Jay Nagar
 
Classification techniques in data mining
Classification techniques in data miningClassification techniques in data mining
Classification techniques in data mining
Kamal Acharya
 
Data mining Basics and complete description onword
Data mining Basics and complete description onwordData mining Basics and complete description onword
Data mining Basics and complete description onword
Sulman Ahmed
 
Data mining Basics and complete description
Data mining Basics and complete description Data mining Basics and complete description
Data mining Basics and complete description
Sulman Ahmed
 
Data Reduction
Data ReductionData Reduction
Data Reduction
Rajan Shah
 
Data mining
Data miningData mining
Data mining
Maulik Togadiya
 
Cluster analysis for market segmentation
Cluster analysis for market segmentationCluster analysis for market segmentation
Cluster analysis for market segmentation
Vishal Tandel
 
Clustering
ClusteringClustering
Clustering
M Rizwan Aqeel
 
Data mining-primitives-languages-and-system-architectures2641
Data mining-primitives-languages-and-system-architectures2641Data mining-primitives-languages-and-system-architectures2641
Data mining-primitives-languages-and-system-architectures2641Aiswaryadevi Jaganmohan
 
Data mining primitives
Data mining primitivesData mining primitives
Data mining primitives
lavanya marichamy
 
Data For Datamining
Data For DataminingData For Datamining
Data For Datamining
DataminingTools Inc
 
Survey on Various Classification Techniques in Data Mining
Survey on Various Classification Techniques in Data MiningSurvey on Various Classification Techniques in Data Mining
Survey on Various Classification Techniques in Data Mining
ijsrd.com
 
Cluster spss week7
Cluster spss week7Cluster spss week7
Cluster spss week7
Birat Sharma
 
Discretization and concept hierarchy(os)
Discretization and concept hierarchy(os)Discretization and concept hierarchy(os)
Discretization and concept hierarchy(os)
snegacmr
 
03 Data Mining Techniques
03 Data Mining Techniques03 Data Mining Techniques
03 Data Mining Techniques
Valerii Klymchuk
 
Clustering &amp; classification
Clustering &amp; classificationClustering &amp; classification
Clustering &amp; classification
Jamshed Khan
 
1.7 data reduction
1.7 data reduction1.7 data reduction
1.7 data reduction
Krish_ver2
 
Basics of Clustering
Basics of ClusteringBasics of Clustering
Basics of Clustering
B. Nichols
 

What's hot (20)

04 Classification in Data Mining
04 Classification in Data Mining04 Classification in Data Mining
04 Classification in Data Mining
 
Cluster analysis
Cluster analysisCluster analysis
Cluster analysis
 
Data Mining
Data MiningData Mining
Data Mining
 
Classification techniques in data mining
Classification techniques in data miningClassification techniques in data mining
Classification techniques in data mining
 
Data mining Basics and complete description onword
Data mining Basics and complete description onwordData mining Basics and complete description onword
Data mining Basics and complete description onword
 
Data mining Basics and complete description
Data mining Basics and complete description Data mining Basics and complete description
Data mining Basics and complete description
 
Data Reduction
Data ReductionData Reduction
Data Reduction
 
Data mining
Data miningData mining
Data mining
 
Cluster analysis for market segmentation
Cluster analysis for market segmentationCluster analysis for market segmentation
Cluster analysis for market segmentation
 
Clustering
ClusteringClustering
Clustering
 
Data mining-primitives-languages-and-system-architectures2641
Data mining-primitives-languages-and-system-architectures2641Data mining-primitives-languages-and-system-architectures2641
Data mining-primitives-languages-and-system-architectures2641
 
Data mining primitives
Data mining primitivesData mining primitives
Data mining primitives
 
Data For Datamining
Data For DataminingData For Datamining
Data For Datamining
 
Survey on Various Classification Techniques in Data Mining
Survey on Various Classification Techniques in Data MiningSurvey on Various Classification Techniques in Data Mining
Survey on Various Classification Techniques in Data Mining
 
Cluster spss week7
Cluster spss week7Cluster spss week7
Cluster spss week7
 
Discretization and concept hierarchy(os)
Discretization and concept hierarchy(os)Discretization and concept hierarchy(os)
Discretization and concept hierarchy(os)
 
03 Data Mining Techniques
03 Data Mining Techniques03 Data Mining Techniques
03 Data Mining Techniques
 
Clustering &amp; classification
Clustering &amp; classificationClustering &amp; classification
Clustering &amp; classification
 
1.7 data reduction
1.7 data reduction1.7 data reduction
1.7 data reduction
 
Basics of Clustering
Basics of ClusteringBasics of Clustering
Basics of Clustering
 

Similar to Data mining techniques unit iv

Machine learning algorithms for data mining
Machine learning algorithms for data miningMachine learning algorithms for data mining
Machine learning algorithms for data mining
Ashikur Rahman
 
UNIT 3: Data Warehousing and Data Mining
UNIT 3: Data Warehousing and Data MiningUNIT 3: Data Warehousing and Data Mining
UNIT 3: Data Warehousing and Data Mining
Nandakumar P
 
BTech Pattern Recognition Notes
BTech Pattern Recognition NotesBTech Pattern Recognition Notes
BTech Pattern Recognition Notes
Ashutosh Agrahari
 
crossvalidation.pptx
crossvalidation.pptxcrossvalidation.pptx
crossvalidation.pptx
PriyadharshiniG41
 
Statistical Learning and Model Selection (1).pptx
Statistical Learning and Model Selection (1).pptxStatistical Learning and Model Selection (1).pptx
Statistical Learning and Model Selection (1).pptx
rajalakshmi5921
 
dataminingclassificationprediction123 .pptx
dataminingclassificationprediction123 .pptxdataminingclassificationprediction123 .pptx
dataminingclassificationprediction123 .pptx
AsrithaKorupolu
 
Lect8 Classification & prediction
Lect8 Classification & predictionLect8 Classification & prediction
Lect8 Classification & prediction
hktripathy
 
Week 11 Model Evalaution Model Evaluation
Week 11 Model Evalaution Model EvaluationWeek 11 Model Evalaution Model Evaluation
Week 11 Model Evalaution Model Evaluation
khairulhuda242
 
Classification in Data Mining
Classification in Data MiningClassification in Data Mining
Classification in Data Mining
Rashmi Bhat
 
Classification Using Decision Trees and RulesChapter 5.docx
Classification Using Decision Trees and RulesChapter 5.docxClassification Using Decision Trees and RulesChapter 5.docx
Classification Using Decision Trees and RulesChapter 5.docx
monicafrancis71118
 
Introduction to Data Analysis for Nurse Researchers
Introduction to Data Analysis for Nurse ResearchersIntroduction to Data Analysis for Nurse Researchers
Introduction to Data Analysis for Nurse Researchers
Rupa Verma
 
Machine Learning
Machine LearningMachine Learning
Machine Learning
Girish Khanzode
 
Classification and Prediction.pptx
Classification and Prediction.pptxClassification and Prediction.pptx
Classification and Prediction.pptx
SandeepAgrawal84
 
Data mining chapter04and5-best
Data mining chapter04and5-bestData mining chapter04and5-best
Data mining chapter04and5-best
ABDUmomo
 
6 Evaluating Predictive Performance and ensemble.pptx
6 Evaluating Predictive Performance and ensemble.pptx6 Evaluating Predictive Performance and ensemble.pptx
6 Evaluating Predictive Performance and ensemble.pptx
mohammedalherwi1
 
classification in data mining and data warehousing.pdf
classification in data mining and data warehousing.pdfclassification in data mining and data warehousing.pdf
classification in data mining and data warehousing.pdf
321106410027
 
ML SFCSE.pptx
ML SFCSE.pptxML SFCSE.pptx
ML SFCSE.pptx
NIKHILGR3
 
Sampling and Data_Update.ppt
Sampling and Data_Update.pptSampling and Data_Update.ppt
Sampling and Data_Update.ppt
MdShohelRana69
 
Lecture 10 - Model Testing and Evaluation, a lecture in subject module Statis...
Lecture 10 - Model Testing and Evaluation, a lecture in subject module Statis...Lecture 10 - Model Testing and Evaluation, a lecture in subject module Statis...
Lecture 10 - Model Testing and Evaluation, a lecture in subject module Statis...
Maninda Edirisooriya
 

Similar to Data mining techniques unit iv (20)

Machine learning algorithms for data mining
Machine learning algorithms for data miningMachine learning algorithms for data mining
Machine learning algorithms for data mining
 
UNIT 3: Data Warehousing and Data Mining
UNIT 3: Data Warehousing and Data MiningUNIT 3: Data Warehousing and Data Mining
UNIT 3: Data Warehousing and Data Mining
 
BTech Pattern Recognition Notes
BTech Pattern Recognition NotesBTech Pattern Recognition Notes
BTech Pattern Recognition Notes
 
crossvalidation.pptx
crossvalidation.pptxcrossvalidation.pptx
crossvalidation.pptx
 
Statistical Learning and Model Selection (1).pptx
Statistical Learning and Model Selection (1).pptxStatistical Learning and Model Selection (1).pptx
Statistical Learning and Model Selection (1).pptx
 
dataminingclassificationprediction123 .pptx
dataminingclassificationprediction123 .pptxdataminingclassificationprediction123 .pptx
dataminingclassificationprediction123 .pptx
 
Lect8 Classification & prediction
Lect8 Classification & predictionLect8 Classification & prediction
Lect8 Classification & prediction
 
Week 11 Model Evalaution Model Evaluation
Week 11 Model Evalaution Model EvaluationWeek 11 Model Evalaution Model Evaluation
Week 11 Model Evalaution Model Evaluation
 
Classification in Data Mining
Classification in Data MiningClassification in Data Mining
Classification in Data Mining
 
Classification Using Decision Trees and RulesChapter 5.docx
Classification Using Decision Trees and RulesChapter 5.docxClassification Using Decision Trees and RulesChapter 5.docx
Classification Using Decision Trees and RulesChapter 5.docx
 
Introduction to Data Analysis for Nurse Researchers
Introduction to Data Analysis for Nurse ResearchersIntroduction to Data Analysis for Nurse Researchers
Introduction to Data Analysis for Nurse Researchers
 
Machine Learning
Machine LearningMachine Learning
Machine Learning
 
Classification and Prediction.pptx
Classification and Prediction.pptxClassification and Prediction.pptx
Classification and Prediction.pptx
 
Data mining chapter04and5-best
Data mining chapter04and5-bestData mining chapter04and5-best
Data mining chapter04and5-best
 
6 Evaluating Predictive Performance and ensemble.pptx
6 Evaluating Predictive Performance and ensemble.pptx6 Evaluating Predictive Performance and ensemble.pptx
6 Evaluating Predictive Performance and ensemble.pptx
 
classification in data mining and data warehousing.pdf
classification in data mining and data warehousing.pdfclassification in data mining and data warehousing.pdf
classification in data mining and data warehousing.pdf
 
ML SFCSE.pptx
ML SFCSE.pptxML SFCSE.pptx
ML SFCSE.pptx
 
Sampling and Data_Update.ppt
Sampling and Data_Update.pptSampling and Data_Update.ppt
Sampling and Data_Update.ppt
 
evaluation and credibility-Part 1
evaluation and credibility-Part 1evaluation and credibility-Part 1
evaluation and credibility-Part 1
 
Lecture 10 - Model Testing and Evaluation, a lecture in subject module Statis...
Lecture 10 - Model Testing and Evaluation, a lecture in subject module Statis...Lecture 10 - Model Testing and Evaluation, a lecture in subject module Statis...
Lecture 10 - Model Testing and Evaluation, a lecture in subject module Statis...
 

More from malathieswaran29

Data mining techniques unit III
Data mining techniques unit IIIData mining techniques unit III
Data mining techniques unit III
malathieswaran29
 
Data mining techniques unit 1
Data mining techniques  unit 1Data mining techniques  unit 1
Data mining techniques unit 1
malathieswaran29
 
Bitcoin data mining
Bitcoin data miningBitcoin data mining
Bitcoin data mining
malathieswaran29
 
Principles of management organizing & reengineering
Principles of management organizing & reengineeringPrinciples of management organizing & reengineering
Principles of management organizing & reengineering
malathieswaran29
 
Principles of management human factor & motivation
Principles of management human factor & motivationPrinciples of management human factor & motivation
Principles of management human factor & motivation
malathieswaran29
 
Principles given by fayol
Principles given by fayolPrinciples given by fayol
Principles given by fayol
malathieswaran29
 
Software maintenance real world maintenance cost
Software maintenance real world maintenance costSoftware maintenance real world maintenance cost
Software maintenance real world maintenance cost
malathieswaran29
 
SOFTWARE MAINTENANCE -4
SOFTWARE MAINTENANCE -4SOFTWARE MAINTENANCE -4
SOFTWARE MAINTENANCE -4
malathieswaran29
 
SOFTWARE MAINTENANCE -3
SOFTWARE MAINTENANCE -3SOFTWARE MAINTENANCE -3
SOFTWARE MAINTENANCE -3
malathieswaran29
 
SOFTWARE MAINTENANCE -2
SOFTWARE MAINTENANCE -2SOFTWARE MAINTENANCE -2
SOFTWARE MAINTENANCE -2
malathieswaran29
 
SOFTWARE MAINTENANCE -1
SOFTWARE MAINTENANCE -1SOFTWARE MAINTENANCE -1
SOFTWARE MAINTENANCE -1
malathieswaran29
 
SOFTWARE MAINTENANCE- 5
SOFTWARE MAINTENANCE- 5SOFTWARE MAINTENANCE- 5
SOFTWARE MAINTENANCE- 5
malathieswaran29
 

More from malathieswaran29 (12)

Data mining techniques unit III
Data mining techniques unit IIIData mining techniques unit III
Data mining techniques unit III
 
Data mining techniques unit 1
Data mining techniques  unit 1Data mining techniques  unit 1
Data mining techniques unit 1
 
Bitcoin data mining
Bitcoin data miningBitcoin data mining
Bitcoin data mining
 
Principles of management organizing & reengineering
Principles of management organizing & reengineeringPrinciples of management organizing & reengineering
Principles of management organizing & reengineering
 
Principles of management human factor & motivation
Principles of management human factor & motivationPrinciples of management human factor & motivation
Principles of management human factor & motivation
 
Principles given by fayol
Principles given by fayolPrinciples given by fayol
Principles given by fayol
 
Software maintenance real world maintenance cost
Software maintenance real world maintenance costSoftware maintenance real world maintenance cost
Software maintenance real world maintenance cost
 
SOFTWARE MAINTENANCE -4
SOFTWARE MAINTENANCE -4SOFTWARE MAINTENANCE -4
SOFTWARE MAINTENANCE -4
 
SOFTWARE MAINTENANCE -3
SOFTWARE MAINTENANCE -3SOFTWARE MAINTENANCE -3
SOFTWARE MAINTENANCE -3
 
SOFTWARE MAINTENANCE -2
SOFTWARE MAINTENANCE -2SOFTWARE MAINTENANCE -2
SOFTWARE MAINTENANCE -2
 
SOFTWARE MAINTENANCE -1
SOFTWARE MAINTENANCE -1SOFTWARE MAINTENANCE -1
SOFTWARE MAINTENANCE -1
 
SOFTWARE MAINTENANCE- 5
SOFTWARE MAINTENANCE- 5SOFTWARE MAINTENANCE- 5
SOFTWARE MAINTENANCE- 5
 

Recently uploaded

block diagram and signal flow graph representation
block diagram and signal flow graph representationblock diagram and signal flow graph representation
block diagram and signal flow graph representation
Divya Somashekar
 
WATER CRISIS and its solutions-pptx 1234
WATER CRISIS and its solutions-pptx 1234WATER CRISIS and its solutions-pptx 1234
WATER CRISIS and its solutions-pptx 1234
AafreenAbuthahir2
 
Final project report on grocery store management system..pdf
Final project report on grocery store management system..pdfFinal project report on grocery store management system..pdf
Final project report on grocery store management system..pdf
Kamal Acharya
 
Hierarchical Digital Twin of a Naval Power System
Hierarchical Digital Twin of a Naval Power SystemHierarchical Digital Twin of a Naval Power System
Hierarchical Digital Twin of a Naval Power System
Kerry Sado
 
NO1 Uk best vashikaran specialist in delhi vashikaran baba near me online vas...
NO1 Uk best vashikaran specialist in delhi vashikaran baba near me online vas...NO1 Uk best vashikaran specialist in delhi vashikaran baba near me online vas...
NO1 Uk best vashikaran specialist in delhi vashikaran baba near me online vas...
Amil Baba Dawood bangali
 
Fundamentals of Electric Drives and its applications.pptx
Fundamentals of Electric Drives and its applications.pptxFundamentals of Electric Drives and its applications.pptx
Fundamentals of Electric Drives and its applications.pptx
manasideore6
 
Planning Of Procurement o different goods and services
Planning Of Procurement o different goods and servicesPlanning Of Procurement o different goods and services
Planning Of Procurement o different goods and services
JoytuBarua2
 
Sachpazis:Terzaghi Bearing Capacity Estimation in simple terms with Calculati...
Sachpazis:Terzaghi Bearing Capacity Estimation in simple terms with Calculati...Sachpazis:Terzaghi Bearing Capacity Estimation in simple terms with Calculati...
Sachpazis:Terzaghi Bearing Capacity Estimation in simple terms with Calculati...
Dr.Costas Sachpazis
 
一比一原版(SFU毕业证)西蒙菲莎大学毕业证成绩单如何办理
一比一原版(SFU毕业证)西蒙菲莎大学毕业证成绩单如何办理一比一原版(SFU毕业证)西蒙菲莎大学毕业证成绩单如何办理
一比一原版(SFU毕业证)西蒙菲莎大学毕业证成绩单如何办理
bakpo1
 
Student information management system project report ii.pdf
Student information management system project report ii.pdfStudent information management system project report ii.pdf
Student information management system project report ii.pdf
Kamal Acharya
 
Industrial Training at Shahjalal Fertilizer Company Limited (SFCL)
Industrial Training at Shahjalal Fertilizer Company Limited (SFCL)Industrial Training at Shahjalal Fertilizer Company Limited (SFCL)
Industrial Training at Shahjalal Fertilizer Company Limited (SFCL)
MdTanvirMahtab2
 
Pile Foundation by Venkatesh Taduvai (Sub Geotechnical Engineering II)-conver...
Pile Foundation by Venkatesh Taduvai (Sub Geotechnical Engineering II)-conver...Pile Foundation by Venkatesh Taduvai (Sub Geotechnical Engineering II)-conver...
Pile Foundation by Venkatesh Taduvai (Sub Geotechnical Engineering II)-conver...
AJAYKUMARPUND1
 
H.Seo, ICLR 2024, MLILAB, KAIST AI.pdf
H.Seo,  ICLR 2024, MLILAB,  KAIST AI.pdfH.Seo,  ICLR 2024, MLILAB,  KAIST AI.pdf
H.Seo, ICLR 2024, MLILAB, KAIST AI.pdf
MLILAB
 
ASME IX(9) 2007 Full Version .pdf
ASME IX(9)  2007 Full Version       .pdfASME IX(9)  2007 Full Version       .pdf
ASME IX(9) 2007 Full Version .pdf
AhmedHussein950959
 
weather web application report.pdf
weather web application report.pdfweather web application report.pdf
weather web application report.pdf
Pratik Pawar
 
CFD Simulation of By-pass Flow in a HRSG module by R&R Consult.pptx
CFD Simulation of By-pass Flow in a HRSG module by R&R Consult.pptxCFD Simulation of By-pass Flow in a HRSG module by R&R Consult.pptx
CFD Simulation of By-pass Flow in a HRSG module by R&R Consult.pptx
R&R Consult
 
Runway Orientation Based on the Wind Rose Diagram.pptx
Runway Orientation Based on the Wind Rose Diagram.pptxRunway Orientation Based on the Wind Rose Diagram.pptx
Runway Orientation Based on the Wind Rose Diagram.pptx
SupreethSP4
 
Nuclear Power Economics and Structuring 2024
Nuclear Power Economics and Structuring 2024Nuclear Power Economics and Structuring 2024
Nuclear Power Economics and Structuring 2024
Massimo Talia
 
Governing Equations for Fundamental Aerodynamics_Anderson2010.pdf
Governing Equations for Fundamental Aerodynamics_Anderson2010.pdfGoverning Equations for Fundamental Aerodynamics_Anderson2010.pdf
Governing Equations for Fundamental Aerodynamics_Anderson2010.pdf
WENKENLI1
 
一比一原版(UofT毕业证)多伦多大学毕业证成绩单如何办理
一比一原版(UofT毕业证)多伦多大学毕业证成绩单如何办理一比一原版(UofT毕业证)多伦多大学毕业证成绩单如何办理
一比一原版(UofT毕业证)多伦多大学毕业证成绩单如何办理
ydteq
 

Recently uploaded (20)

block diagram and signal flow graph representation
block diagram and signal flow graph representationblock diagram and signal flow graph representation
block diagram and signal flow graph representation
 
WATER CRISIS and its solutions-pptx 1234
WATER CRISIS and its solutions-pptx 1234WATER CRISIS and its solutions-pptx 1234
WATER CRISIS and its solutions-pptx 1234
 
Final project report on grocery store management system..pdf
Final project report on grocery store management system..pdfFinal project report on grocery store management system..pdf
Final project report on grocery store management system..pdf
 
Hierarchical Digital Twin of a Naval Power System
Hierarchical Digital Twin of a Naval Power SystemHierarchical Digital Twin of a Naval Power System
Hierarchical Digital Twin of a Naval Power System
 
NO1 Uk best vashikaran specialist in delhi vashikaran baba near me online vas...
NO1 Uk best vashikaran specialist in delhi vashikaran baba near me online vas...NO1 Uk best vashikaran specialist in delhi vashikaran baba near me online vas...
NO1 Uk best vashikaran specialist in delhi vashikaran baba near me online vas...
 
Fundamentals of Electric Drives and its applications.pptx
Fundamentals of Electric Drives and its applications.pptxFundamentals of Electric Drives and its applications.pptx
Fundamentals of Electric Drives and its applications.pptx
 
Planning Of Procurement o different goods and services
Planning Of Procurement o different goods and servicesPlanning Of Procurement o different goods and services
Planning Of Procurement o different goods and services
 
Sachpazis:Terzaghi Bearing Capacity Estimation in simple terms with Calculati...
Sachpazis:Terzaghi Bearing Capacity Estimation in simple terms with Calculati...Sachpazis:Terzaghi Bearing Capacity Estimation in simple terms with Calculati...
Sachpazis:Terzaghi Bearing Capacity Estimation in simple terms with Calculati...
 
一比一原版(SFU毕业证)西蒙菲莎大学毕业证成绩单如何办理
一比一原版(SFU毕业证)西蒙菲莎大学毕业证成绩单如何办理一比一原版(SFU毕业证)西蒙菲莎大学毕业证成绩单如何办理
一比一原版(SFU毕业证)西蒙菲莎大学毕业证成绩单如何办理
 
Student information management system project report ii.pdf
Student information management system project report ii.pdfStudent information management system project report ii.pdf
Student information management system project report ii.pdf
 
Industrial Training at Shahjalal Fertilizer Company Limited (SFCL)
Industrial Training at Shahjalal Fertilizer Company Limited (SFCL)Industrial Training at Shahjalal Fertilizer Company Limited (SFCL)
Industrial Training at Shahjalal Fertilizer Company Limited (SFCL)
 
Pile Foundation by Venkatesh Taduvai (Sub Geotechnical Engineering II)-conver...
Pile Foundation by Venkatesh Taduvai (Sub Geotechnical Engineering II)-conver...Pile Foundation by Venkatesh Taduvai (Sub Geotechnical Engineering II)-conver...
Pile Foundation by Venkatesh Taduvai (Sub Geotechnical Engineering II)-conver...
 
H.Seo, ICLR 2024, MLILAB, KAIST AI.pdf
H.Seo,  ICLR 2024, MLILAB,  KAIST AI.pdfH.Seo,  ICLR 2024, MLILAB,  KAIST AI.pdf
H.Seo, ICLR 2024, MLILAB, KAIST AI.pdf
 
ASME IX(9) 2007 Full Version .pdf
ASME IX(9)  2007 Full Version       .pdfASME IX(9)  2007 Full Version       .pdf
ASME IX(9) 2007 Full Version .pdf
 
weather web application report.pdf
weather web application report.pdfweather web application report.pdf
weather web application report.pdf
 
CFD Simulation of By-pass Flow in a HRSG module by R&R Consult.pptx
CFD Simulation of By-pass Flow in a HRSG module by R&R Consult.pptxCFD Simulation of By-pass Flow in a HRSG module by R&R Consult.pptx
CFD Simulation of By-pass Flow in a HRSG module by R&R Consult.pptx
 
Runway Orientation Based on the Wind Rose Diagram.pptx
Runway Orientation Based on the Wind Rose Diagram.pptxRunway Orientation Based on the Wind Rose Diagram.pptx
Runway Orientation Based on the Wind Rose Diagram.pptx
 
Nuclear Power Economics and Structuring 2024
Nuclear Power Economics and Structuring 2024Nuclear Power Economics and Structuring 2024
Nuclear Power Economics and Structuring 2024
 
Governing Equations for Fundamental Aerodynamics_Anderson2010.pdf
Governing Equations for Fundamental Aerodynamics_Anderson2010.pdfGoverning Equations for Fundamental Aerodynamics_Anderson2010.pdf
Governing Equations for Fundamental Aerodynamics_Anderson2010.pdf
 
一比一原版(UofT毕业证)多伦多大学毕业证成绩单如何办理
一比一原版(UofT毕业证)多伦多大学毕业证成绩单如何办理一比一原版(UofT毕业证)多伦多大学毕业证成绩单如何办理
一比一原版(UofT毕业证)多伦多大学毕业证成绩单如何办理
 

Data mining techniques unit iv

  • 2. Classification-Basic Concept • Decision Tree Induction – Bayes Classification Methods – Rule-Based Classification – Model Evaluation and Selection – Techniques to improve Classification Accuracy - Bayesian Belief Networks – Classification by Backpropagation. • Classification and prediction are two forms of data analysis that can be used to extract models describing important data classes or to predict future data trends • Classification predicts categorical, discrete and unordered labels • Prediction model –continuous valued functions • eg,., bank loan application, all electronics • Regression analysis is a statistical methodology that is most often used for numeric prediction. • Data classification is a two step process  Learning  Classification
  • 3. Classification-Basic Concept • What is trained data and test data? • What is supervised learning and unsupervised learning? • Issues regarding classification and prediction Pre processing the data for classification and prediction Data cleaning Relevance analysis Data transformation and reduction-normalization • Comparing classification and prediction methods Accuracy , speed, robustness, scalability,interpretability
  • 4.
  • 5. Decision Tree Induction • Decision tree induction is the learning of decision tree from class- labelled training tuples. • A decision tree is a flow chart like tree structure where internal node(non leaf node) denotes a test on an attribute, each branch represents an outcome of the test and each leaf node(or terminal node) holds a class label. • The topmost node in a tree is the root node.
  • 6.
  • 7. Decision Tree Induction • How decision tree used for classification? • Why are decision tree classifiers so popular? • Attribute selection measures are used to select the attribute that best partitions the tuples into distinct classes • Tree pruning attempts to identify and remove such branches with the goal of improving classification accuracy on unseen data.
  • 8. Decision Tree Induction • J. Ross Quinlan, a researcher in machine learning developed a decision tree algorithm known as ID3(Iterative Dichotomiser) • Successor of ID3-C4.5 • Classification and regression tree(CART) • ID3,C4.4 and CART adopt greedy(i.e., nonbacktracking),top-down recursive divide and conquer manner. • Attribute selection Measures: Information Gain, Gain Ratio, Gini Index • Other attribute selection measures • Tree pruning • Scalability and decision tree induction • Visual mining for decision tree induction
  • 10.
  • 11.
  • 12.
  • 13.
  • 14.
  • 15. Bayes classification Methods • What are Bayesian classifiers? Bayesian classifiers are statistical classifiers. They can predict class membership probabilities such as the probability that a given tuple belongs to a particular class. Bayesian classification is based on bayes theorem. Studies comparing classification algorithms have found a simple Bayesian classifier known as the naïve Bayesian classifier.-to be comparable in performance with decision tree and selected neural network classifiers. Bayesian classifiers have also exhibited high accuracy and speed when applied to large database.
  • 16. Bayes classification Methods Naïve Bayesian classifiers assume that the effect of an attribute value on a given class is independent of the values of the other attributes. This assumption is called class conditional independence. Bayes Theorem Naïve Bayesian classification Bayesian belief networks Training Bayesian belief networks.
  • 17. Bayesian belief networks • Basic concepts and Mechanisms • Training Bayesian Belief Networks Compute the gradients Take a small step in the direction of the gradient Renormalize the weights
  • 19. Classification by back propagation • Multilayer feed-forward neural network
  • 20. Classification by back propagation • Defining network topology • Backpropagation Initialize the weights Propagate the inputs forward Backpropagate the error: updating the weights and biases after the presentation of each tuple .this is referred to as case updating Alternatively, the weights and biases increments could be accumulated in variables, so that the weights and biases are updated after all the tuples in the training set have been presented. This is called epoch updating ,where one iteration through the training set is an epoch
  • 21. Classification by back propagation Terminating conditions • Inside the black box: backpropagation and interpretability
  • 22.
  • 23.
  • 24.
  • 25.
  • 26.
  • 27.
  • 28. Laplacian correction to avoid computing probability values of zero
  • 29. Rule based classification • Using IF-THEN rules for classification: Size ordering and Rule ordering • Rule extraction from a decision tree • Rule induction using a sequential covering algorithm Rule quality measures Rule pruning
  • 30.
  • 31. Using IF-THEN rules for classification
  • 32.
  • 33. Rule extraction from a decision tree • To extract rules from a decision tree, one rule is created for each path from the root to leaf node. • Each splitting criterion along a given path is logically ANDed to form the rule antecedent(“IF “ part).The leaf node holds the class prediction, forming the rule consequent(“THEN” part).
  • 34. Rule induction using a sequential covering algorithm
  • 35.
  • 36. Rule Quality Measure • Learn_one_rule needs a measure of rule quality. Every time it considers an attribute test, it must check to see if appending such a test to the current rule’s condition will result in an improved rule.
  • 38. Model Evaluation and Selection Choosing one classifier over another • Metrics for evaluating classifier performance Positive tuples(tuples of main class of interest) Negative tuples(all other tuples) • Holdout method and random subsampling • Cross validation • Bootstrap • Model selection using statistical tests of significance • Comparing classifiers based on cost-benefit and ROC curves
  • 39. Metrics for evaluating classifier performance
  • 40.
  • 41.
  • 42. Model Evaluation and Selection • Evaluation metrics: How can we measure accuracy? Other metrics to consider? • Use validation test set of class-labeled tuples instead of training set when assessing accuracy • Methods for estimating a classifier’s accuracy: • Holdout method, random subsampling • Cross-validation • Bootstrap • Comparing classifiers: • Confidence intervals • Cost-benefit analysis and ROC Curves
  • 43. Classifier Evaluation Metrics: Confusion Matrix Actual classPredicted class buy_computer = yes buy_computer = no Total buy_computer = yes 6954 46 7000 buy_computer = no 412 2588 3000 Total 7366 2634 10000 • Given m classes, an entry, CMi,j in a confusion matrix indicates # of tuples in class i that were labeled by the classifier as class j • May have extra rows/columns to provide totals Confusion Matrix: Actual classPredicted class C1 ¬ C1 C1 True Positives (TP) False Negatives (FN) ¬ C1 False Positives (FP) True Negatives (TN) Example of Confusion Matrix: 43
  • 44. Classifier Evaluation Metrics: Accuracy, Error Rate, Sensitivity and Specificity • Classifier Accuracy, or recognition rate: percentage of test set tuples that are correctly classified Accuracy = (TP + TN)/All • Error rate: 1 – accuracy, or Error rate = (FP + FN)/All  Class Imbalance Problem:  One class may be rare, e.g. fraud, or HIV-positive  Significant majority of the negative class and minority of the positive class  Sensitivity: True Positive recognition rate  Sensitivity = TP/P  Specificity: True Negative recognition rate  Specificity = TN/N AP C ¬C C TP FN P ¬C FP TN N P’ N’ All 44
  • 45. Classifier Evaluation Metrics: Precision and Recall, and F-measures • Precision: exactness – what % of tuples that the classifier labeled as positive are actually positive • Recall: completeness – what % of positive tuples did the classifier label as positive? • Perfect score is 1.0 • Inverse relationship between precision & recall • F measure (F1 or F-score): harmonic mean of precision and recall, • Fß: weighted measure of precision and recall • assigns ß times as much weight to recall as to precision 45
  • 46. Classifier Evaluation Metrics: Example 46 Precision = 90/230 = 39.13% Recall = 90/300 = 30.00% Actual ClassPredicted class cancer = yes cancer = no Total Recognition(%) cancer = yes 90 210 300 30.00 (sensitivity cancer = no 140 9560 9700 98.56 (specificity) Total 230 9770 10000 96.40 (accuracy)
  • 47. Evaluating Classifier Accuracy: Holdout & Cross-Validation Methods • Holdout method • Given data is randomly partitioned into two independent sets • Training set (e.g., 2/3) for model construction • Test set (e.g., 1/3) for accuracy estimation • Random sampling: a variation of holdout • Repeat holdout k times, accuracy = avg. of the accuracies obtained • Cross-validation (k-fold, where k = 10 is most popular) • Randomly partition the data into k mutually exclusive subsets, each approximately equal size • At i-th iteration, use Di as test set and others as training set • Leave-one-out: k folds where k = # of tuples, for small sized data • *Stratified cross-validation*: folds are stratified so that class dist. in each fold is approx. the same as that in the initial data 47
  • 48. Evaluating Classifier Accuracy: Bootstrap • Bootstrap • Works well with small data sets • Samples the given training tuples uniformly with replacement • i.e., each time a tuple is selected, it is equally likely to be selected again and re-added to the training set • Several bootstrap methods, and a common one is .632 boostrap • A data set with d tuples is sampled d times, with replacement, resulting in a training set of d samples. The data tuples that did not make it into the training set end up forming the test set. About 63.2% of the original data end up in the bootstrap, and the remaining 36.8% form the test set (since (1 – 1/d)d ≈ e-1 = 0.368) • Repeat the sampling procedure k times, overall accuracy of the model: 48
  • 49. Estimating Confidence Intervals: Classifier Models M1 vs. M2 • Suppose we have 2 classifiers, M1 and M2, which one is better? • Use 10-fold cross-validation to obtain and • These mean error rates are just estimates of error on the true population of future data cases • What if the difference between the 2 error rates is just attributed to chance? • Use a test of statistical significance • Obtain confidence limits for our error estimates 49
  • 50. Estimating Confidence Intervals: Null Hypothesis • Perform 10-fold cross-validation • Assume samples follow a t distribution with k–1 degrees of freedom (here, k=10) • Use t-test (or Student’s t-test) • Null Hypothesis: M1 & M2 are the same • If we can reject null hypothesis, then • we conclude that the difference between M1 & M2 is statistically significant • Chose model with lower error rate 50
  • 51. Estimating Confidence Intervals: t-test • If only 1 test set available: pairwise comparison • For ith round of 10-fold cross-validation, the same cross partitioning is used to obtain err(M1)i and err(M2)i • Average over 10 rounds to get • t-test computes t-statistic with k-1 degrees of freedom: • If two test sets available: use non-paired t-test where and where where k1 & k2 are # of cross-validation samples used for M1 & M2, resp. 51
  • 52. Estimating Confidence Intervals: Table for t-distribution • Symmetric • Significance level, e.g., sig = 0.05 or 5% means M1 & M2 are significantly different for 95% of population • Confidence limit, z = sig/2 52
  • 53. Estimating Confidence Intervals: Statistical Significance • Are M1 & M2 significantly different? • Compute t. Select significance level (e.g. sig = 5%) • Consult table for t-distribution: Find t value corresponding to k-1 degrees of freedom (here, 9) • t-distribution is symmetric: typically upper % points of distribution shown → look up value for confidence limit z=sig/2 (here, 0.025) • If t > z or t < -z, then t value lies in rejection region: • Reject null hypothesis that mean error rates of M1 & M2 are same • Conclude: statistically significant difference between M1 & M2 • Otherwise, conclude that any difference is chance 53
  • 54. Model Selection: ROC Curves • ROC (Receiver Operating Characteristics) curves: for visual comparison of classification models • Originated from signal detection theory • Shows the trade-off between the true positive rate and the false positive rate • The area under the ROC curve is a measure of the accuracy of the model • Rank the test tuples in decreasing order: the one that is most likely to belong to the positive class appears at the top of the list • The closer to the diagonal line (i.e., the closer the area is to 0.5), the less accurate is the model  Vertical axis represents the true positive rate  Horizontal axis rep. the false positive rate  The plot also shows a diagonal line  A model with perfect accuracy will have an area of 1.0 54
  • 55. Issues Affecting Model Selection • Accuracy • classifier accuracy: predicting class label • Speed • time to construct the model (training time) • time to use the model (classification/prediction time) • Robustness: handling noise and missing values • Scalability: efficiency in disk-resident databases • Interpretability • understanding and insight provided by the model • Other measures, e.g., goodness of rules, such as decision tree size or compactness of classification rules 55
  • 56. Techniques to Improve Classification Accuracy • Introducing Ensemble Methods • Bagging • Boosting and AdaBoost • Random forest • Improving classification accuracy of class Imbalanced data
  • 57. Ensemble Methods: Increasing the Accuracy • Ensemble methods • Use a combination of models to increase accuracy • Combine a series of k learned models, M1, M2, …, Mk, with the aim of creating an improved model M* • Popular ensemble methods • Bagging: averaging the prediction over a collection of classifiers • Boosting: weighted vote with a collection of classifiers • Ensemble: combining a set of heterogeneous classifiers 57
  • 58. Bagging: Boostrap Aggregation • Analogy: Diagnosis based on multiple doctors’ majority vote • Training • Given a set D of d tuples, at each iteration i, a training set Di of d tuples is sampled with replacement from D (i.e., bootstrap) • A classifier model Mi is learned for each training set Di • Classification: classify an unknown sample X • Each classifier Mi returns its class prediction • The bagged classifier M* counts the votes and assigns the class with the most votes to X • Prediction: can be applied to the prediction of continuous values by taking the average value of each prediction for a given test tuple • Accuracy • Often significantly better than a single classifier derived from D • For noise data: not considerably worse, more robust • Proved improved accuracy in prediction 58
  • 59. Boosting • Analogy: Consult several doctors, based on a combination of weighted diagnoses—weight assigned based on the previous diagnosis accuracy • How boosting works? • Weights are assigned to each training tuple • A series of k classifiers is iteratively learned • After a classifier Mi is learned, the weights are updated to allow the subsequent classifier, Mi+1, to pay more attention to the training tuples that were misclassified by Mi • The final M* combines the votes of each individual classifier, where the weight of each classifier's vote is a function of its accuracy • Boosting algorithm can be extended for numeric prediction • Comparing with bagging: Boosting tends to have greater accuracy, but it also risks overfitting the model to misclassified data 59
  • 60. 60 Adaboost (Freund and Schapire, 1997) • Given a set of d class-labeled tuples, (X1, y1), …, (Xd, yd) • Initially, all the weights of tuples are set the same (1/d) • Generate k classifiers in k rounds. At round i, • Tuples from D are sampled (with replacement) to form a training set Di of the same size • Each tuple’s chance of being selected is based on its weight • A classification model Mi is derived from Di • Its error rate is calculated using Di as a test set • If a tuple is misclassified, its weight is increased, o.w. it is decreased • Error rate: err(Xj) is the misclassification error of tuple Xj. Classifier Mi error rate is the sum of the weights of the misclassified tuples: • The weight of classifier Mi’s vote is ) ( ) ( 1 log i i M error M error     d j j i err w M error ) ( ) ( j X
  • 61. Random Forest (Breiman 2001) • Random Forest: • Each classifier in the ensemble is a decision tree classifier and is generated using a random selection of attributes at each node to determine the split • During classification, each tree votes and the most popular class is returned • Two Methods to construct Random Forest: • Forest-RI (random input selection): Randomly select, at each node, F attributes as candidates for the split at the node. The CART methodology is used to grow the trees to maximum size • Forest-RC (random linear combinations): Creates new attributes (or features) that are a linear combination of the existing attributes (reduces the correlation between individual classifiers) • Comparable in accuracy to Adaboost, but more robust to errors and outliers • Insensitive to the number of attributes selected for consideration at each split, and faster than bagging or boosting 61
  • 62. Classification of Class-Imbalanced Data Sets • Class-imbalance problem: Rare positive example but numerous negative ones, e.g., medical diagnosis, fraud, oil-spill, fault, etc. • Traditional methods assume a balanced distribution of classes and equal error costs: not suitable for class-imbalanced data • Typical methods for imbalance data in 2-class classification: • Oversampling: re-sampling of data from positive class • Under-sampling: randomly eliminate tuples from negative class • Threshold-moving: moves the decision threshold, t, so that the rare class tuples are easier to classify, and hence, less chance of costly false negative errors • Ensemble techniques: Ensemble multiple classifiers introduced above • Still difficult for class imbalance problem on multiclass tasks 62