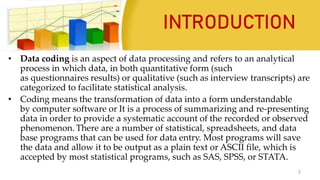
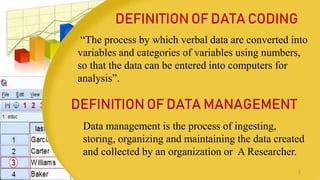
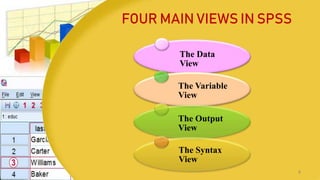
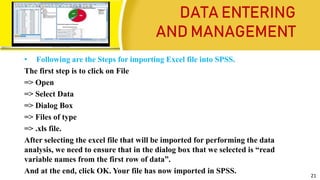
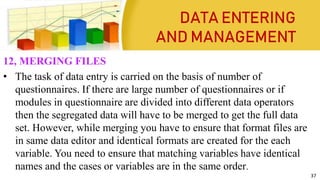
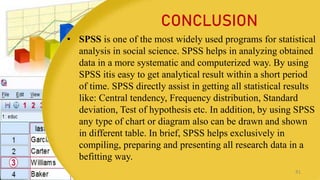
DATA CODING
AND DATA
MANAGEMENT
USING SPSS
Mrs. D. Melba Sahaya Sweety RN,RM
PhD Nursing , MSc Nursing (Pediatric Nursing), BSc Nursing
Associate Professor
Department of Pediatric Nursing
Enam Nursing College, Savar,
Bangladesh.
1
INTRODUCTION
• Data coding is an aspect of data processing and refers to an analytical
process in which data, in both quantitative form (such
as questionnaires results) or qualitative (such as interview transcripts) are
categorized to facilitate statistical analysis.
• Coding means the transformation of data into a form understandable
by computer software or It is a process of summarizing and re-presenting
data in order to provide a systematic account of the recorded or observed
phenomenon. There are a number of statistical, spreadsheets, and data
base programs that can be used for data entry. Most programs will save
the data and allow it to be output as a plain text or ASCII file, which is
accepted by most statistical programs, such as SAS, SPSS, or STATA.
2
DEFINITION OF DATA CODING
“The process by which verbal data are converted into
variables and categories of variables using numbers,
so that the data can be entered into computers for
analysis”.
Data management is the process of ingesting,
storing, organizing and maintaining the data created
and collected by an organization or A Researcher.
DEFINITION OF DATA MANAGEMENT
3
FOUR MAIN VIEWS IN SPSS
The Data
View
The Variable
View
The Output
View
The Syntax
View
4
DATA VIEW
• There are two types of ways to view data in SPSS and these can be changed using
the “Data View” and “Variable View” tabs on the very bottom left of the window.
• The “Data View” tab shows the variables in columns and each observation in rows,
which is most useful to look at the actual values presented in the dataset.
•
DATA VIEW IN SPSS
5
Many of the features of Data View are similar to the features that are found in
spreadsheet applications. There are, however, several important distinctions:
 Rows are cases. Each row represents a case or an observation. For example,
each individual respondent to a questionnaire is a case.
 Columns are variables. Each column represents a variable or characteristic that
is being measured. For example, each item on a questionnaire is a variable.
 Cells contain values. Each cell contains a single value of a variable for a case.
The cell is where the case and the variable intersect. Cells contain only data
values. Unlike spreadsheet programs, cells in the Data Editor cannot contain
formulas. 6
DATA VIEW
DATA VIEW IN SPSS
 The data file is rectangular. The dimensions of the data file are
determined by the number of cases and variables. You can enter data in
any cell. If you enter data in a cell outside the boundaries of the defined
data file, the data rectangle is extended to include any rows and/or
columns between that cell and the file boundaries. There are no “empty”
cells within the boundaries of the data file. For numeric variables, blank
cells are converted to the system-missing value. For string variables, a
blank is considered a valid value.
7
DATA VIEW
DATA VIEW IN SPSS
Variable: It is a characteristics of an item and is represented as column
in SPSS.
Variable View: The screen within the SPSS Data Editor where the
characteristics of variables are assigned.
• In order to define variables for entering data set you have to select
variable view button from bottom left corner of data editor window.
• In this Variable View, you can adjust the properties of each of your
variables under 10 categories: Name, Type, Width, Decimals, Label,
Values, Missing, Columns, Align and Measure.
VARIABLE VIEW IN SPSS
VARIABLE VIEW
8
VARIABLE VIEW
VARIABLE VIEW IN SPSS
9
VARIABLE VIEW
Name :
 The name should be a short and clear name for the variable. It cannot start with a
number, cannot contain a space, and some special characters (e.g. %) are also not
allowed. Each Variable name must be unique and less than 64 characters. The name
will be the shown as the column title for the variable in the Data View. For the
question 'What is your age?' one possible name might simply be age.
 To change a variable's name, double-click on the name of the variable that you wish
to re-name. Type your new variable name.
Type:
 At type the data type of the variable. There are 8 options: Numeric, Comma, Dot,
Scientific notation, Date, Dollar, Custom currency, and String. If the scores are
numbers the type should be numeric, if it is a date, the type should be date, etc.
VARIABLE VIEW IN SPSS
10
VARIABLE VIEW
 One small catch is that if you plan on assigning
a numeric code to your values (e.g. 1 = male
and 2 = female), you will then be typing in
numbers so the type should be set to numeric.
For text you can set the type to string.
 To change a variable's type, click inside the
cell corresponding to the “Type” column for
that variable. A square "..." button will appear;
click on it to open the Variable Type window.
Click the option that best matches the type of
variable. Click OK.
VARIABLE VIEW IN SPSS
11
VARIABLE VIEW
Width :
 This column indicates the number of characters available for the variable values.
For numeric variables this is not of any influence, but for string variables you will
need to guess how many characters you might need. For example if I ask for a pet
name, the pet name Fluffy Bun, would require 6 spaces for Fluffy, 1 for the space
and 3 for Bun, so 10 in total.
 To set a variable's width, click inside the cell corresponding to the “Width”
column for that variable. Then click the "up" or "down" arrow icons to increase
or decrease the number width.
VARIABLE VIEW IN SPSS
12
VARIABLE VIEW
Decimals:
 The number of digits to display after a decimal point for values of that variable.
Does not apply to string variables. Note that this changes how the numbers are
displayed, but does not change the values in the dataset.
 To specify the number of decimal places for a numeric variable, click inside the
cell corresponding to the “Decimals” column for that variable. Then click the
“up” or “down” arrow icons to increase or decrease the number of decimal
places.
 Example: If you specify that values should have two decimal points, they will
display as 1.00, 2.00, 3.00, and so on.
VARIABLE VIEW IN SPSS
13
VARIABLE VIEW
Label:
A brief but descriptive definition or display name for the variable. When defined, a
variable's label will appear in the output in place of its name.. Some even simply
copy the entire question here.
Values:
Value labels are useful primarily for categorical (i.e., nominal or ordinal) variables,
especially if they have been recorded as codes (e.g., 1, 2, 3). (e.g. 1 = Male, 2 =
Female). Assign numbers if the type has been set to Numeric.
Under the column “Values,” click the cell that corresponds to the variable whose
values you wish to label. If the values are currently undefined, the cell will say
“None.” Click the square “…” button. The Value Labels window appears.
VARIABLE VIEW IN SPSS
14
VARIABLE VIEW
VARIABLE VIEW IN SPSS
Type the first possible value (1) for your
variable in the Value field. In
the Label field type the label exactly as you
want it to display (e.g., "Freshman").
Click Add when you are finished defining the
value and label. Your variable value and label
will appear in the center box. Repeat these
steps for each possible value for your variable.
When all of the labels have been defined, the
Value Labels window should look like this:
Click OK at the bottom of the window.
15
VARIABLE VIEW
Missing:
This parameter allows you to specify a code for missing
values. You might get missing values if people refuse to
answer a particular question on a questionnaire. To set a
code for missing values, click in a cell within the
“Missing” column (the cell row should correspond to the
variable for which you wish to code missing values).
Click on the ellipsis, and the following dialog box will
appear.
Select “Discrete missing values”, and input a value that
doesn’t conflict with the data in your data set. We’ve
entered 999, because nobody is 999 years old.
VARIABLE VIEW IN SPSS
16
VARIABLE VIEW
Columns:
 This parameter relates to the width of the column in the Data View grid. To
increase or decrease the size of the column, click up or down on the arrow icon.
Align:
 The alignment of content in the cells of the SPSS Data View spreadsheet. Options
include left-justified, right-justified, or center-justified.
 To set the alignment for a variable, click inside the cell corresponding to the
"Align" column for that variable. Then use the drop-down menu to select your
preferred alignment: Left, Right, or Center.
VARIABLE VIEW IN SPSS
17
VARIABLE VIEW
Role:
• The role that a variable will play in your analyses (i.e., independent variable,
dependent variable, both independent and dependent). Some options in SPSS
allow you to pre-select variables for particular analyses based on their
defined roles. Any variable that meets the role requirements will be available
for use in such analyses. You can choose from the following roles for each
variable:
• Input: The variable will be used as a predictor (independent variable). This
is the default assignment for variables.
• Target: The variable will be used as an outcome (dependent variable).
VARIABLE VIEW IN SPSS
18
VARIABLE VIEW
• Both: The variable will be used as both a predictor and an
outcome (independent and dependent variable).
• None: The variable has no role assignment.
• Partition: The variable will partition the data into separate
samples.
• Split: Used with the IBM® SPSS® Modeler (not IBM® SPSS®
Statistics).
To define a variable's role in your analysis, click inside the cell
corresponding to the “Role” column for that variable. Then use the
drop-down menu to select the role that variable will take: Input,
Target, Both, None, Partition, or Split.
VARIABLE VIEW IN SPSS
19
DATA ENTERING
AND MANAGEMENT
Data plays a significant role in any research. Therefore As a researchers it is necessary to
manage the data in SPSS so that the collected data can facilitate statistical analysis. This part
will help you in entering data, storing data, sorting data, data aggregation etc. and other related
procedures.
1, ENTERING DATA
• After creating the variables data would be entered in the Data View. You can enter data by
variable or by case. You may enter the data in the data editor as you do it in Ms Excel and
enter the values accordingly. First click on the first empty cell under the first variable, type
the value and then press the Down Arrow Key, then type the next number. Instead of Down
Arrow Key you can also use Enter Key and while entering data by case you may use Right-
Arrow Key or TAB key
20
DATA ENTERING
AND MANAGEMENT
• Following are the Steps for importing Excel file into SPSS.
The first step is to click on File
=> Open
=> Select Data
=> Dialog Box
=> Files of type
=> .xls file.
After selecting the excel file that will be imported for performing the data
analysis, we need to ensure that in the dialog box that we selected is “read
variable names from the first row of data”.
And at the end, click OK. Your file has now imported in SPSS.
21
DATA ENTERING
AND MANAGEMENT
2, EDITING DATA
• For editing any value while entering data you simply have to click on the cell of interest,
type the new value and then hit enter. When a file has many variables and if you want one or
two column always visible then you have to place the cursor at the bottom right of the
screen, look for a small area to the right of the vertical scroll bar and drag the line to the
column or variable you want to refer while entering data.
3, MANAGING DATA FILES AND DATA MANOEUVRING
• In this part of unit you would be grounded with the tools and techniques for data
management. Since for analyzing the data from different perspectives or dimensions you
need to derive required data from the original data file. Once all the data is entered you can
save the data file by clicking File Menu and Save and then you have to enter the name of the
file and choose the location and then press save. The file will save with an extension .sav. 22
DATA ENTERING
AND MANAGEMENT
Manipulation or Manoeuvred of the Data- To enter SPSS a click on
Start in the task bar activates the start menu. After clicking the SPSS
programme you could create and name a data file or edit an already
existing file. The data can be manoeuvred using the tools mentioned
from 1.6.4 to 1.6. 14.
4, SPLITTING FILES
Split file command is useful for performing same statistical analysis on
separate groups based on the values of one or more grouping variables.
For example if data is collected on several characteristics of households 23
DATA ENTERING
AND MANAGEMENT
and the so collected data is grouped by
gender, ethnicity, income and category,
then Spilt File Command can be used.
Split file command has two options
Compare options and organize output by
groups. You can choose the options as per
the requirement of research questions. For
example, if you select Gender as grouping
variable, you can find descriptive statistics
like mean, median, standard deviation
separately for Males and Females.
24
DATA ENTERING
AND MANAGEMENT
• For splitting the file you have to first click Data from the Command
menu and the select split file, you will get a dialogue box after this you
will select Organize output by groups and move gender from the
variable list box to the Groups Based on list box, then click OK. The
file will be sorted on the basis of Gender Value in ascending order. To
find out the descriptive for age, income, occupation or any other
variable separately for males or females, you just have to use single
command of descriptive statistics. This command executes same
statistical tests to be performed on different categories of respondents in
the same dataset. 25
DATA ENTERING
AND MANAGEMENT
• Further, when you will execute the command you have to ensure that
you select the “Sort the file by grouping variables”. Further if you
have already sorted the file on the basis of gender then you click to
“File is Already Sorted”.
• By selecting Compare groups, results for both males and females
will appear in the same output table.
• By selecting Organize output by groups the group’s results will
be displayed on two separate tables denoting one for each group.
26
DATA ENTERING
AND MANAGEMENT
5, IDENTIFYING DUPLICATE CASES
This is used to track errors in data entry “Identify Duplicate Command” helps us in detecting
existence of duplicate entries while adding data into SPSS. This is also termed as Data
Cleaning. For doing this go through the following path:
• Data from Command Menu Identify Duplicate Cases from Drop Down Menu
Select the variables Post them into Define Matching cases Ok
The output would be displayed in the output viewer window.
6, IDENTIFYING UNUSUAL CASES
This function will help you in identifying unusual behavior of samples which deviate from the
group norms to which they belong to. You can track those using the following path:
27
DATA ENTERING
AND MANAGEMENT
You can track those using the following path:
• Identify Unusual cases Select the Analysis variables for selecting the variables
on the basis you want to perform the task Select the case identifier
variable Ok
7, SELECTING CERTAIN CASES AND INSERTING CASES
Selecting a portion of the data for analysis is frequently used by researchers. The
usage of Select cases helps in selecting a subset of data for analysis. It can also
perform analysis on Random Sample of Cases. For example, if you want to perform
what the mean total score is for females, then you needs to follow the path mentioned
as under-
28
DATA ENTERING
AND MANAGEMENT
• Data Select cases If condition is satisfied
If In If then click gender mention =1 and then press
continue and O.K
Further, if you want to cross check identified cases that are
selected then it is easily recognizable by the diagonal line
placed through the row number for the non selected cases. In
this example, the lines through case number represent males
in the sample. Further, SPSS also creates a new variable
named filter_$ which codes selected cases as 1 and non
selected cases as 0. Moreover, if you will select ALL cases
option then the Select Case will automatically get turn off.
29
DATA ENTERING
AND MANAGEMENT
• If you need to insert case or variables then you can use
Insert cases or Insert Variables from Edit menu in the tool
bar. You will then have to click to any cell in the case below
the position where you wish to insert the new case and click
insert cases from edit menu. On the other hand if you want
to insert any cell in variable to the right of the position
where you want to insert the new variable and click insert
variable from edit menu.
30
DATA ENTERING
AND MANAGEMENT
8, DATAAGGREGATION
• If you want to aggregate the data collected cumulatively like you might have collected data
on entrance test marks attained in English language Comprehension, Reasoning,
Mathematics and General Knowledge and you want to know their mean score or knowing
the highest level of total marks attained then it is possible in SPSS, using aggregate
command. This command performs arithmetic or statistical operations on similar categories
of respondents. Functions like sum, maximum, mean etc. can be calculated for cases or
respondents with the identical attributes.
Path:
• Data Aggregate Break Variable Select the Variable Browse and Select
the File Summaries of Variable Function
31
DATA ENTERING
AND MANAGEMENT
• In Break Variable you have to specify the level variable (Marks on different
parameters) on which aggregation is to be performed. Then in “Select The
Variable” you have to select Score in Entrance Examination and transfer it
into the Summaries of Variables list box. Then you have to click Function
button then another dialogue box will open in which you can select mean,
maximum, that you want to perform on the variable and click continue. In
Save Frame you have to select Create a new dataset containing only the
Aggregated variables and give some name to the dataset. In options, for
very large datasets, select Sort File before aggregating and then OK. A new
file will be formed on the applying the aggregate command.
32
DATA ENTERING
AND MANAGEMENT
9, RECODING VARIABLES
• This procedure also creates new variables by dividing a pre existing variable into
categories and coding each category differently. Recode sub menu of Transform
menu have two options i.e recode into same variables or recode into different
variables, when you choose same variables then the original values would get
replaced with the new recoded values. In second option both the values old and
new would be available.
• For example if the Head of the Department wants to divide the scores attained by
the candidates in entrance test into different grades. In this, coding is based on the
percent variable and now you want to recode the score variable in class of 40 to
50=1, 50 to 60= 2, 60 to70=3, 70-80=4, 80-90 =5 and 90 to 100= 6 . 33
DATA ENTERING
AND MANAGEMENT
• Now in this case Click transform go to Recode into different
variables. A dialogue box would appear. Click on the variable which
you want to recode and take it to Numeric Variable -> Output
variable and mention new variable name and then click Change.
• Your next step would be clicking Old and new values button. Click
Range Lowest through Value button and mention the number you
want to depict in new value box . Repeat this step for all the values
and then click continue and O.K to execute the command.
34
DATA ENTERING
AND MANAGEMENT
10, INSERTING NEW VARIABLES
• If you want to insert cases or variables then you can use insert cases or insert variables from
edit menu in the tool bar. You have to left click your mouse below the row where you want
to insert case then go to the Data drop down menu and select Insert Case or you can select
any cell in the variable to the right of the position you want to insert the new variable and
click insert variable from edit menu. Note: Here case denotes a row.
11, DELETING VARIABLES AND CASES
• If you want to delete cases or variables then you have to pick clear from the Edit Menu in
the tool bar. You have to click on the case number on the left side of row or select any cell in
the row in which you want to delete and then click clear from the edit menu. Further, if you
want to delete a variable then select the variable name that is the column in which you want
to delete and then click clear from the edit menu. 35
DATA ENTERING
AND MANAGEMENT
12, SORTING CASES
• If you want to sort cases then you
have to select a variable of interest
and specify which case you want to
sort in ascending or descending in
the Sort Cases Window which
would be located in Data Menu
36
DATA ENTERING
AND MANAGEMENT
12, MERGING FILES
• The task of data entry is carried on the basis of number of
questionnaires. If there are large number of questionnaires or if
modules in questionnaire are divided into different data operators
then the segregated data will have to be merged to get the full data
set. However, while merging you have to ensure that format files are
in same data editor and identical formats are created for the each
variable. You need to ensure that matching variables have identical
names and the cases or variables are in the same order.
37
DATA ENTERING AND
MANAGEMENT
13, MERGING FILES BY CASES
It will be used if different operators are given different sets of full
questionnaires for data entry. Here each respondent is a case. For the same
you have to first access the file in which you want to merge and then you
have to click Data then Merge Files and then Add Cases. Path:
• Data Merge Files Add Cases An External SPSS
Data File Browse and Select the File Continue
• dialogue box would appear on the screen. Variables in the New Active
Dataset list box would be the list of variables in the active dataset as well
as new dataset. If there are some variables in the external file which are
not in the active dataset then those variables would be listed in the
Unpaired Variables. After this you have to click the OK button to execute
the command. 38
14, MERGING FILES BY VARIABLES
• It is used when there are different data entry operators enter data of
different modules of questionnaire of the same set of respondents but for
different questions. For this you have to add variables to the Master file
for preparing complete data set. The procedure would be that first you
have to access the file in which you want to merge and then you have to
click Data then Merge Files and then Add Variables
• Path:
Data Merge Files Add Variables An External
SPSS Data File Browse and Select the File
Continue
39
DATA ENTERING AND
MANAGEMENT
A dialogue box would appear on the screen as Add variables from ……….
With the name and source of your external file included in the title. The
matching variables will be listed in the Excluded Variables Window and each
will be followed by a “+” sign in parentheses. Further, the variables that are
in the original file that are not present in the external file are listed in the
New Active Dataset Window and each one will be followed by an asterisk
“*” in parentheses.
It is required that the matching variables shall be in the same order
identically for both the file. You have to then click to Match Cases on Key
Variables in sorted files. Select the matching variable in the box to the left
click the arrow button and then, click OK.
40
DATA ENTERING AND
MANAGEMENT
CONCLUSION
• SPSS is one of the most widely used programs for statistical
analysis in social science. SPSS helps in analyzing obtained
data in a more systematic and computerized way. By using
SPSS itis easy to get analytical result within a short period
of time. SPSS directly assist in getting all statistical results
like: Central tendency, Frequency distribution, Standard
deviation, Test of hypothesis etc. In addition, by using SPSS
any type of chart or diagram also can be drawn and shown
in different table. In brief, SPSS helps exclusively in
compiling, preparing and presenting all research data in a
befitting way.
41
42

Data Coding and Data Management using SPSS

  • 1.
    DATA CODING AND DATA MANAGEMENT USINGSPSS Mrs. D. Melba Sahaya Sweety RN,RM PhD Nursing , MSc Nursing (Pediatric Nursing), BSc Nursing Associate Professor Department of Pediatric Nursing Enam Nursing College, Savar, Bangladesh. 1
  • 2.
    INTRODUCTION • Data codingis an aspect of data processing and refers to an analytical process in which data, in both quantitative form (such as questionnaires results) or qualitative (such as interview transcripts) are categorized to facilitate statistical analysis. • Coding means the transformation of data into a form understandable by computer software or It is a process of summarizing and re-presenting data in order to provide a systematic account of the recorded or observed phenomenon. There are a number of statistical, spreadsheets, and data base programs that can be used for data entry. Most programs will save the data and allow it to be output as a plain text or ASCII file, which is accepted by most statistical programs, such as SAS, SPSS, or STATA. 2
  • 3.
    DEFINITION OF DATACODING “The process by which verbal data are converted into variables and categories of variables using numbers, so that the data can be entered into computers for analysis”. Data management is the process of ingesting, storing, organizing and maintaining the data created and collected by an organization or A Researcher. DEFINITION OF DATA MANAGEMENT 3
  • 4.
    FOUR MAIN VIEWSIN SPSS The Data View The Variable View The Output View The Syntax View 4
  • 5.
    DATA VIEW • Thereare two types of ways to view data in SPSS and these can be changed using the “Data View” and “Variable View” tabs on the very bottom left of the window. • The “Data View” tab shows the variables in columns and each observation in rows, which is most useful to look at the actual values presented in the dataset. • DATA VIEW IN SPSS 5
  • 6.
    Many of thefeatures of Data View are similar to the features that are found in spreadsheet applications. There are, however, several important distinctions:  Rows are cases. Each row represents a case or an observation. For example, each individual respondent to a questionnaire is a case.  Columns are variables. Each column represents a variable or characteristic that is being measured. For example, each item on a questionnaire is a variable.  Cells contain values. Each cell contains a single value of a variable for a case. The cell is where the case and the variable intersect. Cells contain only data values. Unlike spreadsheet programs, cells in the Data Editor cannot contain formulas. 6 DATA VIEW DATA VIEW IN SPSS
  • 7.
     The datafile is rectangular. The dimensions of the data file are determined by the number of cases and variables. You can enter data in any cell. If you enter data in a cell outside the boundaries of the defined data file, the data rectangle is extended to include any rows and/or columns between that cell and the file boundaries. There are no “empty” cells within the boundaries of the data file. For numeric variables, blank cells are converted to the system-missing value. For string variables, a blank is considered a valid value. 7 DATA VIEW DATA VIEW IN SPSS
  • 8.
    Variable: It isa characteristics of an item and is represented as column in SPSS. Variable View: The screen within the SPSS Data Editor where the characteristics of variables are assigned. • In order to define variables for entering data set you have to select variable view button from bottom left corner of data editor window. • In this Variable View, you can adjust the properties of each of your variables under 10 categories: Name, Type, Width, Decimals, Label, Values, Missing, Columns, Align and Measure. VARIABLE VIEW IN SPSS VARIABLE VIEW 8
  • 9.
  • 10.
    VARIABLE VIEW Name : The name should be a short and clear name for the variable. It cannot start with a number, cannot contain a space, and some special characters (e.g. %) are also not allowed. Each Variable name must be unique and less than 64 characters. The name will be the shown as the column title for the variable in the Data View. For the question 'What is your age?' one possible name might simply be age.  To change a variable's name, double-click on the name of the variable that you wish to re-name. Type your new variable name. Type:  At type the data type of the variable. There are 8 options: Numeric, Comma, Dot, Scientific notation, Date, Dollar, Custom currency, and String. If the scores are numbers the type should be numeric, if it is a date, the type should be date, etc. VARIABLE VIEW IN SPSS 10
  • 11.
    VARIABLE VIEW  Onesmall catch is that if you plan on assigning a numeric code to your values (e.g. 1 = male and 2 = female), you will then be typing in numbers so the type should be set to numeric. For text you can set the type to string.  To change a variable's type, click inside the cell corresponding to the “Type” column for that variable. A square "..." button will appear; click on it to open the Variable Type window. Click the option that best matches the type of variable. Click OK. VARIABLE VIEW IN SPSS 11
  • 12.
    VARIABLE VIEW Width : This column indicates the number of characters available for the variable values. For numeric variables this is not of any influence, but for string variables you will need to guess how many characters you might need. For example if I ask for a pet name, the pet name Fluffy Bun, would require 6 spaces for Fluffy, 1 for the space and 3 for Bun, so 10 in total.  To set a variable's width, click inside the cell corresponding to the “Width” column for that variable. Then click the "up" or "down" arrow icons to increase or decrease the number width. VARIABLE VIEW IN SPSS 12
  • 13.
    VARIABLE VIEW Decimals:  Thenumber of digits to display after a decimal point for values of that variable. Does not apply to string variables. Note that this changes how the numbers are displayed, but does not change the values in the dataset.  To specify the number of decimal places for a numeric variable, click inside the cell corresponding to the “Decimals” column for that variable. Then click the “up” or “down” arrow icons to increase or decrease the number of decimal places.  Example: If you specify that values should have two decimal points, they will display as 1.00, 2.00, 3.00, and so on. VARIABLE VIEW IN SPSS 13
  • 14.
    VARIABLE VIEW Label: A briefbut descriptive definition or display name for the variable. When defined, a variable's label will appear in the output in place of its name.. Some even simply copy the entire question here. Values: Value labels are useful primarily for categorical (i.e., nominal or ordinal) variables, especially if they have been recorded as codes (e.g., 1, 2, 3). (e.g. 1 = Male, 2 = Female). Assign numbers if the type has been set to Numeric. Under the column “Values,” click the cell that corresponds to the variable whose values you wish to label. If the values are currently undefined, the cell will say “None.” Click the square “…” button. The Value Labels window appears. VARIABLE VIEW IN SPSS 14
  • 15.
    VARIABLE VIEW VARIABLE VIEWIN SPSS Type the first possible value (1) for your variable in the Value field. In the Label field type the label exactly as you want it to display (e.g., "Freshman"). Click Add when you are finished defining the value and label. Your variable value and label will appear in the center box. Repeat these steps for each possible value for your variable. When all of the labels have been defined, the Value Labels window should look like this: Click OK at the bottom of the window. 15
  • 16.
    VARIABLE VIEW Missing: This parameterallows you to specify a code for missing values. You might get missing values if people refuse to answer a particular question on a questionnaire. To set a code for missing values, click in a cell within the “Missing” column (the cell row should correspond to the variable for which you wish to code missing values). Click on the ellipsis, and the following dialog box will appear. Select “Discrete missing values”, and input a value that doesn’t conflict with the data in your data set. We’ve entered 999, because nobody is 999 years old. VARIABLE VIEW IN SPSS 16
  • 17.
    VARIABLE VIEW Columns:  Thisparameter relates to the width of the column in the Data View grid. To increase or decrease the size of the column, click up or down on the arrow icon. Align:  The alignment of content in the cells of the SPSS Data View spreadsheet. Options include left-justified, right-justified, or center-justified.  To set the alignment for a variable, click inside the cell corresponding to the "Align" column for that variable. Then use the drop-down menu to select your preferred alignment: Left, Right, or Center. VARIABLE VIEW IN SPSS 17
  • 18.
    VARIABLE VIEW Role: • Therole that a variable will play in your analyses (i.e., independent variable, dependent variable, both independent and dependent). Some options in SPSS allow you to pre-select variables for particular analyses based on their defined roles. Any variable that meets the role requirements will be available for use in such analyses. You can choose from the following roles for each variable: • Input: The variable will be used as a predictor (independent variable). This is the default assignment for variables. • Target: The variable will be used as an outcome (dependent variable). VARIABLE VIEW IN SPSS 18
  • 19.
    VARIABLE VIEW • Both:The variable will be used as both a predictor and an outcome (independent and dependent variable). • None: The variable has no role assignment. • Partition: The variable will partition the data into separate samples. • Split: Used with the IBM® SPSS® Modeler (not IBM® SPSS® Statistics). To define a variable's role in your analysis, click inside the cell corresponding to the “Role” column for that variable. Then use the drop-down menu to select the role that variable will take: Input, Target, Both, None, Partition, or Split. VARIABLE VIEW IN SPSS 19
  • 20.
    DATA ENTERING AND MANAGEMENT Dataplays a significant role in any research. Therefore As a researchers it is necessary to manage the data in SPSS so that the collected data can facilitate statistical analysis. This part will help you in entering data, storing data, sorting data, data aggregation etc. and other related procedures. 1, ENTERING DATA • After creating the variables data would be entered in the Data View. You can enter data by variable or by case. You may enter the data in the data editor as you do it in Ms Excel and enter the values accordingly. First click on the first empty cell under the first variable, type the value and then press the Down Arrow Key, then type the next number. Instead of Down Arrow Key you can also use Enter Key and while entering data by case you may use Right- Arrow Key or TAB key 20
  • 21.
    DATA ENTERING AND MANAGEMENT •Following are the Steps for importing Excel file into SPSS. The first step is to click on File => Open => Select Data => Dialog Box => Files of type => .xls file. After selecting the excel file that will be imported for performing the data analysis, we need to ensure that in the dialog box that we selected is “read variable names from the first row of data”. And at the end, click OK. Your file has now imported in SPSS. 21
  • 22.
    DATA ENTERING AND MANAGEMENT 2,EDITING DATA • For editing any value while entering data you simply have to click on the cell of interest, type the new value and then hit enter. When a file has many variables and if you want one or two column always visible then you have to place the cursor at the bottom right of the screen, look for a small area to the right of the vertical scroll bar and drag the line to the column or variable you want to refer while entering data. 3, MANAGING DATA FILES AND DATA MANOEUVRING • In this part of unit you would be grounded with the tools and techniques for data management. Since for analyzing the data from different perspectives or dimensions you need to derive required data from the original data file. Once all the data is entered you can save the data file by clicking File Menu and Save and then you have to enter the name of the file and choose the location and then press save. The file will save with an extension .sav. 22
  • 23.
    DATA ENTERING AND MANAGEMENT Manipulationor Manoeuvred of the Data- To enter SPSS a click on Start in the task bar activates the start menu. After clicking the SPSS programme you could create and name a data file or edit an already existing file. The data can be manoeuvred using the tools mentioned from 1.6.4 to 1.6. 14. 4, SPLITTING FILES Split file command is useful for performing same statistical analysis on separate groups based on the values of one or more grouping variables. For example if data is collected on several characteristics of households 23
  • 24.
    DATA ENTERING AND MANAGEMENT andthe so collected data is grouped by gender, ethnicity, income and category, then Spilt File Command can be used. Split file command has two options Compare options and organize output by groups. You can choose the options as per the requirement of research questions. For example, if you select Gender as grouping variable, you can find descriptive statistics like mean, median, standard deviation separately for Males and Females. 24
  • 25.
    DATA ENTERING AND MANAGEMENT •For splitting the file you have to first click Data from the Command menu and the select split file, you will get a dialogue box after this you will select Organize output by groups and move gender from the variable list box to the Groups Based on list box, then click OK. The file will be sorted on the basis of Gender Value in ascending order. To find out the descriptive for age, income, occupation or any other variable separately for males or females, you just have to use single command of descriptive statistics. This command executes same statistical tests to be performed on different categories of respondents in the same dataset. 25
  • 26.
    DATA ENTERING AND MANAGEMENT •Further, when you will execute the command you have to ensure that you select the “Sort the file by grouping variables”. Further if you have already sorted the file on the basis of gender then you click to “File is Already Sorted”. • By selecting Compare groups, results for both males and females will appear in the same output table. • By selecting Organize output by groups the group’s results will be displayed on two separate tables denoting one for each group. 26
  • 27.
    DATA ENTERING AND MANAGEMENT 5,IDENTIFYING DUPLICATE CASES This is used to track errors in data entry “Identify Duplicate Command” helps us in detecting existence of duplicate entries while adding data into SPSS. This is also termed as Data Cleaning. For doing this go through the following path: • Data from Command Menu Identify Duplicate Cases from Drop Down Menu Select the variables Post them into Define Matching cases Ok The output would be displayed in the output viewer window. 6, IDENTIFYING UNUSUAL CASES This function will help you in identifying unusual behavior of samples which deviate from the group norms to which they belong to. You can track those using the following path: 27
  • 28.
    DATA ENTERING AND MANAGEMENT Youcan track those using the following path: • Identify Unusual cases Select the Analysis variables for selecting the variables on the basis you want to perform the task Select the case identifier variable Ok 7, SELECTING CERTAIN CASES AND INSERTING CASES Selecting a portion of the data for analysis is frequently used by researchers. The usage of Select cases helps in selecting a subset of data for analysis. It can also perform analysis on Random Sample of Cases. For example, if you want to perform what the mean total score is for females, then you needs to follow the path mentioned as under- 28
  • 29.
    DATA ENTERING AND MANAGEMENT •Data Select cases If condition is satisfied If In If then click gender mention =1 and then press continue and O.K Further, if you want to cross check identified cases that are selected then it is easily recognizable by the diagonal line placed through the row number for the non selected cases. In this example, the lines through case number represent males in the sample. Further, SPSS also creates a new variable named filter_$ which codes selected cases as 1 and non selected cases as 0. Moreover, if you will select ALL cases option then the Select Case will automatically get turn off. 29
  • 30.
    DATA ENTERING AND MANAGEMENT •If you need to insert case or variables then you can use Insert cases or Insert Variables from Edit menu in the tool bar. You will then have to click to any cell in the case below the position where you wish to insert the new case and click insert cases from edit menu. On the other hand if you want to insert any cell in variable to the right of the position where you want to insert the new variable and click insert variable from edit menu. 30
  • 31.
    DATA ENTERING AND MANAGEMENT 8,DATAAGGREGATION • If you want to aggregate the data collected cumulatively like you might have collected data on entrance test marks attained in English language Comprehension, Reasoning, Mathematics and General Knowledge and you want to know their mean score or knowing the highest level of total marks attained then it is possible in SPSS, using aggregate command. This command performs arithmetic or statistical operations on similar categories of respondents. Functions like sum, maximum, mean etc. can be calculated for cases or respondents with the identical attributes. Path: • Data Aggregate Break Variable Select the Variable Browse and Select the File Summaries of Variable Function 31
  • 32.
    DATA ENTERING AND MANAGEMENT •In Break Variable you have to specify the level variable (Marks on different parameters) on which aggregation is to be performed. Then in “Select The Variable” you have to select Score in Entrance Examination and transfer it into the Summaries of Variables list box. Then you have to click Function button then another dialogue box will open in which you can select mean, maximum, that you want to perform on the variable and click continue. In Save Frame you have to select Create a new dataset containing only the Aggregated variables and give some name to the dataset. In options, for very large datasets, select Sort File before aggregating and then OK. A new file will be formed on the applying the aggregate command. 32
  • 33.
    DATA ENTERING AND MANAGEMENT 9,RECODING VARIABLES • This procedure also creates new variables by dividing a pre existing variable into categories and coding each category differently. Recode sub menu of Transform menu have two options i.e recode into same variables or recode into different variables, when you choose same variables then the original values would get replaced with the new recoded values. In second option both the values old and new would be available. • For example if the Head of the Department wants to divide the scores attained by the candidates in entrance test into different grades. In this, coding is based on the percent variable and now you want to recode the score variable in class of 40 to 50=1, 50 to 60= 2, 60 to70=3, 70-80=4, 80-90 =5 and 90 to 100= 6 . 33
  • 34.
    DATA ENTERING AND MANAGEMENT •Now in this case Click transform go to Recode into different variables. A dialogue box would appear. Click on the variable which you want to recode and take it to Numeric Variable -> Output variable and mention new variable name and then click Change. • Your next step would be clicking Old and new values button. Click Range Lowest through Value button and mention the number you want to depict in new value box . Repeat this step for all the values and then click continue and O.K to execute the command. 34
  • 35.
    DATA ENTERING AND MANAGEMENT 10,INSERTING NEW VARIABLES • If you want to insert cases or variables then you can use insert cases or insert variables from edit menu in the tool bar. You have to left click your mouse below the row where you want to insert case then go to the Data drop down menu and select Insert Case or you can select any cell in the variable to the right of the position you want to insert the new variable and click insert variable from edit menu. Note: Here case denotes a row. 11, DELETING VARIABLES AND CASES • If you want to delete cases or variables then you have to pick clear from the Edit Menu in the tool bar. You have to click on the case number on the left side of row or select any cell in the row in which you want to delete and then click clear from the edit menu. Further, if you want to delete a variable then select the variable name that is the column in which you want to delete and then click clear from the edit menu. 35
  • 36.
    DATA ENTERING AND MANAGEMENT 12,SORTING CASES • If you want to sort cases then you have to select a variable of interest and specify which case you want to sort in ascending or descending in the Sort Cases Window which would be located in Data Menu 36
  • 37.
    DATA ENTERING AND MANAGEMENT 12,MERGING FILES • The task of data entry is carried on the basis of number of questionnaires. If there are large number of questionnaires or if modules in questionnaire are divided into different data operators then the segregated data will have to be merged to get the full data set. However, while merging you have to ensure that format files are in same data editor and identical formats are created for the each variable. You need to ensure that matching variables have identical names and the cases or variables are in the same order. 37
  • 38.
    DATA ENTERING AND MANAGEMENT 13,MERGING FILES BY CASES It will be used if different operators are given different sets of full questionnaires for data entry. Here each respondent is a case. For the same you have to first access the file in which you want to merge and then you have to click Data then Merge Files and then Add Cases. Path: • Data Merge Files Add Cases An External SPSS Data File Browse and Select the File Continue • dialogue box would appear on the screen. Variables in the New Active Dataset list box would be the list of variables in the active dataset as well as new dataset. If there are some variables in the external file which are not in the active dataset then those variables would be listed in the Unpaired Variables. After this you have to click the OK button to execute the command. 38
  • 39.
    14, MERGING FILESBY VARIABLES • It is used when there are different data entry operators enter data of different modules of questionnaire of the same set of respondents but for different questions. For this you have to add variables to the Master file for preparing complete data set. The procedure would be that first you have to access the file in which you want to merge and then you have to click Data then Merge Files and then Add Variables • Path: Data Merge Files Add Variables An External SPSS Data File Browse and Select the File Continue 39 DATA ENTERING AND MANAGEMENT
  • 40.
    A dialogue boxwould appear on the screen as Add variables from ………. With the name and source of your external file included in the title. The matching variables will be listed in the Excluded Variables Window and each will be followed by a “+” sign in parentheses. Further, the variables that are in the original file that are not present in the external file are listed in the New Active Dataset Window and each one will be followed by an asterisk “*” in parentheses. It is required that the matching variables shall be in the same order identically for both the file. You have to then click to Match Cases on Key Variables in sorted files. Select the matching variable in the box to the left click the arrow button and then, click OK. 40 DATA ENTERING AND MANAGEMENT
  • 41.
    CONCLUSION • SPSS isone of the most widely used programs for statistical analysis in social science. SPSS helps in analyzing obtained data in a more systematic and computerized way. By using SPSS itis easy to get analytical result within a short period of time. SPSS directly assist in getting all statistical results like: Central tendency, Frequency distribution, Standard deviation, Test of hypothesis etc. In addition, by using SPSS any type of chart or diagram also can be drawn and shown in different table. In brief, SPSS helps exclusively in compiling, preparing and presenting all research data in a befitting way. 41
  • 42.