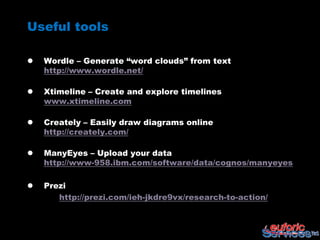
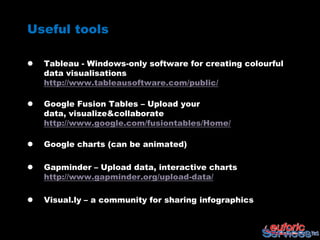
Data and information
 visualization tools

FAO Social Media Workshop
Intro /definition

   Creating visualizations of data can offers another
    way of communicating and sharing that data with
    others

   Visuals can stimulate conversation and meaning
    making around data that is different from simply
    presenting the textual or numerical data

   This is especially important when working across
    cultures and languages
                                     Source: KSToolkit
Key functions it supports

   Tell your story, document and share lessons learnt

   Analyze your data

   Convey abstract information in an easily digestible
    format

   Supports research, problem solving, decision
    making, planning

   Illustrate timelines, relationships, impact

   Create shareable and social media friendly
    content
Examples

 The Female Face of Farming – Farming First &
  FAO

 The Future of Food – Wired Magazine

 How Africa Tweets – Portland Communication

 How to Create a Social Media Campaign –
  Simply Business

 R4D Twitter Good Practice - CommsConsult
How to use it

 Main things to consider:

     – What function(s) is the information
       designed to support?

     – Who is your intended audience?

    Source: Visualizing Information for Advocacy
How to use it

 Assessing your data – What do you have
  available?

 Sorting and sketching – What is useful to use?

 Assessing your media – How to publish?

 Design –
  Colours, structure, elements, technology

    Source: Visualizing Information for Advocacy
What makes a good infographic?

 It’s a visual explanation that helps you more
  easily understand, find or do something
 It’s visual, and when necessary, integrates
  words and pictures in a fluid, dynamic way
 It stands alone and is completely self-
  explanatory
 It reveals information that was formerly
  hidden or submerged
 It makes possible faster, more consistent
  understanding
 It’s universally understandable
                  Source: Communication Nation
Resources, and links

   Visualizing Information for Advocacy
    http://www.tacticaltech.org/sites/tacticaltech.org/f
    iles/infodesign.pdf

   Make Your Own Infographic
    http://www.wildapricot.com/blogs/newsblog/2010/0
    5/25/make-your-own-infographic
Useful tools

   Wordle – Generate “word clouds” from text
    http://www.wordle.net/

   Xtimeline – Create and explore timelines
    www.xtimeline.com

   Creately – Easily draw diagrams online
    http://creately.com/

   ManyEyes – Upload your data
    http://www-958.ibm.com/software/data/cognos/manyeyes

   Prezi
       http://prezi.com/ieh-jkdre9vx/research-to-action/
Useful tools

   Tableau - Windows-only software for creating colourful
    data visualisations
    http://www.tableausoftware.com/public/

   Google Fusion Tables – Upload your
    data, visualize&collaborate
    http://www.google.com/fusiontables/Home/

   Google charts (can be animated)

   Gapminder – Upload data, interactive charts
    http://www.gapminder.org/upload-data/

   Visual.ly – a community for sharing infographics
Hands on exercise

 Select a couple of the tools listed above

 Modify existing visualizations or create
  your own with your data and info

 Share and re-use the object created using
  other social media platforms
Credits

 Julia Reich - Infographics & Data
  Visualization: Not Your Grandmother’s Pie
  Chart

 Betty Allen - Presenting Complex Data
  Visually

 Tactical Tech - Visualizing Information for
  Advocacy

 KSToolkit

Data and information visualization tools 2012

  • 1.
    Data and information visualization tools FAO Social Media Workshop
  • 2.
    Intro /definition  Creating visualizations of data can offers another way of communicating and sharing that data with others  Visuals can stimulate conversation and meaning making around data that is different from simply presenting the textual or numerical data  This is especially important when working across cultures and languages Source: KSToolkit
  • 3.
    Key functions itsupports  Tell your story, document and share lessons learnt  Analyze your data  Convey abstract information in an easily digestible format  Supports research, problem solving, decision making, planning  Illustrate timelines, relationships, impact  Create shareable and social media friendly content
  • 4.
    Examples  The FemaleFace of Farming – Farming First & FAO  The Future of Food – Wired Magazine  How Africa Tweets – Portland Communication  How to Create a Social Media Campaign – Simply Business  R4D Twitter Good Practice - CommsConsult
  • 5.
    How to useit  Main things to consider: – What function(s) is the information designed to support? – Who is your intended audience? Source: Visualizing Information for Advocacy
  • 6.
    How to useit  Assessing your data – What do you have available?  Sorting and sketching – What is useful to use?  Assessing your media – How to publish?  Design – Colours, structure, elements, technology Source: Visualizing Information for Advocacy
  • 7.
    What makes agood infographic?  It’s a visual explanation that helps you more easily understand, find or do something  It’s visual, and when necessary, integrates words and pictures in a fluid, dynamic way  It stands alone and is completely self- explanatory  It reveals information that was formerly hidden or submerged  It makes possible faster, more consistent understanding  It’s universally understandable Source: Communication Nation
  • 8.
    Resources, and links  Visualizing Information for Advocacy http://www.tacticaltech.org/sites/tacticaltech.org/f iles/infodesign.pdf  Make Your Own Infographic http://www.wildapricot.com/blogs/newsblog/2010/0 5/25/make-your-own-infographic
  • 9.
    Useful tools  Wordle – Generate “word clouds” from text http://www.wordle.net/  Xtimeline – Create and explore timelines www.xtimeline.com  Creately – Easily draw diagrams online http://creately.com/  ManyEyes – Upload your data http://www-958.ibm.com/software/data/cognos/manyeyes  Prezi http://prezi.com/ieh-jkdre9vx/research-to-action/
  • 10.
    Useful tools  Tableau - Windows-only software for creating colourful data visualisations http://www.tableausoftware.com/public/  Google Fusion Tables – Upload your data, visualize&collaborate http://www.google.com/fusiontables/Home/  Google charts (can be animated)  Gapminder – Upload data, interactive charts http://www.gapminder.org/upload-data/  Visual.ly – a community for sharing infographics
  • 11.
    Hands on exercise Select a couple of the tools listed above  Modify existing visualizations or create your own with your data and info  Share and re-use the object created using other social media platforms
  • 12.
    Credits  Julia Reich- Infographics & Data Visualization: Not Your Grandmother’s Pie Chart  Betty Allen - Presenting Complex Data Visually  Tactical Tech - Visualizing Information for Advocacy  KSToolkit

Editor's Notes

  • #5 FarmingFirst - visual representation of the statistics that underlie the urgent need to invest in rural women. It consists of 17 individually-designed graphics, each of which tells a part of this important story. Each graphic can be Tweeted and/or embedded for use in presentations or blog posts. The infographic has been launched in parallel with the ongoing UN Commission on the Status of Women (CSW) and International Women’s Day on 8th March.Simply Business uses infographics to visualize a process AND make use of existing contents, repackaged together from different sources
  • #8 REMEMBER!• Information design tells a story with pictures.It’s NOT ONLY about making something aesthetically pleasing, or about branding, style or making a glossy product… …It’s about making your research data:CLEARCOMPELLING and data can only speak if you ask it a question, so work out…WHAT YOU NEED TO KNOW FROM YOUR DATA and WHY YOU NEED TO KNOW
  • #9 Free downloadable manual from tacticaltech.org that offers an introduction to information design.
  • #11 Fusion tables – upload your data (Ex. coffee production), merge with country boundaries, info window content