
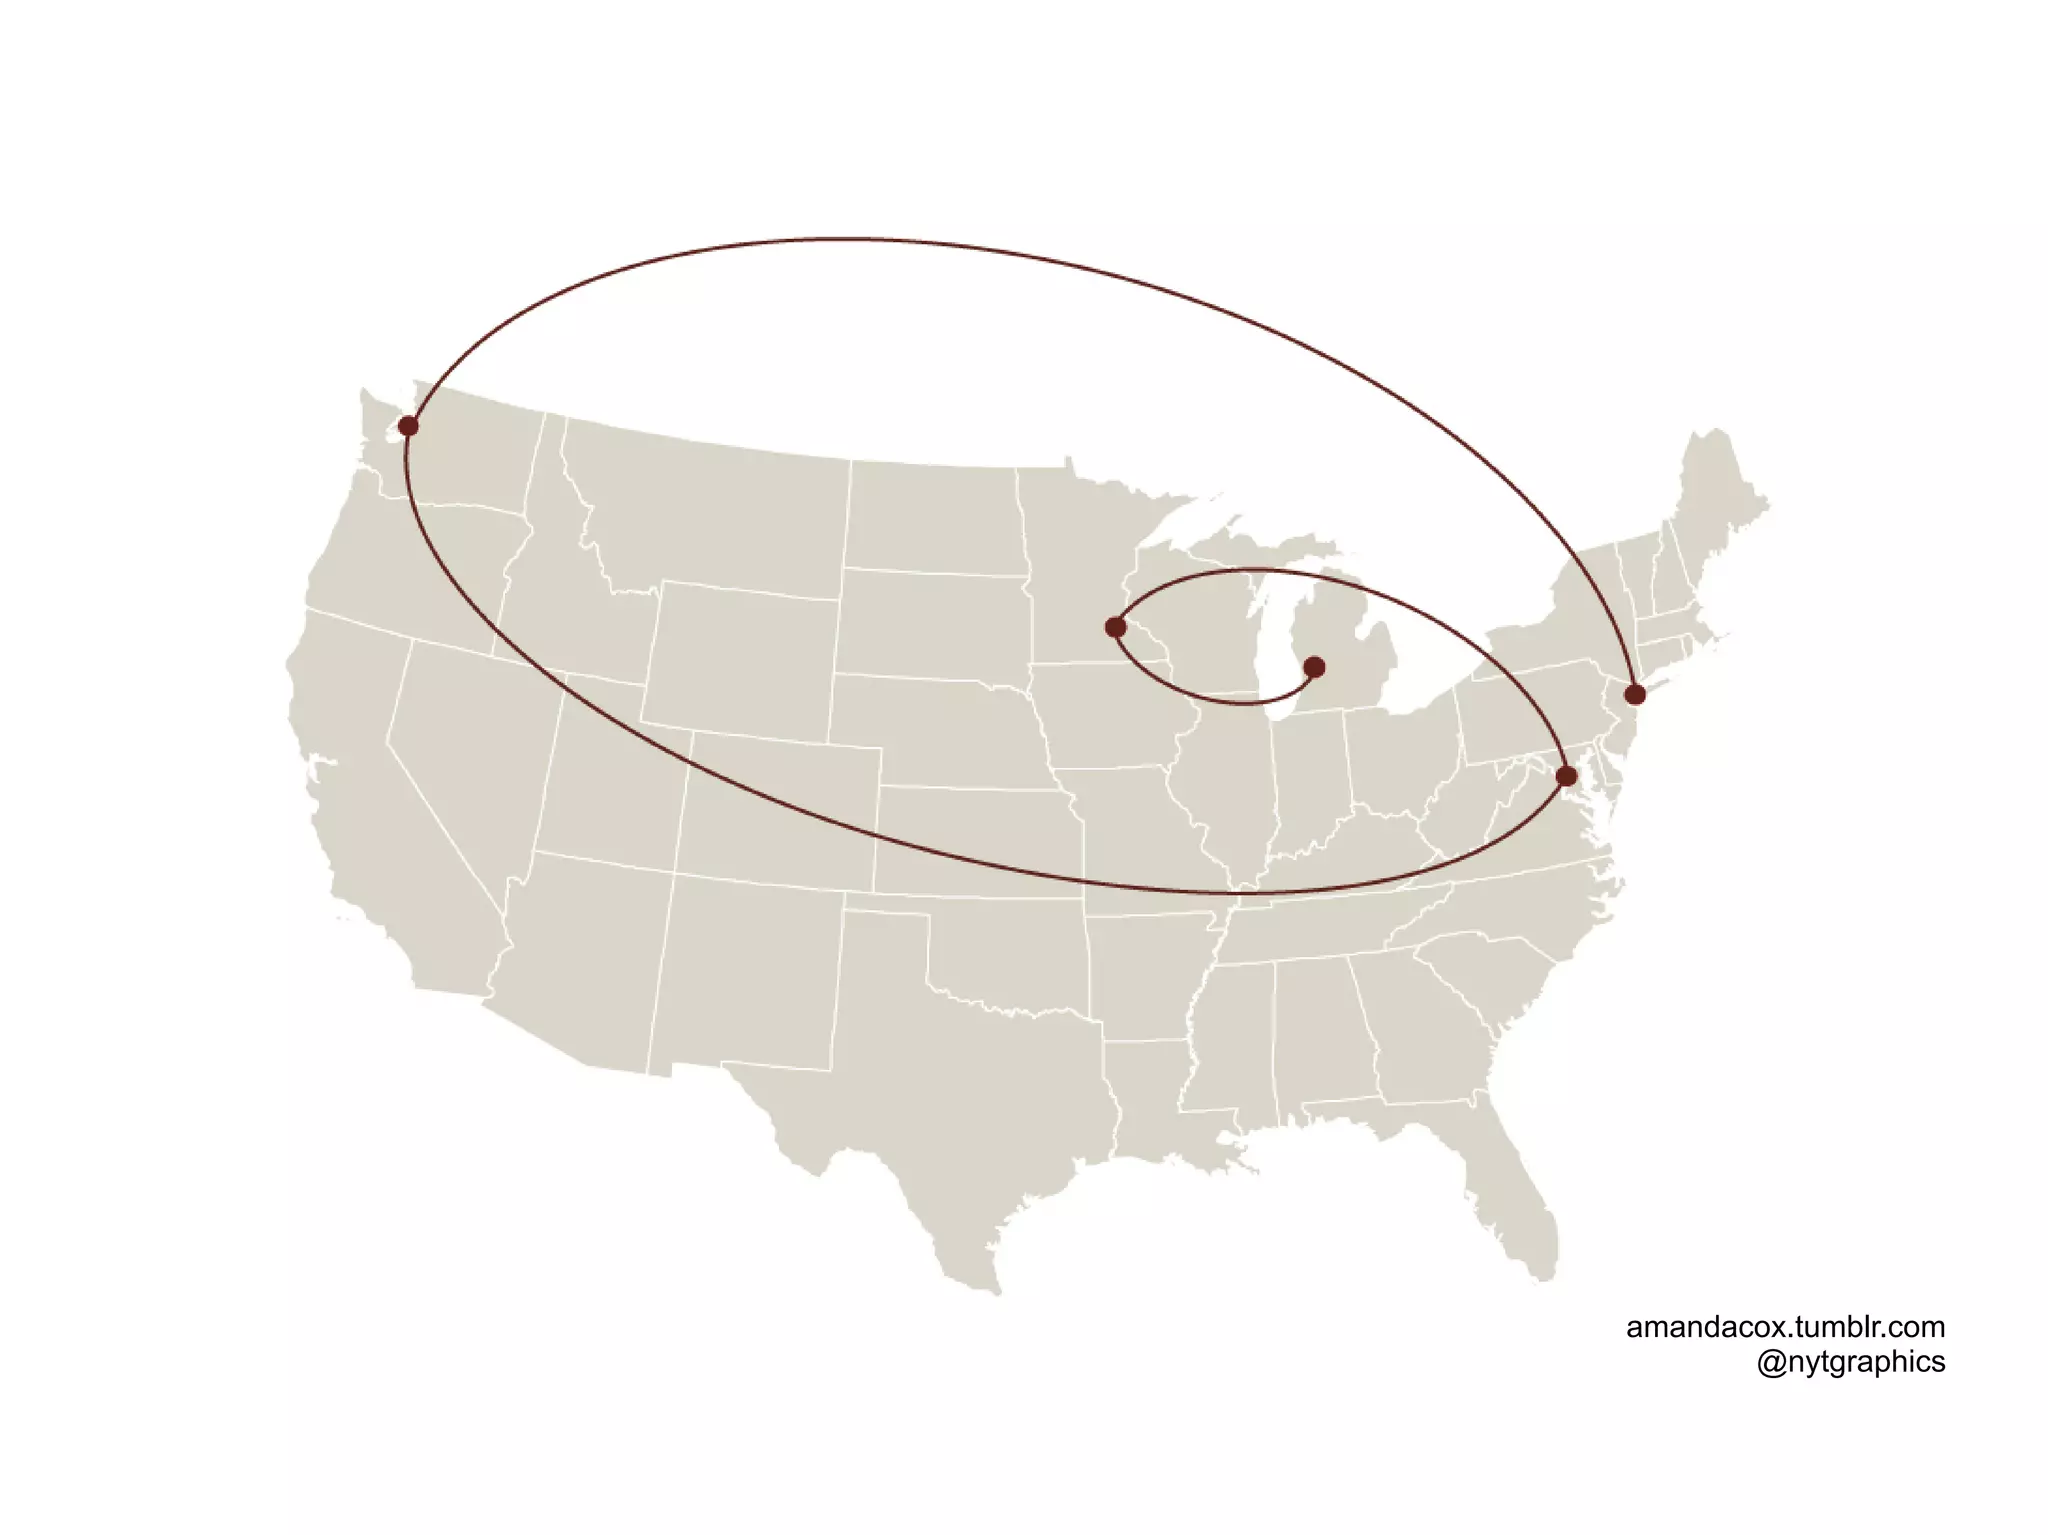
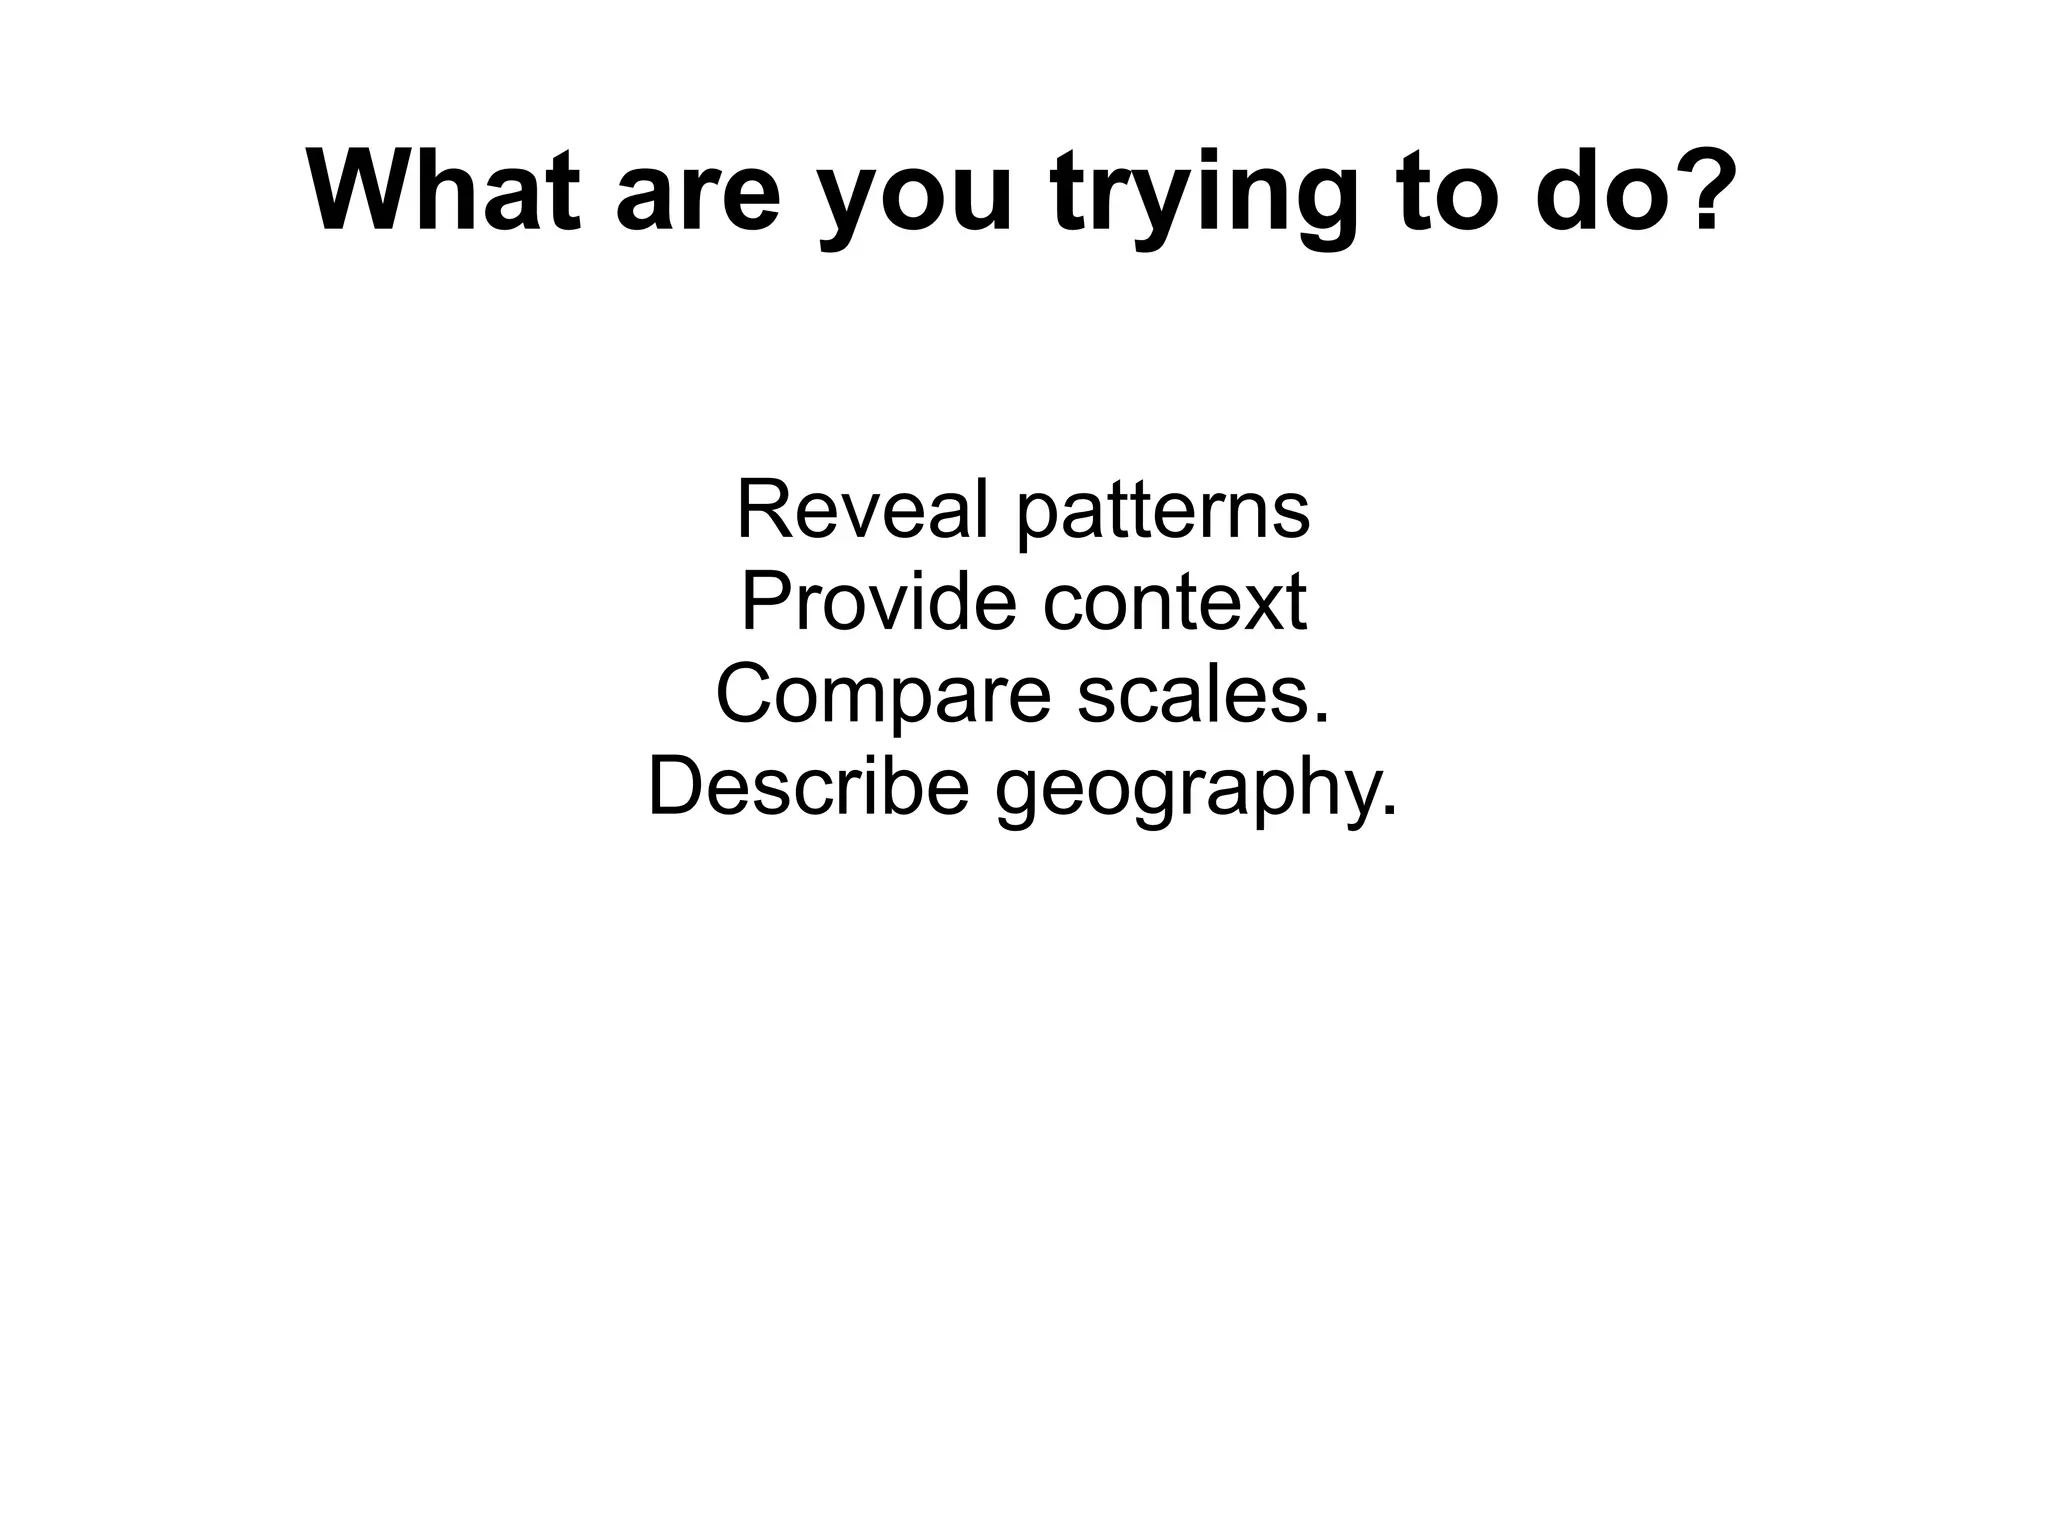
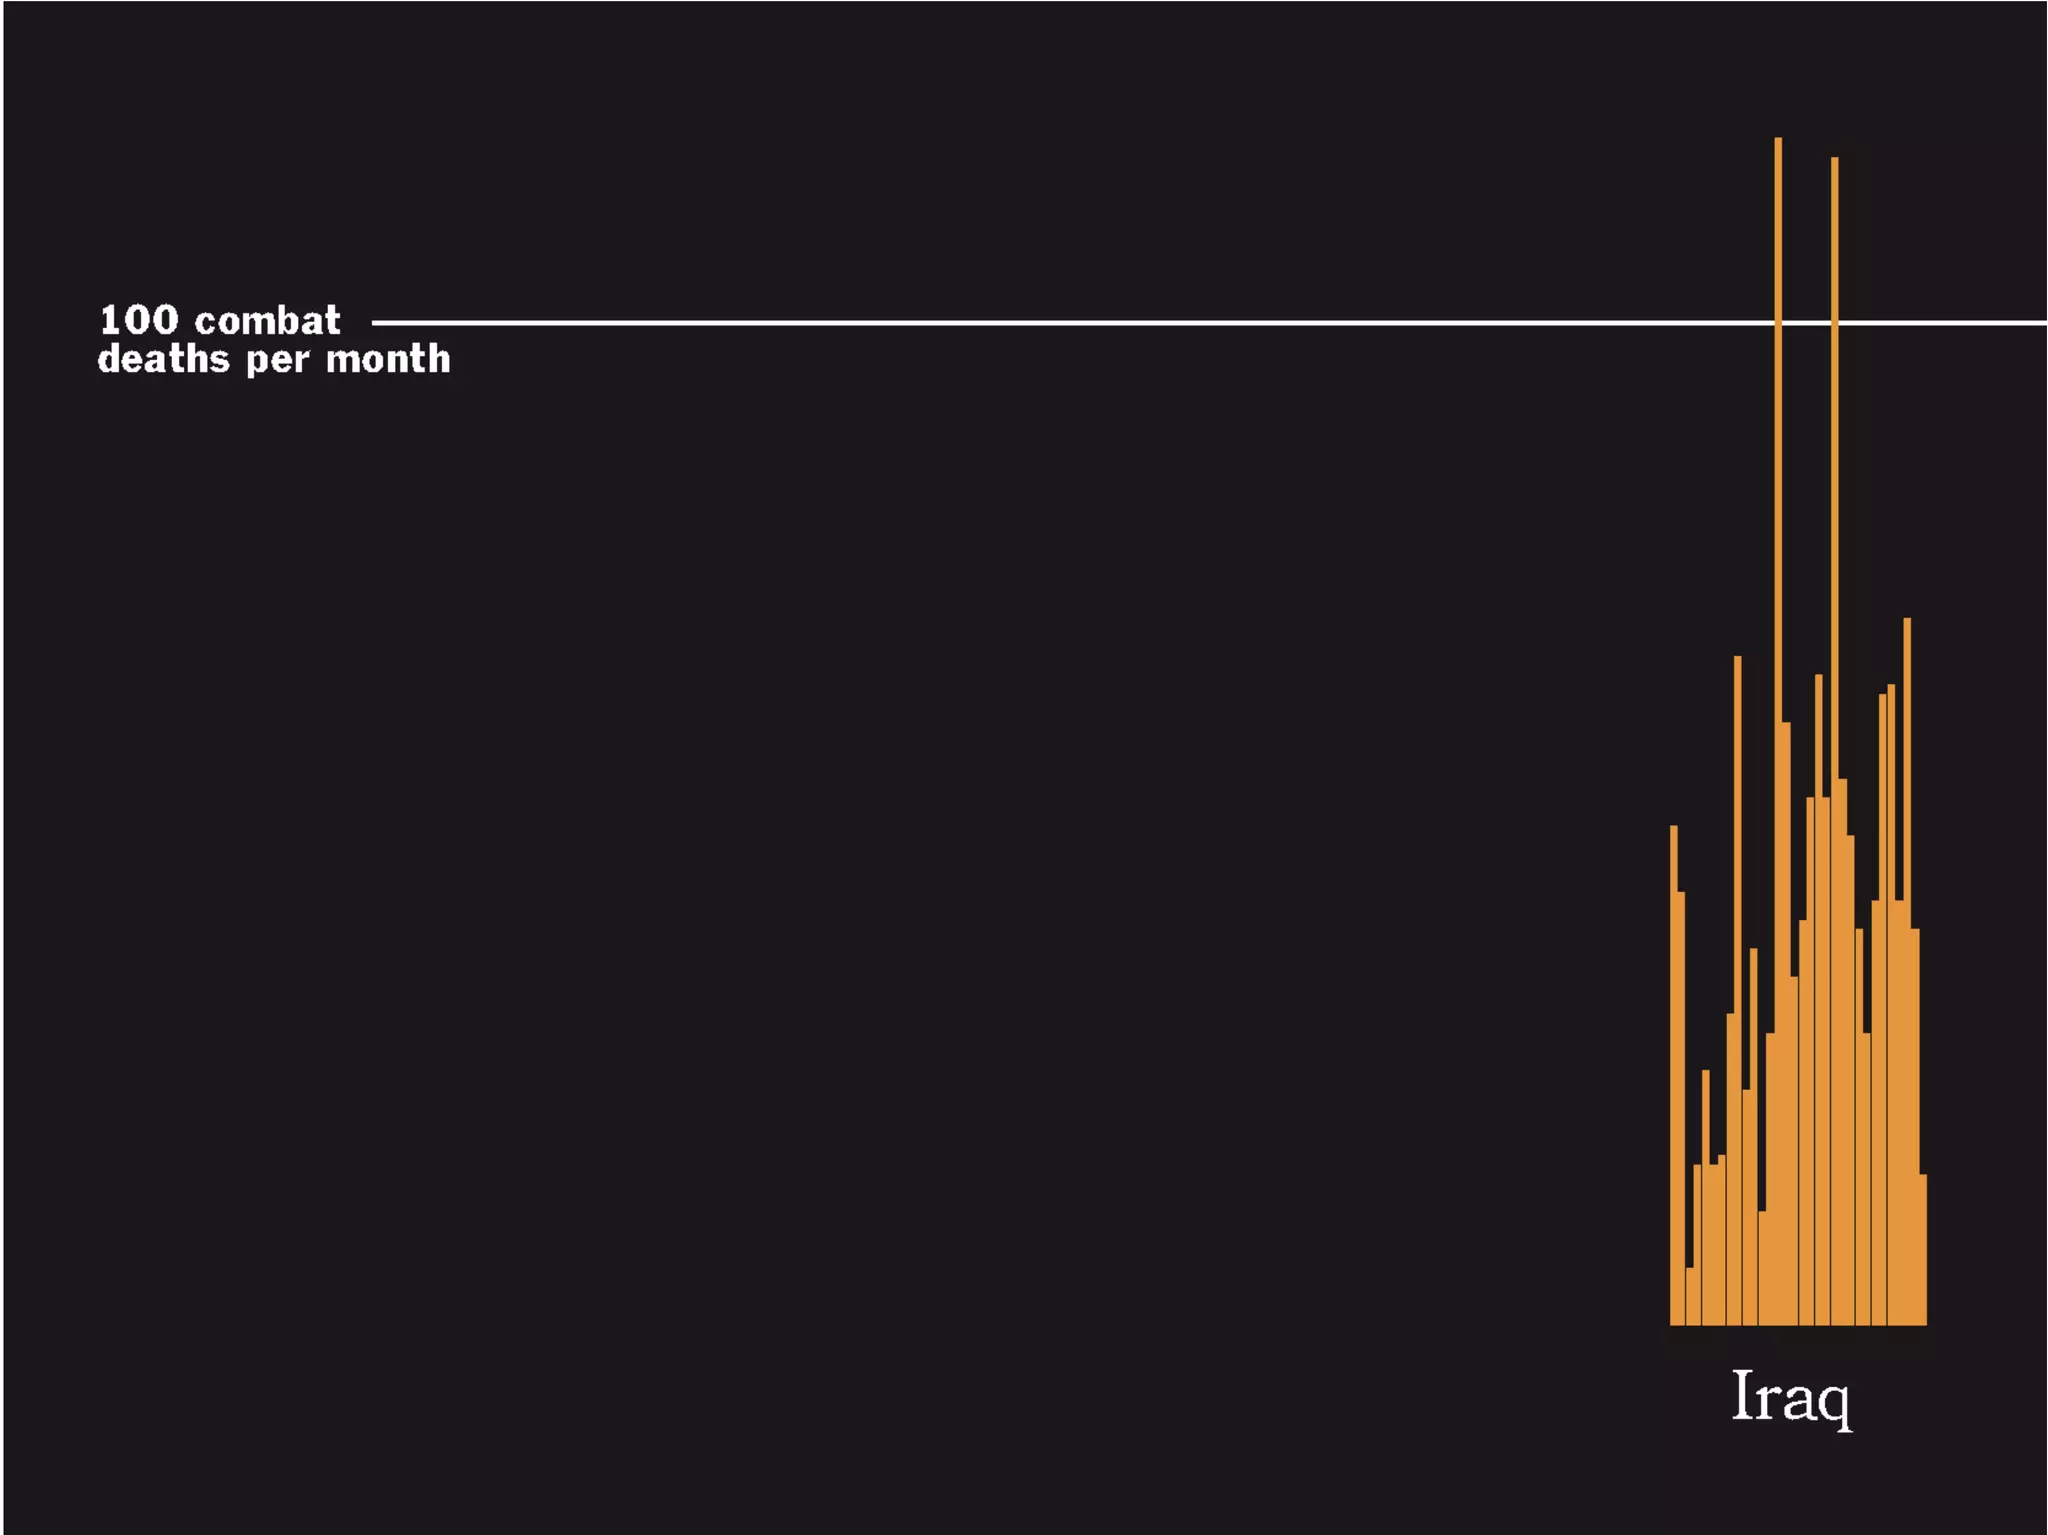
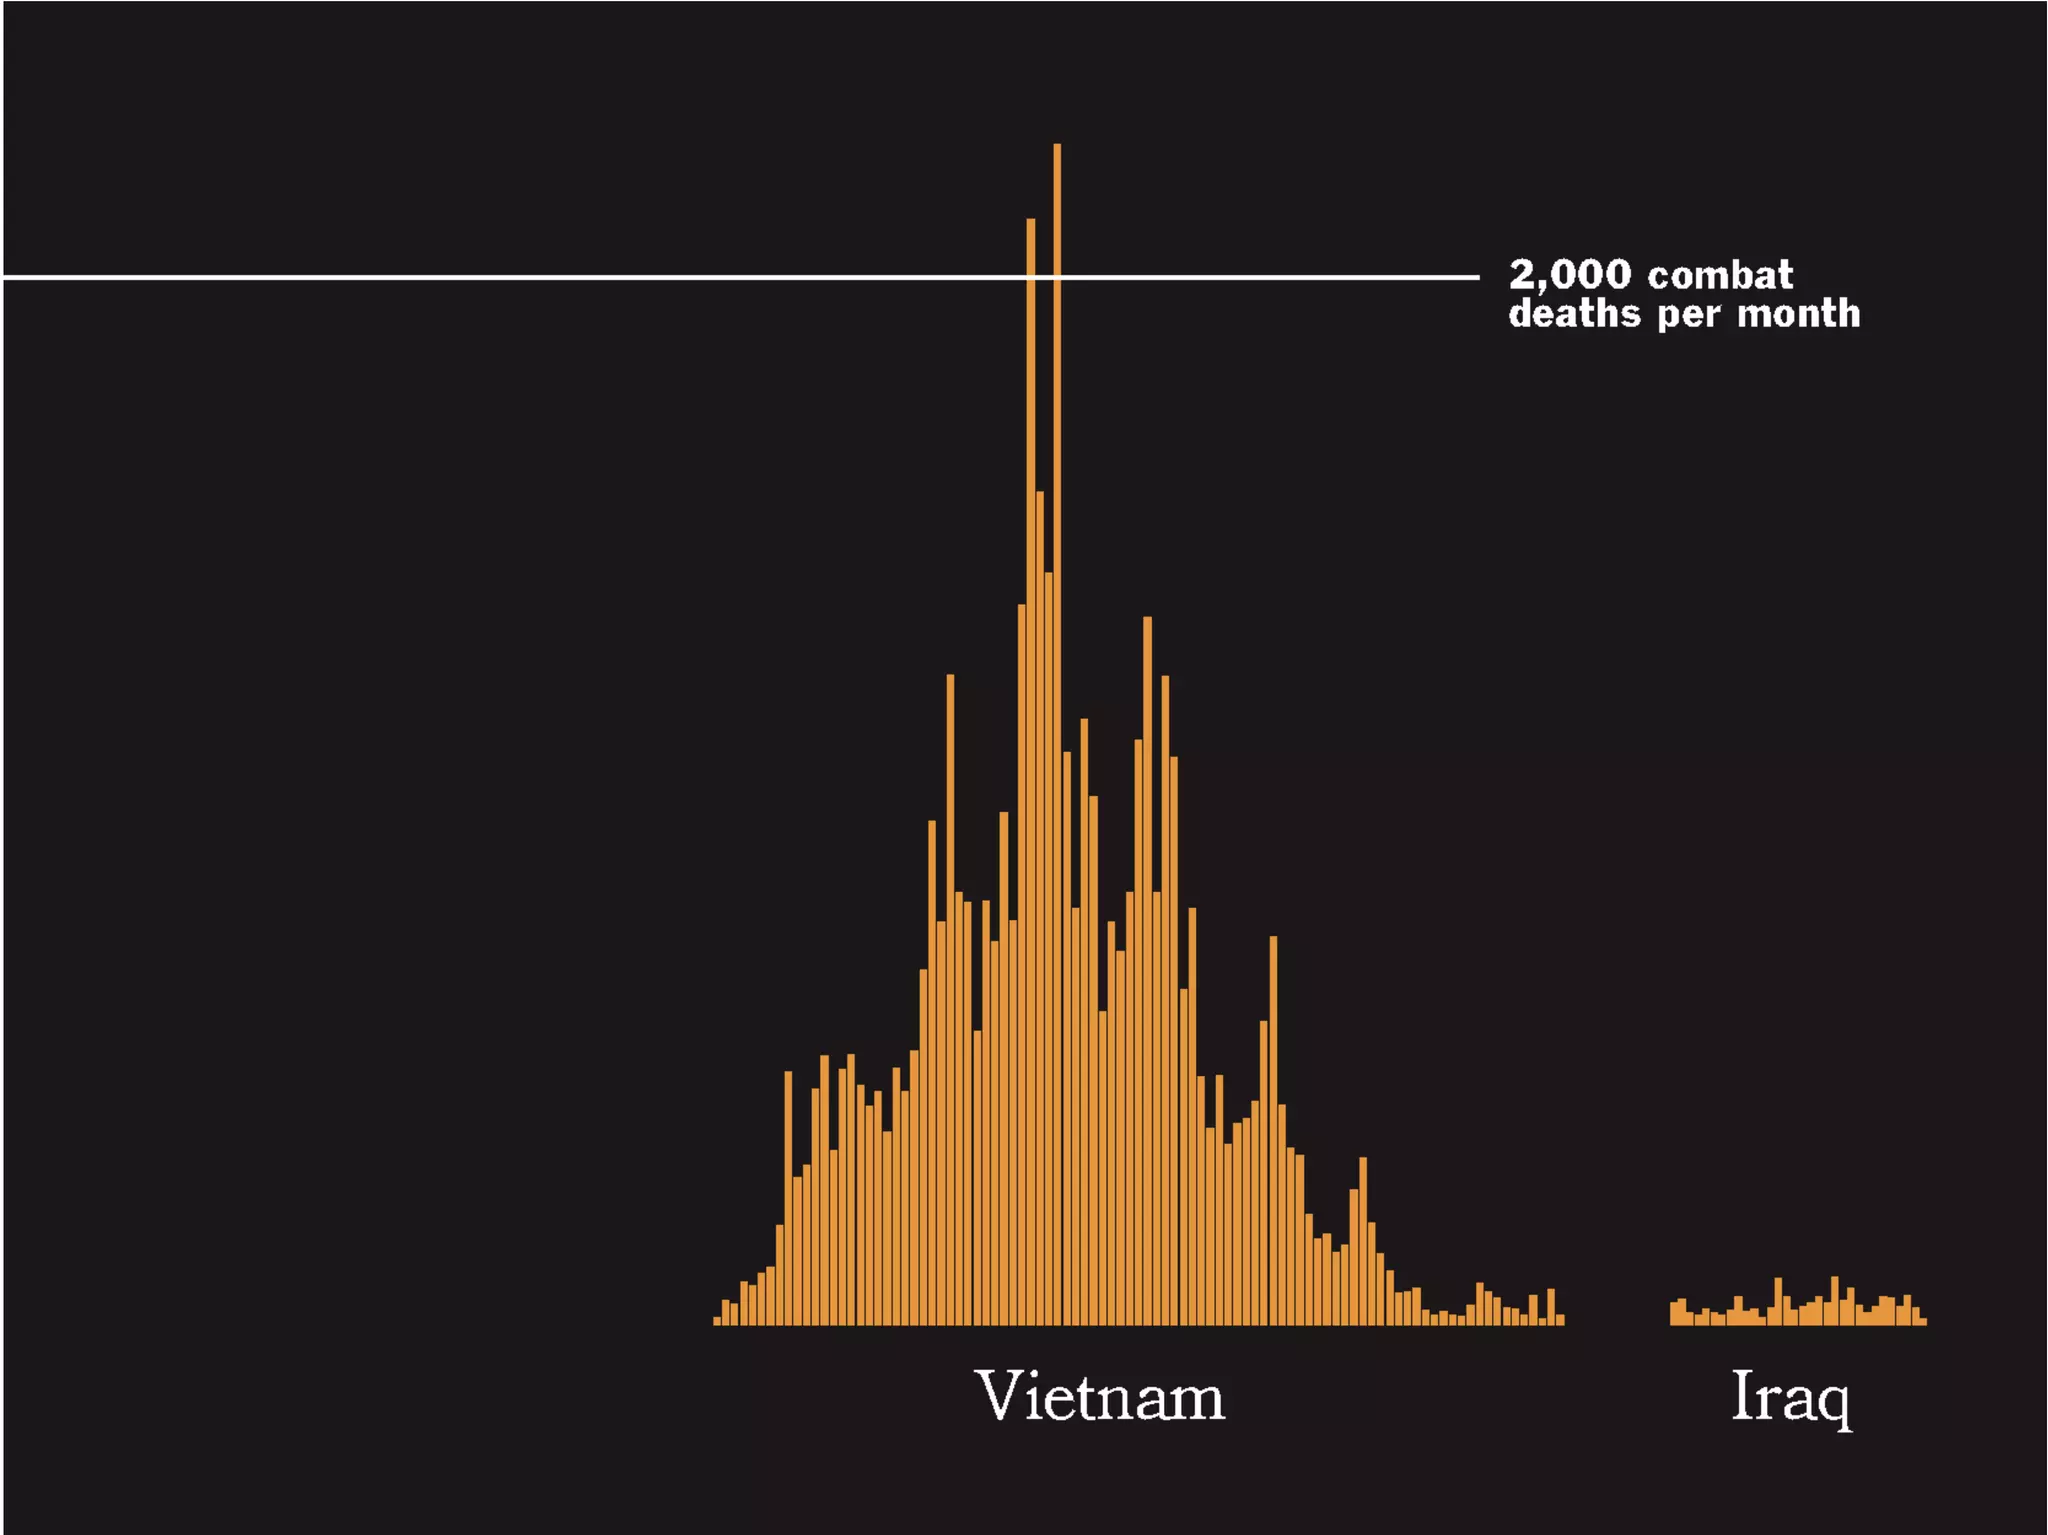
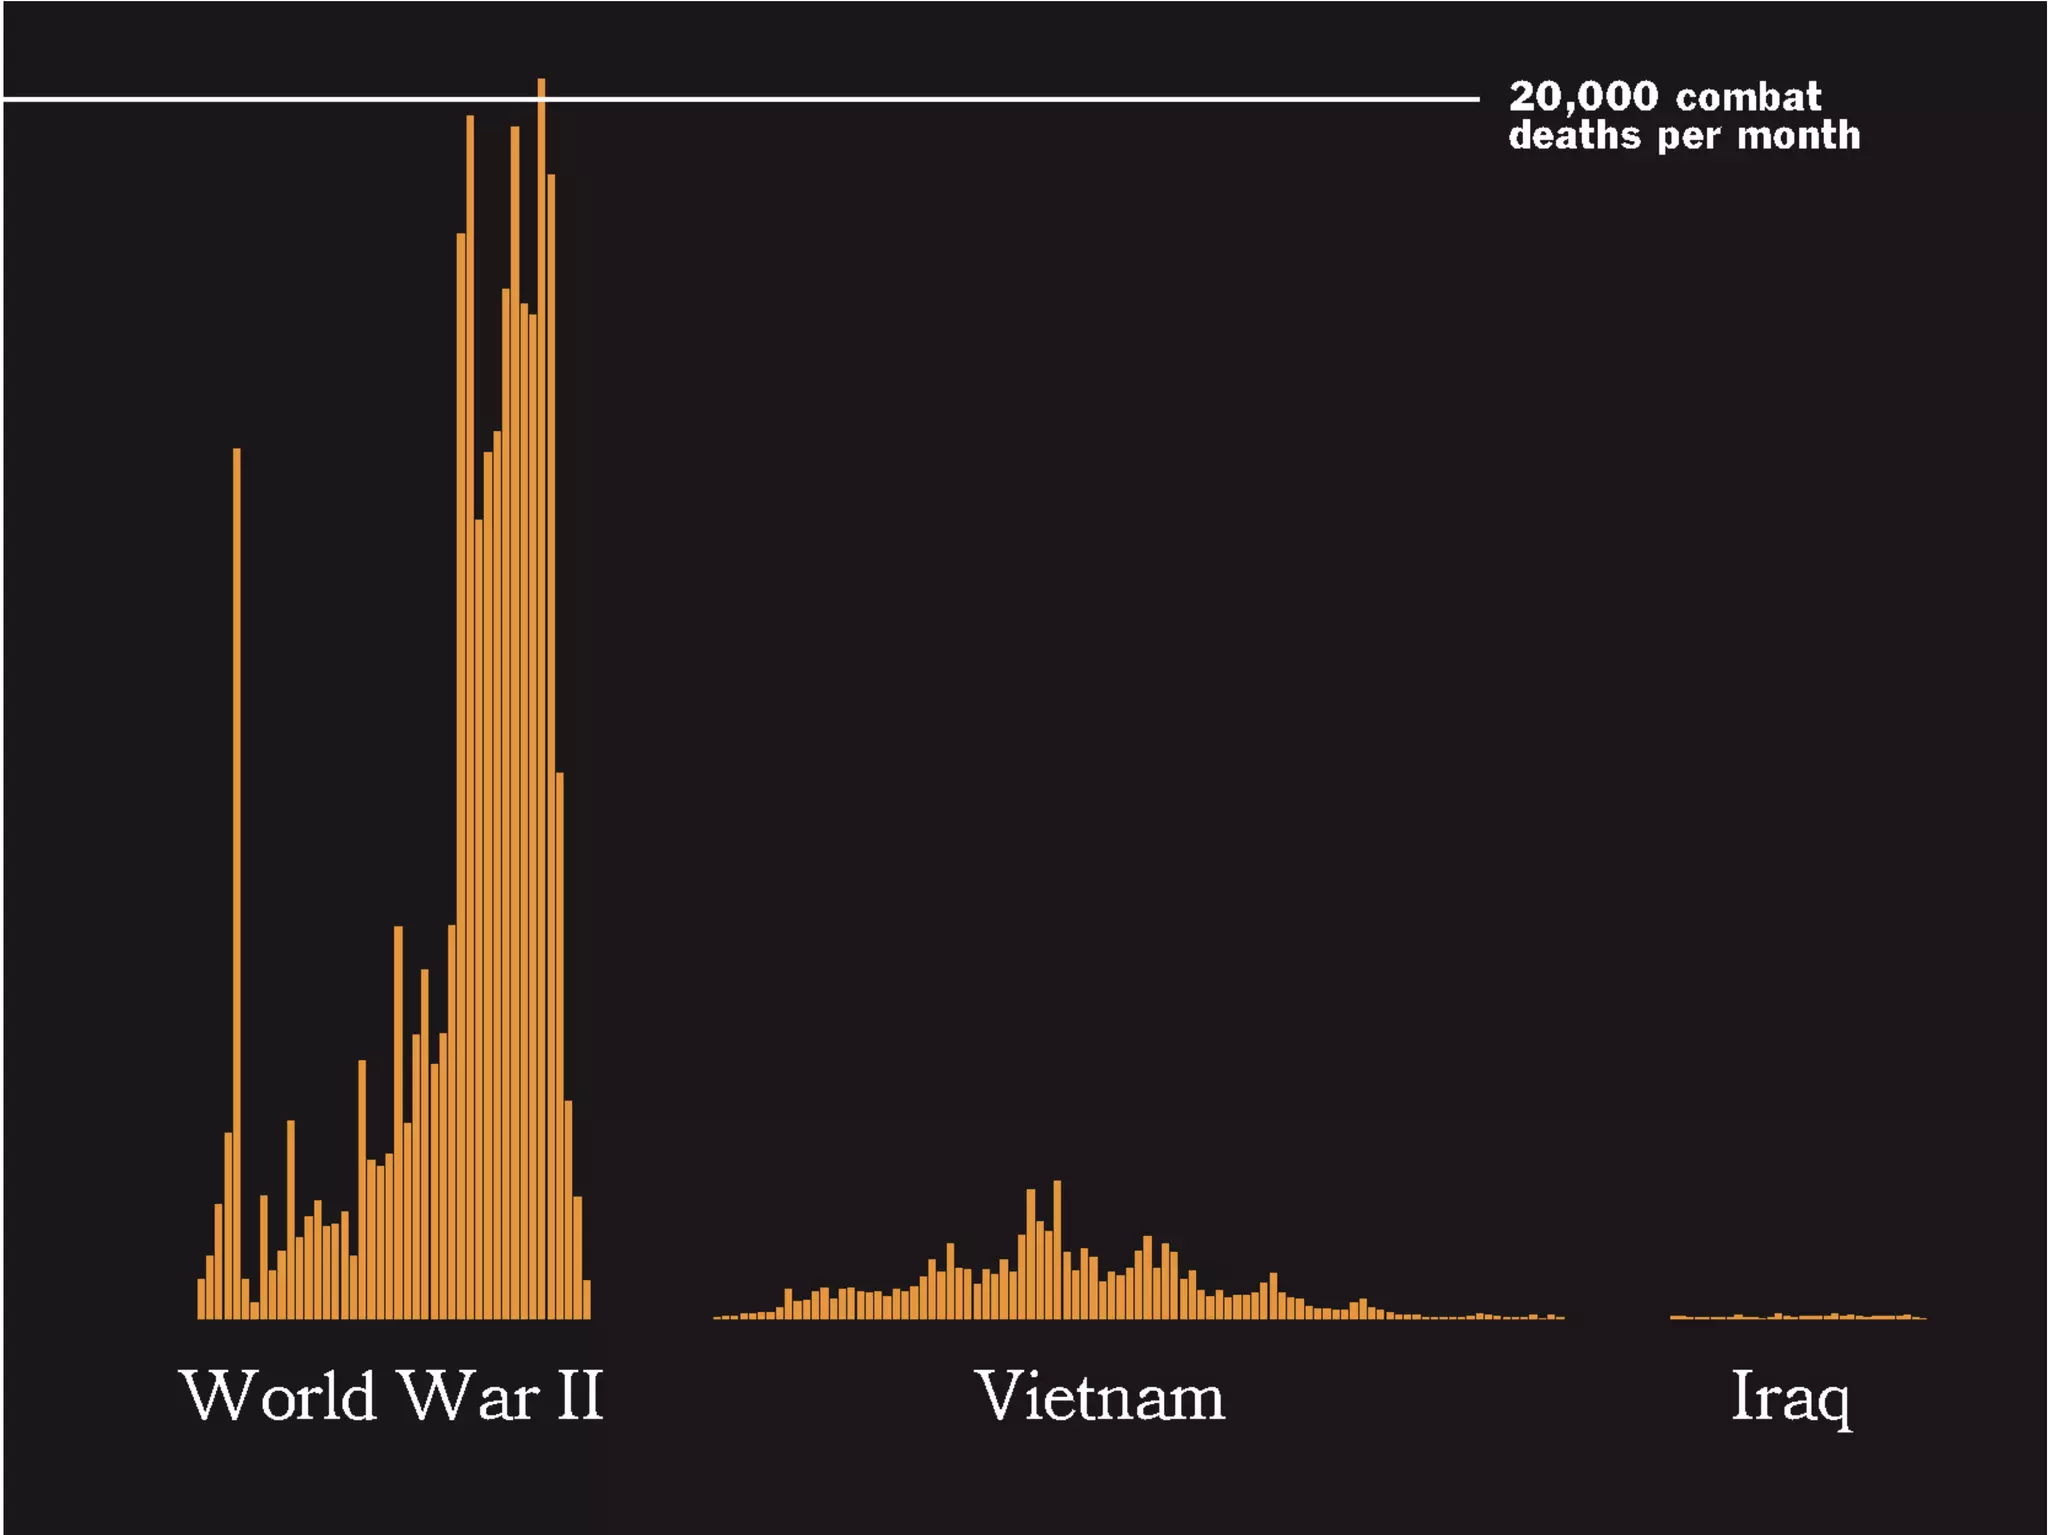
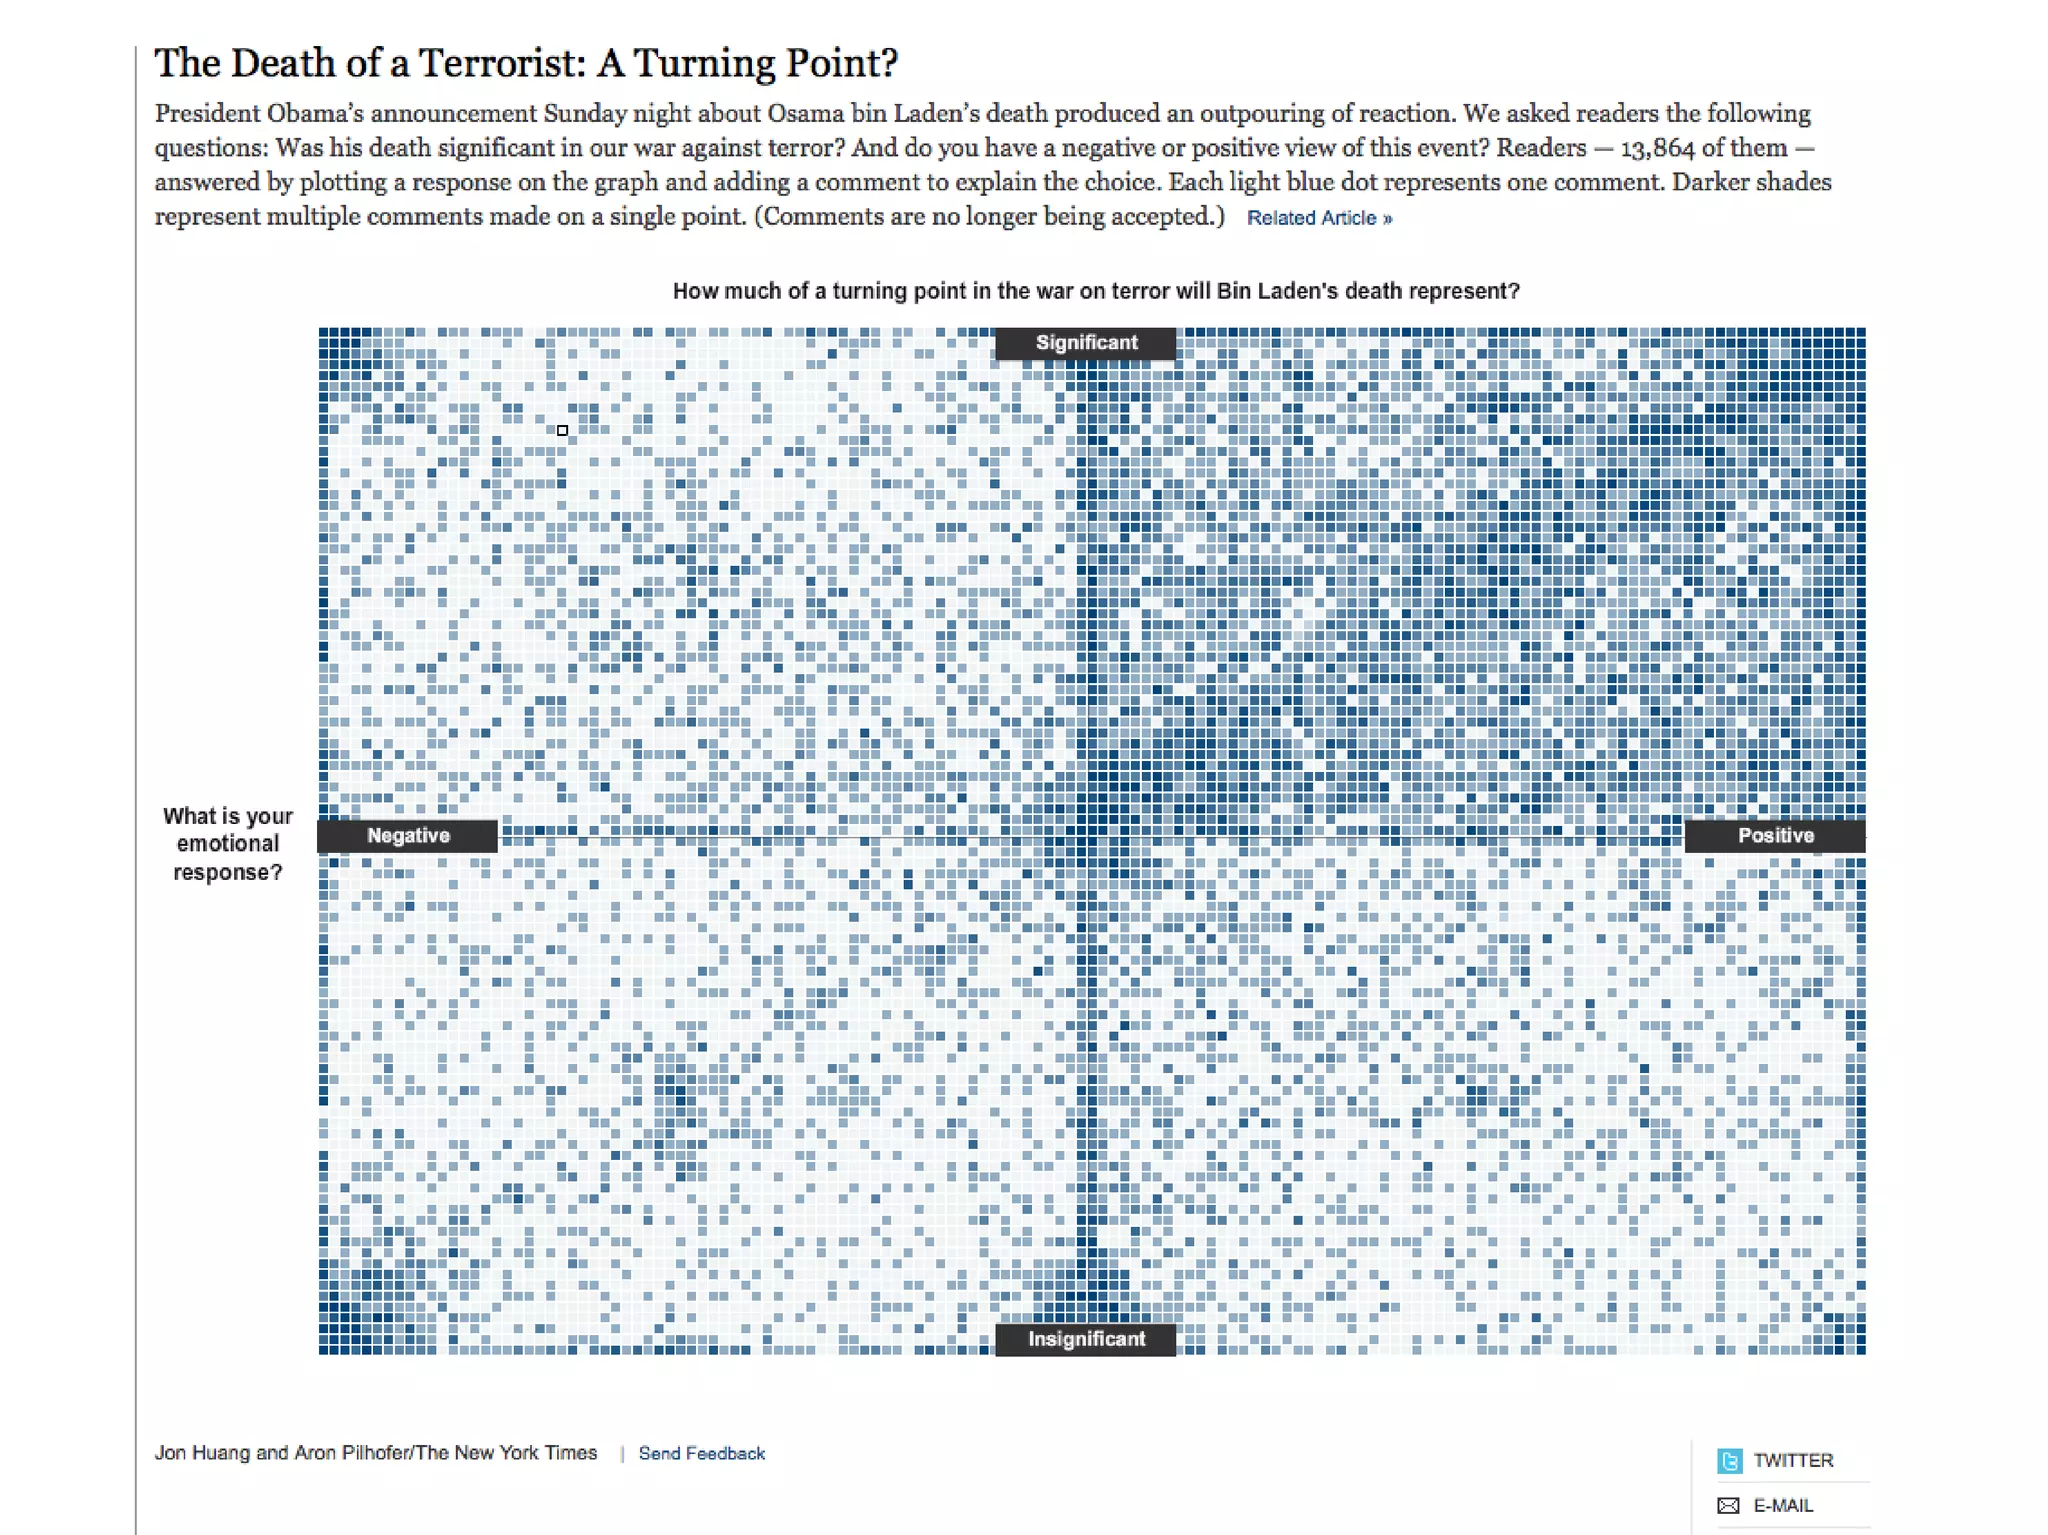
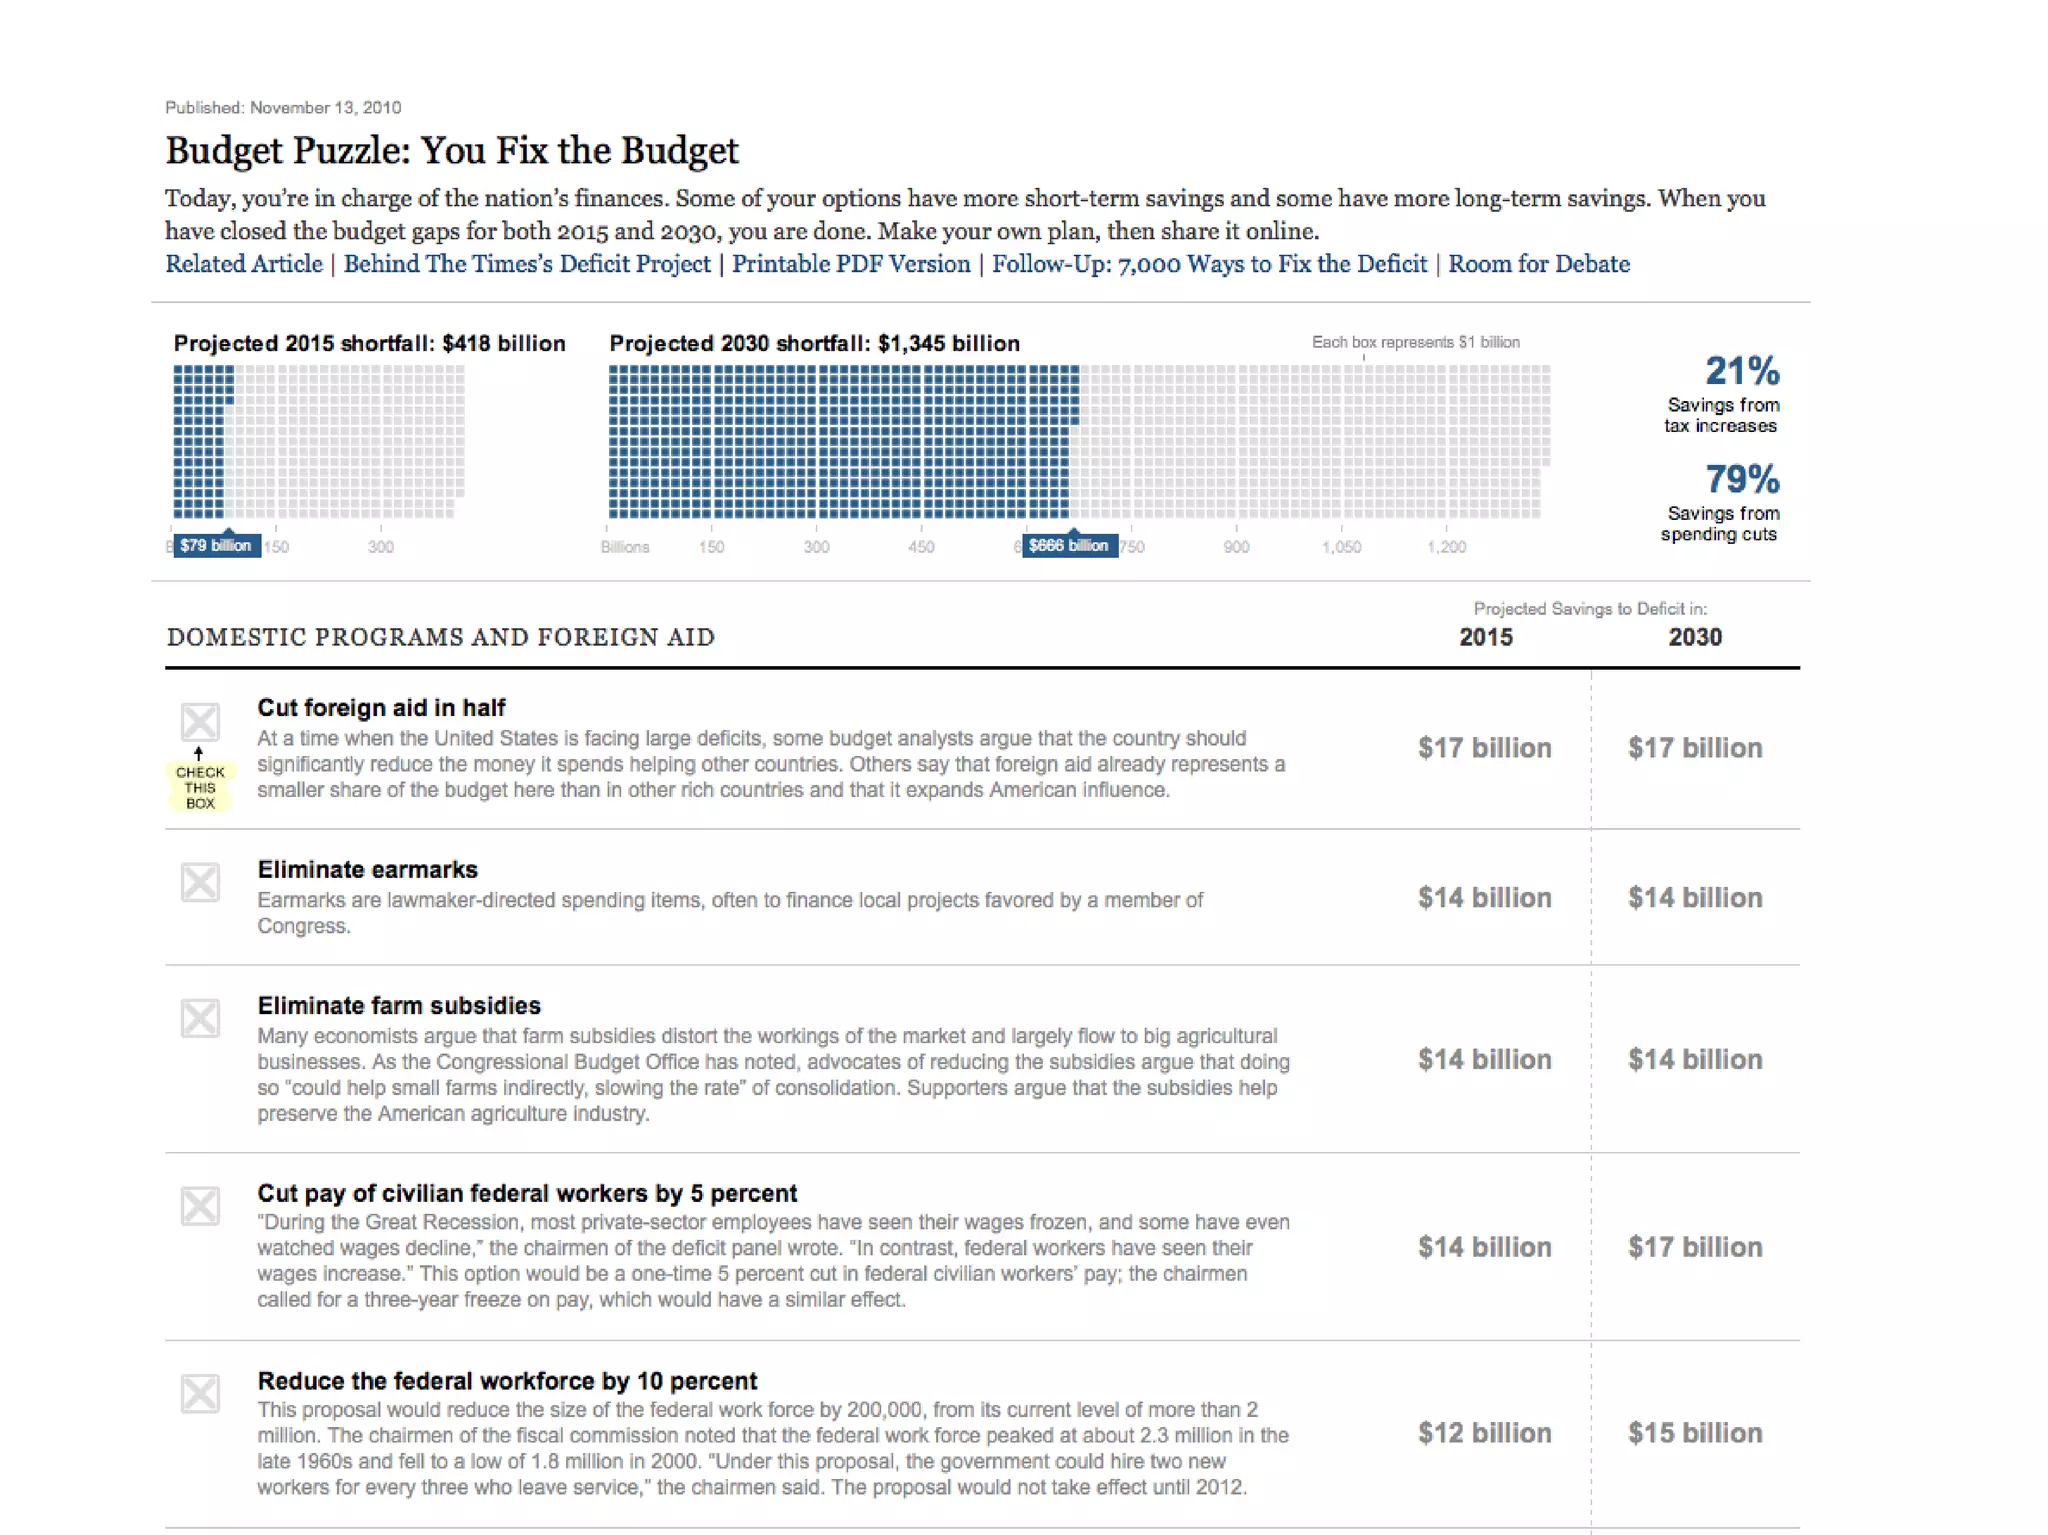
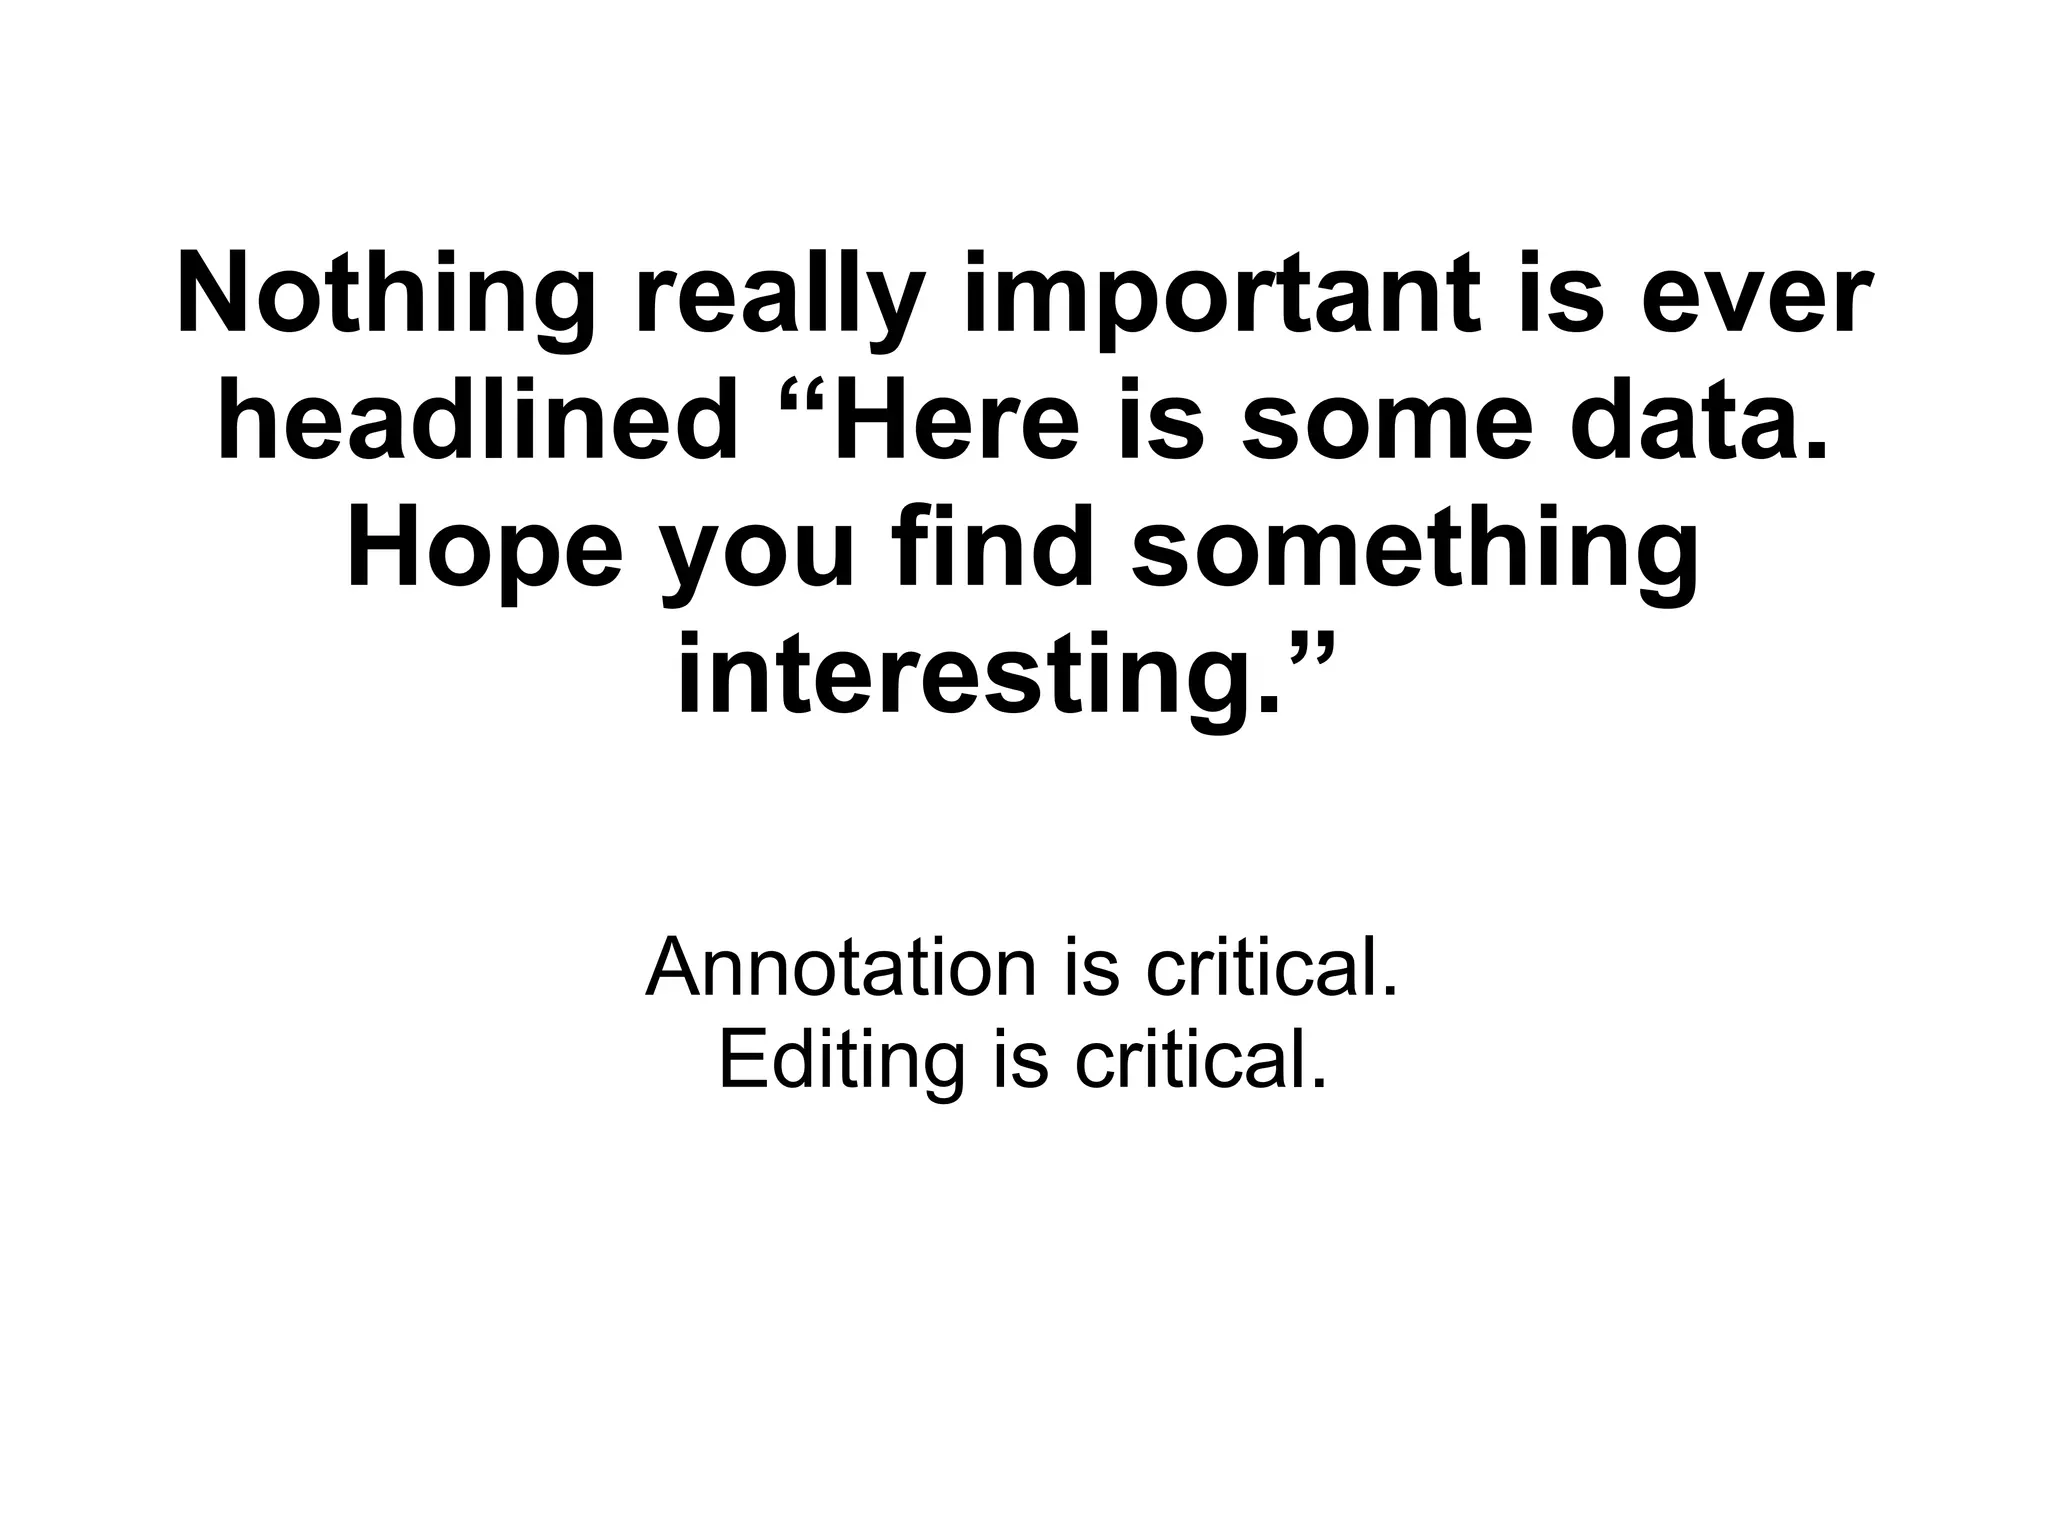
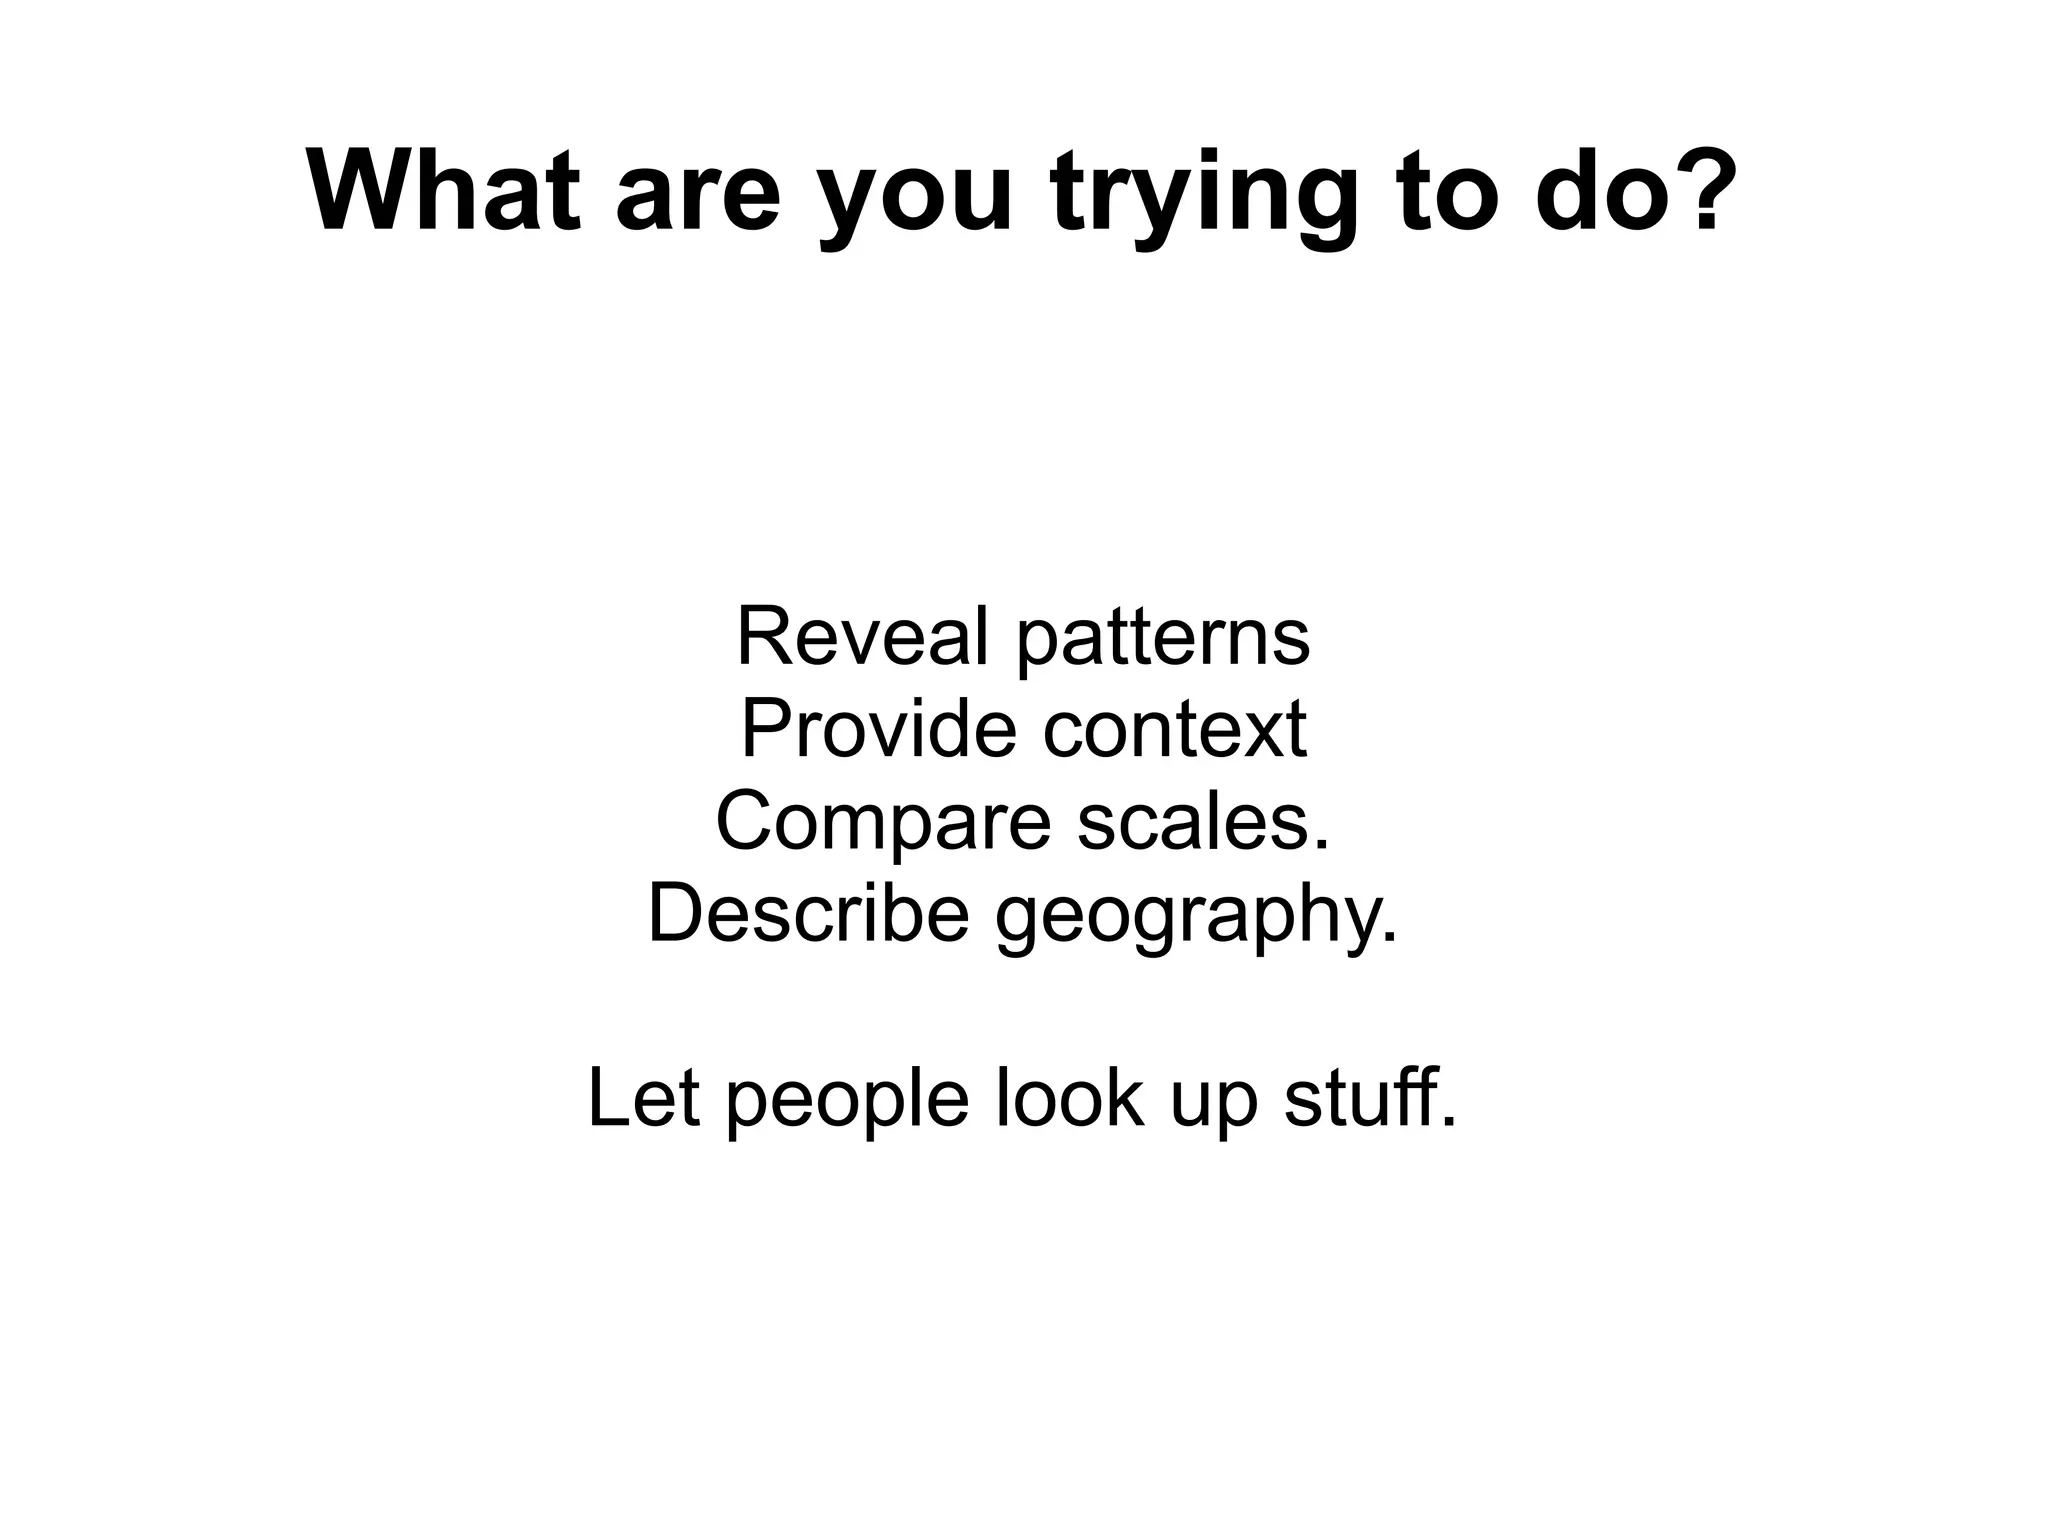
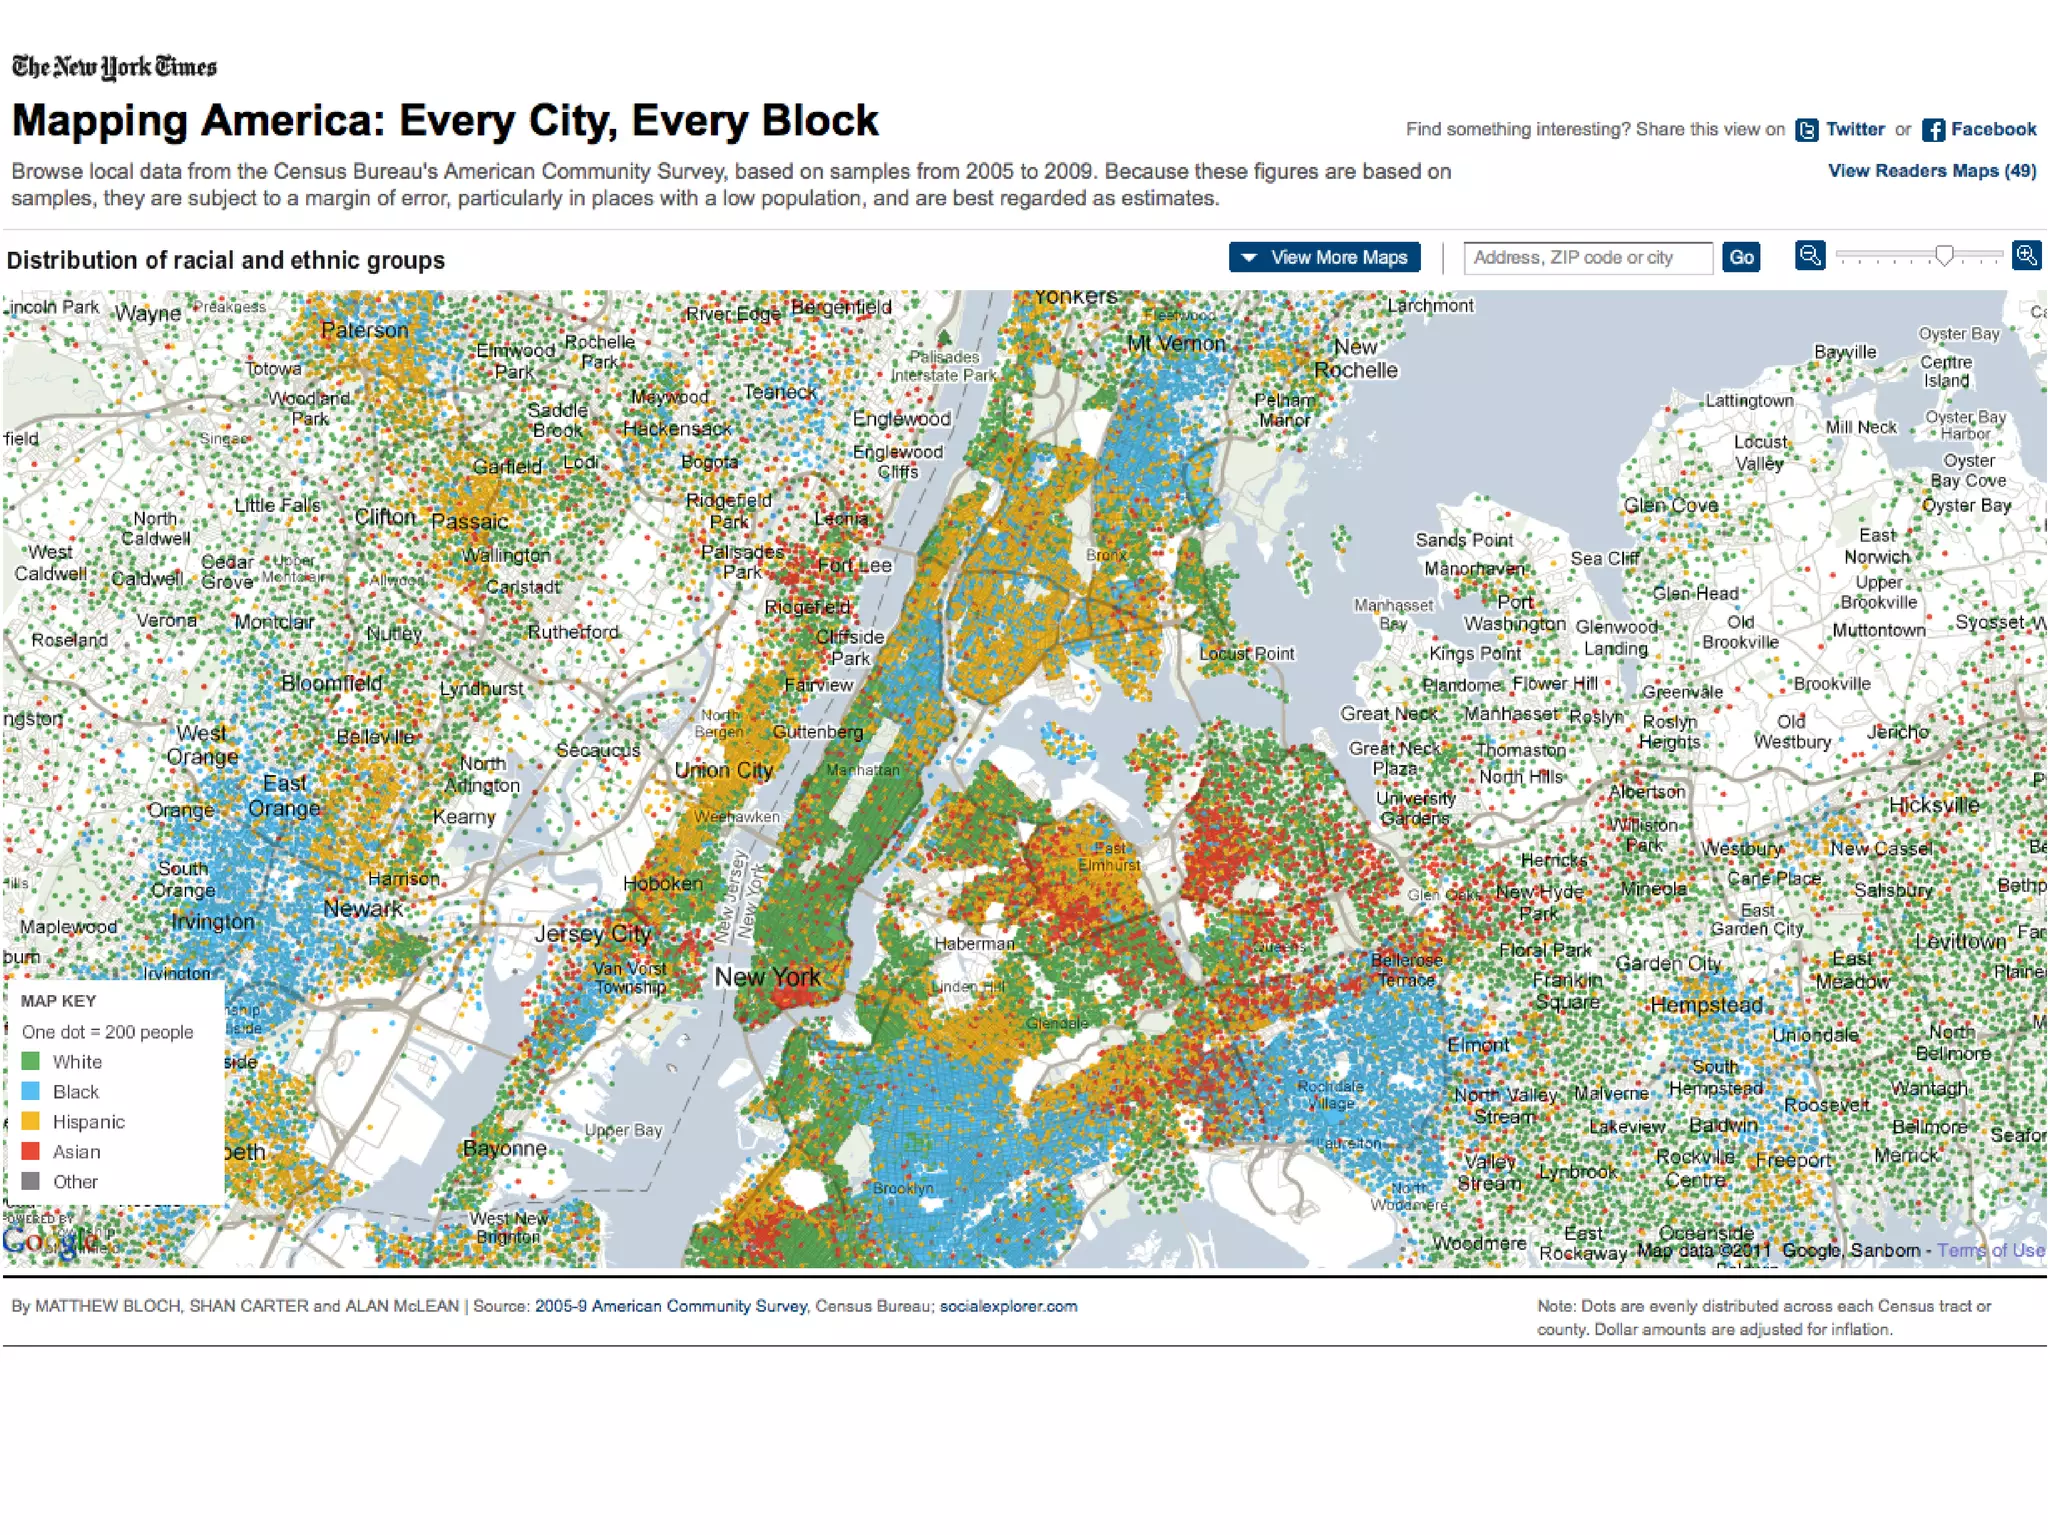


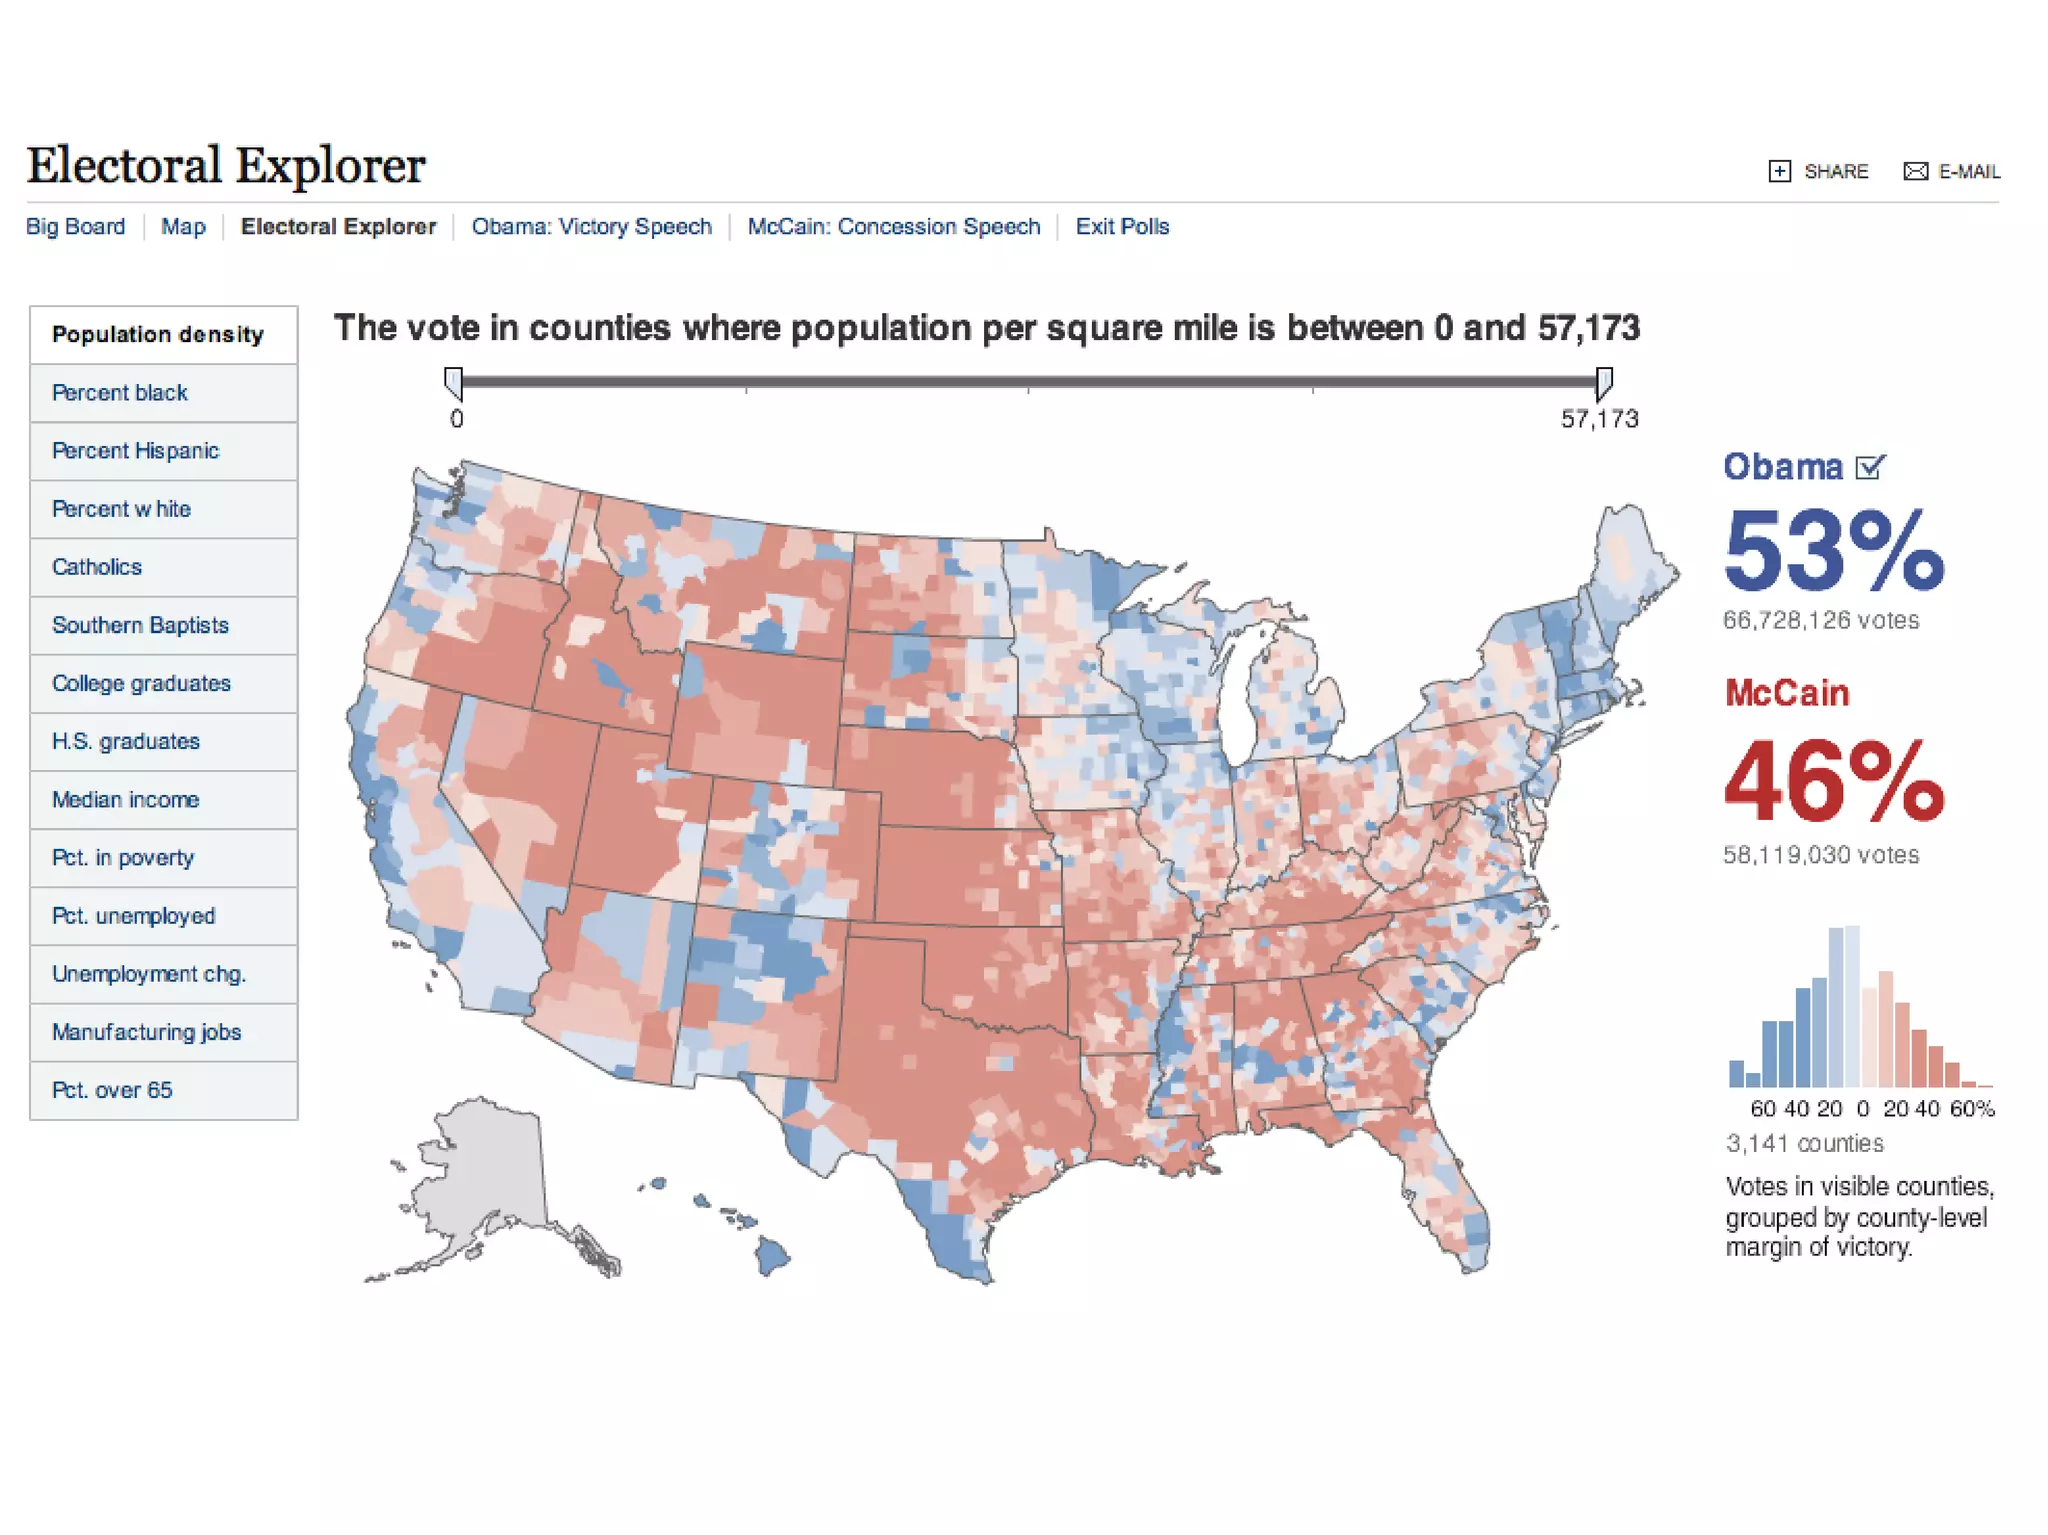
This document discusses data visualization and annotation. It notes that the goal of data visualization should be to reveal patterns, provide context, compare scales, and describe geography. Effective visualization also allows people to look up related information. The document emphasizes that annotation and editing are critical to help explain the data being presented. Generic solutions are rarely the best approach and the best journalism avoids vague templates.