Downloaded 103 times


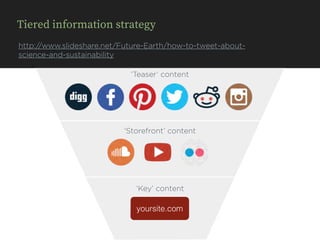
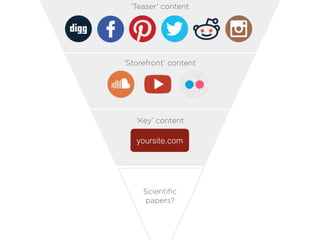
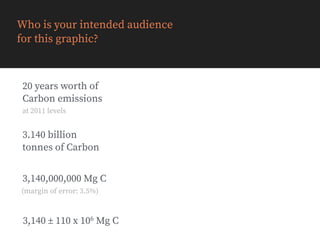
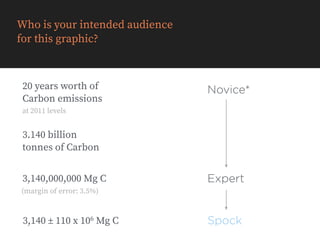


This document provides guidance on creating effective data visualizations and infographics. It discusses different tools that can be used for data exploration, visualization construction, and mapping. It emphasizes the importance of understanding the audience and goals of a graphic before creation. Tips are provided on telling stories with data through simple, unexpected, credible narratives. Examples of best practices from other designers are shared. The document encourages participants to apply the lessons by creating a graphic from an existing document and submitting it for feedback.


