Downloaded 145 times


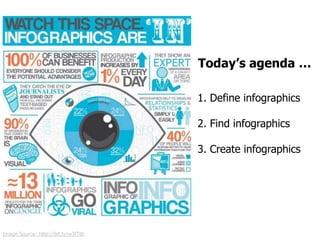


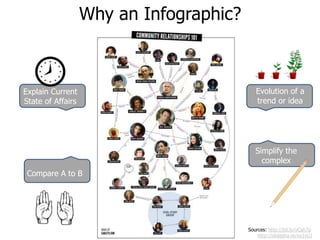
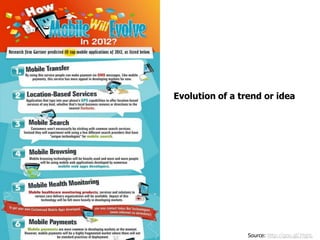

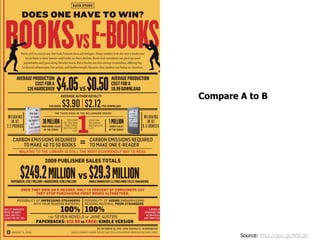

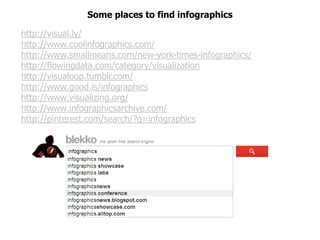

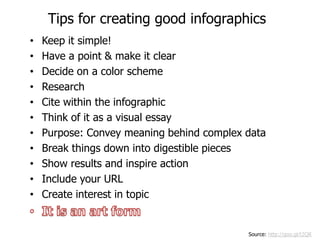
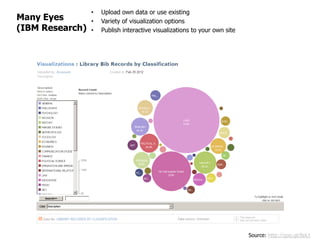
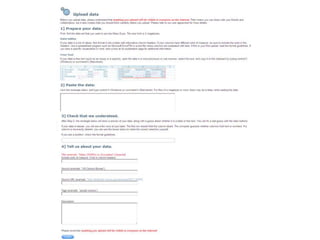
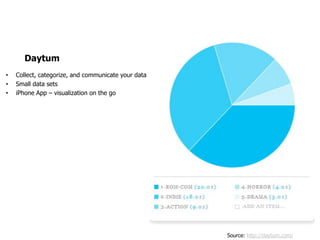


The document provides an overview of infographics, including definitions, purposes, and methods for creating them. It emphasizes the importance of simplicity, clarity, and effective presentation of complex information through visual means. Additionally, it lists various sources and tools for finding and creating infographics.