Objectives.
Discuss image reconstructionvia interpolation,
back projection, and iteration.
Describe CT image characteristics of image matrix,
Hounsfield Unit, and sensitivity profile.
Introduction
The CT processinvolves;
• data acquisition; the x-ray photons are created and
directed through the patient, where either they are
absorbed or they penetrate the patient to strike the
CT system’s detectors.(raw data)
• image reconstruction; the data are sorted so that
each pixel has one associated Hounsfield value.
(Image data)
• image display; the processed data are converted
into shades of gray for viewing.
5.
CT Image formation
•The x-ray photons that pass through the patient strike the
detector.
• If the detector is made from a solid-state scintillator
material, the energy of the x-ray photons detected is
converted to light.
• Other elements in the detector, usually a
photodiode,convert the light levels into an electric current
in analog format.
• Each detector cell is sampled and converted to a digital
format by analog digital converter (ADC) in the data
acquisition system (DAS) which is positioned within the
gantry near the detectors. Each complete sample is called a
view.
• The digital data from the DAS are then transmitted to the
central processing unit (CPU).
6.
Continuation
• X rayradiation move from the source to the
detector, through the patient’s body,every part of
the body attenuates radiation differently depending
on tissue density. The detector measures the
amount of radiation from different body tissues and
converts the radiation densities into electrical
signals.
• Conventional x ray systems produce 2 dimensional
images, with CT, 3 dimensional images are formed
by measuring and capturing radiation going
through the body at different angles.
8.
•The reconstruction processortakes the individual
views and reconstructs the densities within the slice.
•To create an image, information from the DAS must
be translated into a matrix. To do so, the system
assigns each pixel in the matrix one value, or density
number.
•This density number, in Hounsfield units, is the
average of all attenuation measurements for that
pixel.
•These digitized data are then sent to a display
processor that converts them into shades that can be
displayed on a computer monitor.
9.
Image reconstruction
Image reconstructionrefers to the process whereby a
computer manipulates data collected from the
detectors to create a CT image.
. These concepts include the use of algorithms, and
methods of interpolation.
• The reconstruction that is automatically produced
during scanning is often called prospective
reconstruction.
• The same raw data may be used later to generate
new images. This process is referred to as
retrospective reconstruction.
10.
Image reconstruction
Each imageis represented in form of a matrix .
•A matrix is a square arrangement of numbers in columns and
rows in digital imaging.
•Each square /tissue/picture element within the matrix is
known as a pixel and is assigned a particular number known
as CT number represented in form of Housefield Units.
•A pixel refers to the smallest discrete element of an image. It
contains length(L) and width(W) whereby W=L hence it’s a
square.
11.
•The CT numberassigned to each pixel is derived from the
average attenuation of the tissues within the pixel.
•The 3D element within a displayed image is known as a
voxel. Tissues are splitted by the detector into small volumes
called voxels.
•The CT number assigned to a voxel depends on the level of
attenuation through the body part. The voxel from bone has
higher ct number due to its higher high attenuation than that
of skin.
It contains width(W), length(L) and depth(H).
The depth corresponds to the selected slice thickness.
CT numbers
This refersto the attenuation coefficient of a
particular tissue. It’s a digital value assigned to each
pixel within an image and is represented in
Hounsefield units (HU).
CT numbers are on a scale of -1000 to +1000. air has
a value of -1000, water is at 0 and bone is at value of
+1000 HU.
BACK PROJECTION
•X rayradiation goes through the body tissues at different angles.
•Each attenuation value is the sum of all voxel attenuation values along the radiation
paths.
•Over 200 projections are taken and reconstructed. The number of reconstructed
projections determines how much fine detail is able to be appreciated on the final
image.
Continuation
• The finalvalue representing radiation received at
the detector is the sum of individual CT numbers of
tissue irradiated as the beam passes through it.
• Each projection is a linear series of numbers across
the sensor array.
• CT images are hence represented as a gradient of
pixels.
• Back projection algorithms treat images as a
discrete set of voxels to form a reconstructed
image.
Continuation
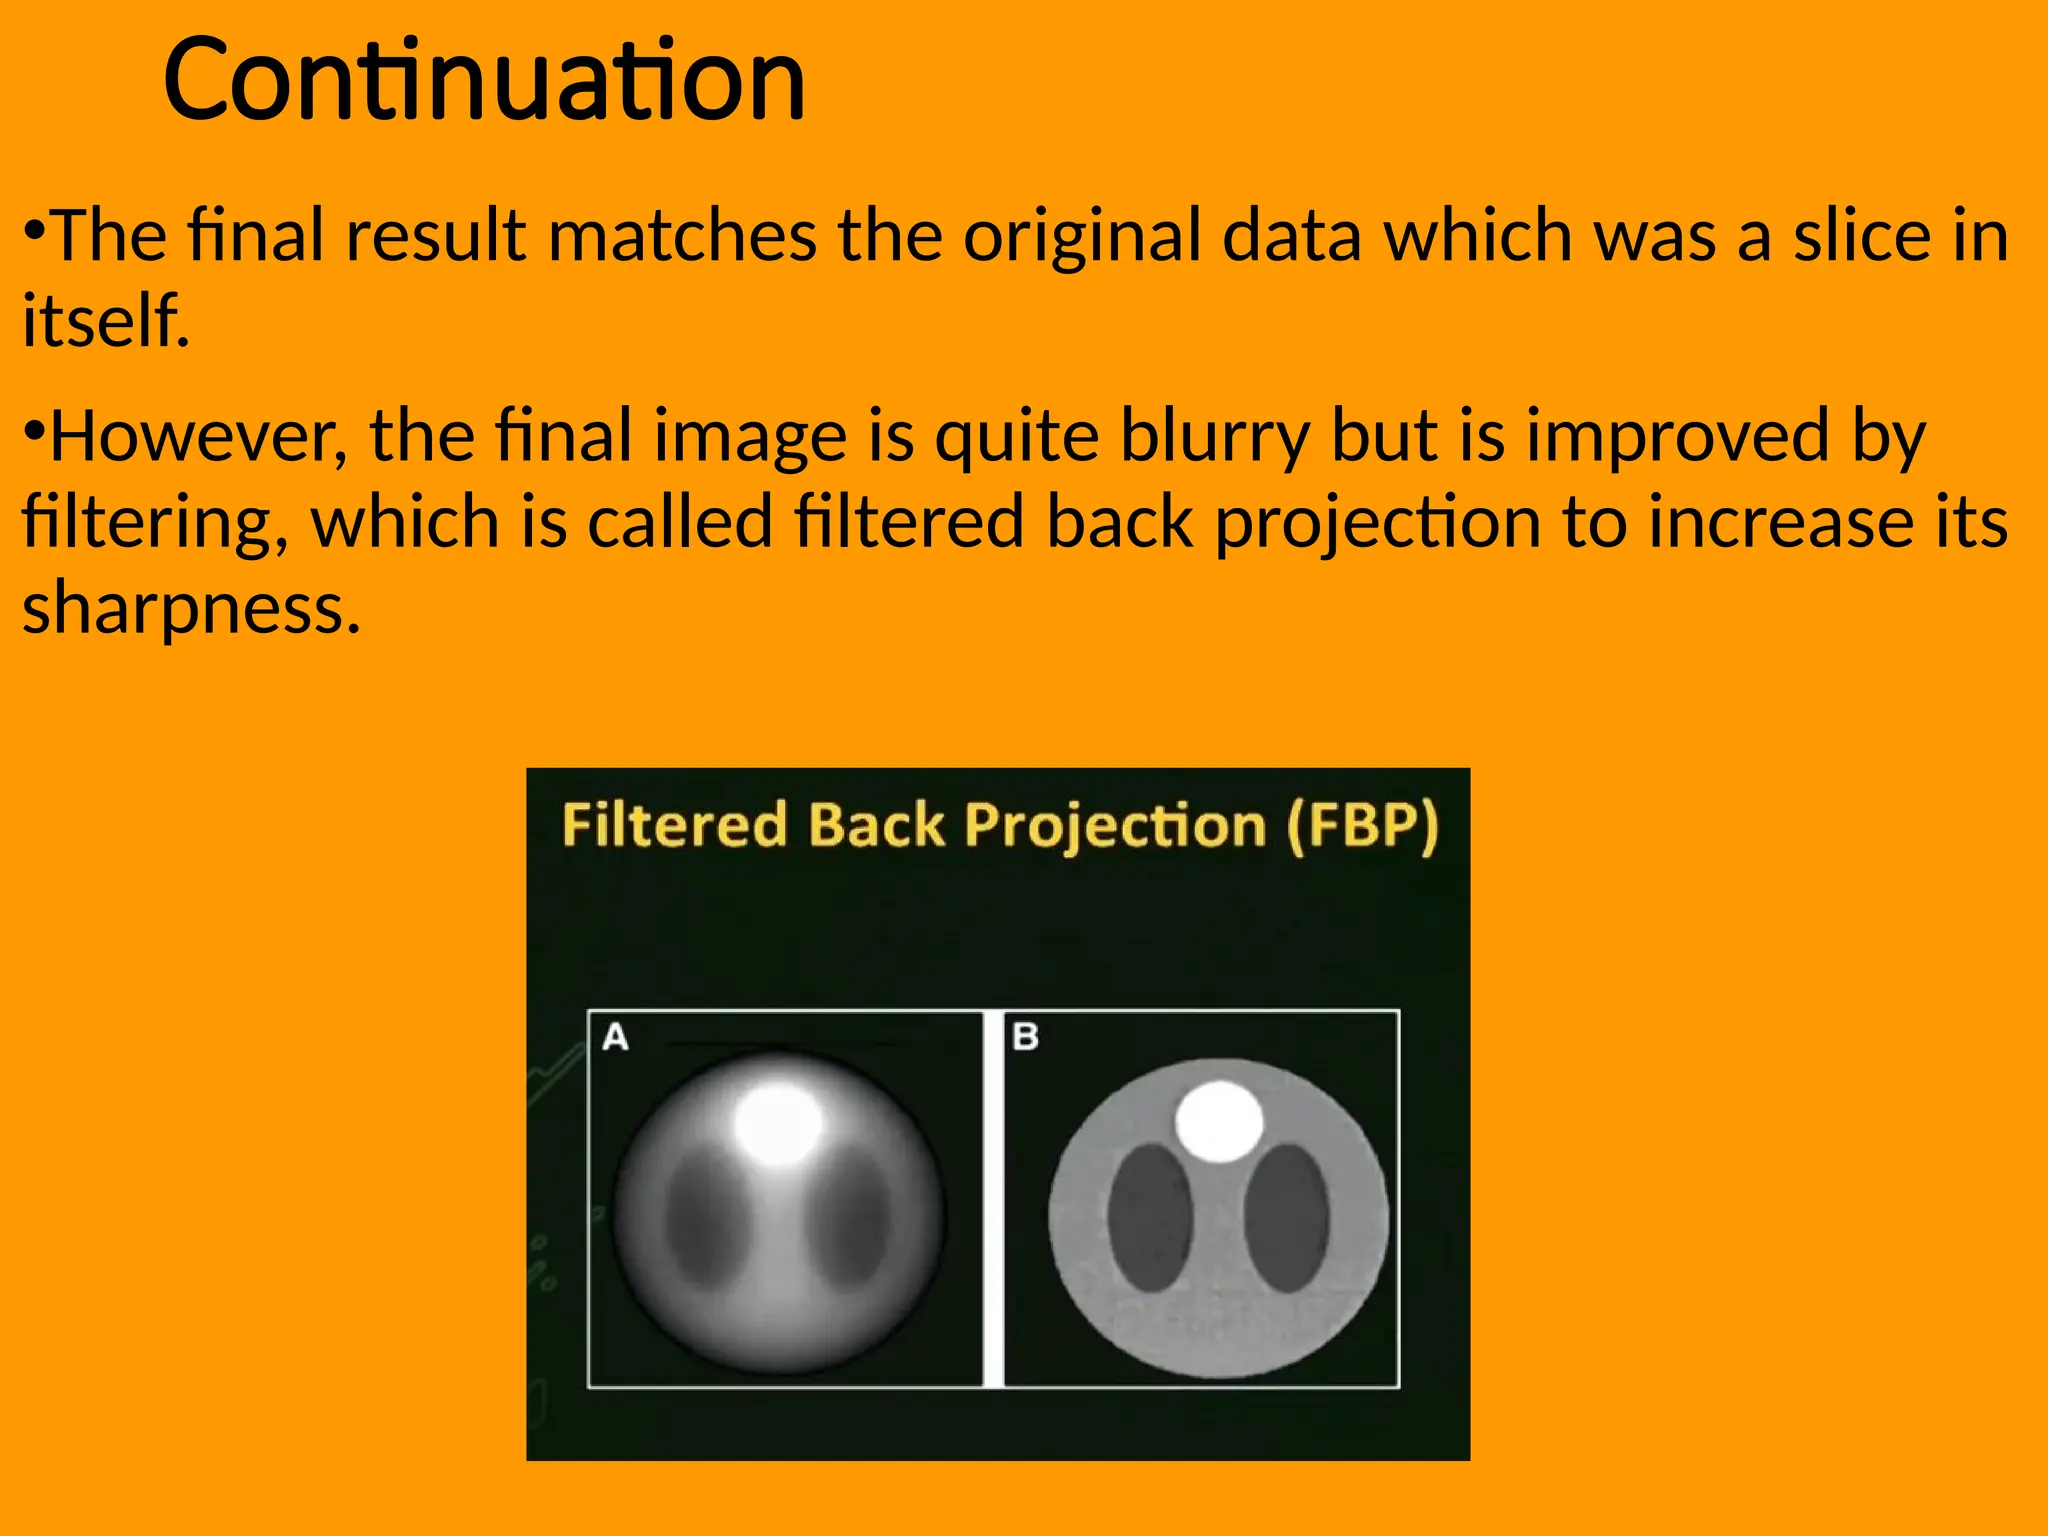
•The final resultmatches the original data which was a slice in
itself.
•However, the final image is quite blurry but is improved by
filtering, which is called filtered back projection to increase its
sharpness.
21.
ITERATIVE RECONSTRUCTION
• Amethod of improving image quality over time, by a
gradual reduction of image noise.
• It is achieved through a series of 3 major steps that are
performed repeatedly until a diagnosticly optimal resolution
image is obtained.
• Iterative reconstruction requires more computer capacity
but can result in improved contrast resolution at lower
patient radiation dose.
Step 1 Foward Projection.
• This can be explained using a 3 by 3 image matrix shown
below.
22.
Continuation
• The algorithmperforms summations of pixel values within
the matrix along linear radiation paths, the direction of
which equates to that of movement of x ray photons
through the patient’s body.
23.
Step 2 InverseModel
• The algorithm performs an inverse model that majorly
involves back projection, which is an opposite to Forward
projection, i.e summed pixel values are spread back in the
direction of their acquisition.
24.
Step 3 DenoisingModel
• The algorithm then employs methods of denoising thereby
performing image regulisation by removal of noise from the
image.
• In the 3 by 3 image matrix below, the pixel value 3 is
relatively high compared to its neighbouring values, if the
image is processed at this stage, it will be of higher noise
and of less quality, The algorithm performs denoising at this
stage by use of two methods;
• (A) Using the Average Pixel Value
• Replacement of the high pixel value with the average of all
pixel values within the matrix.
25.
Continuation
• This reducesthe high pixel value contributing to image noise
to a relatively closer value compared to the neighbouring
pixel values. However, the edges of the image are
compromised.
(B) Using themedian pixel value
• The algorithm re-arranges the pixel values in ascending or
descending order, to obtain a median pixel value which is
used to replace the high pixel value in the matrix.
• This method reduces the noise without compromising the
appearance of the edges of the image.
Step 4 TheSolver
• The algorithm then performs a method of combining the functions together,
compares the final result with the measured data and repeats the steps
consecutively until an optimal quality image is obtained to match its diagnostic
requirements.
Continuation
• Images obtainedat an earlier stage of iteration appear a little more blurry than
those obtained at later stages in due course of repeated iteration.
• A plotted graph of error against iterations demonstrates a gradually improving image
quality on repeated iterations over time.
32.
Continuation
• Over 128iterations can be performed by the algorithm and
each has a similar characteristic effect of reducing the error
in the image over time.
• LINEAR INTERPOLATION.
• Data interpolation is performed by a special computer program called
an interpolation algorithm
• To estimate a value between known values is known as interpolation.
Continuation
• Multi-planar reconstruction,an image post-processing
function, which involves the process of converting data
captured in a certain plane, usually axial, into another plane.
It is commonly performed with thin slice data from
volumetric CT in the axial plane, and is accomplished with
scanning in any plane via cross sectional imaging.
• The acquired data, for example, in the axial plane,can then
be converted to non-axial planes such as coronal, sagittal, or
oblique.
• Three 3D MPR algorithms are used most frequently:
• Maximum Intensity Projection (MIP)
• Shaded Surface Display (SSD)
• Shaded Volume Display (SVD).
37.
Significance of imagepost processing
• It is a valuable tool in clinical application due to ability to
provide additional diagnostic information.
• It allows acquisition of anatomical information from original
images giving functional and molecular information.
• 3D rendered images provide views of the imaging volume
from different angles.
• MPR can be applied to all cross sectional imaging
modalities, including MRI and for nuclear medicine.
38.
MAXIMUM INTENSITY PROJECTION(MIP)
• This comprises projection of voxels with highest attenuation
value on every view through out the volume onto a 2D
image.
• For each XY coordinate, only the pixel with the highest CT
number along the Z axis is represented so that ina single Bi-
dimensional image, all dense structures in a given volume
are observed i.e, it is possible to observe all hyperdense
structures in a volume independently of their position.
• This tends to display bone and contrast material filled
structures preferentially. Its primary clinical application is to
improve detection of pulmonary nodules and asses extent
of perfusion. It also aids in characterizing the distribution of
small nodules. Also in assessing size and location of vessels
including pulmonary arteries and veins.
Continuation
• MIP imagesare widely used in CT Angiography because
they can be reconstructed very quickly. MIP images display
the higher CT numbers in a volume of interest when
projected into a new plane.
• Advantages.
• MIP reconstruction is mainly used to show the vessels with
contrast material in CT angiography to provide clear view of
lesions.
• It is used primarily in detection of pulmonary nodules.
41.
SURFACE SHADED DISPLAY
•This reconstruction algorithm produces surface rendered images that
provide a realistic 3D view of a surface of interest within the aquired
volume.
• Initially applied to bone imaging and now is used regularly for virtual
colonoscopy.
• SSD identifies a narrow range of values as belonging to the object to
be imaged and displays that range.
• The range displayed appears as an organ surface that is determined by
operator-selected values. Surface boundaries can be made very
distinctive and can provide an image that appears very 3D
• Such an image is called volume rendered.
• Shaded volume display is very sensitive to the operator-selected pixel
range; this can make imaging of actual anatomical structures difficult.
SHADED VOLUME DISPLAY
Acomputer can be programmed to use the acquired data to generate a
3D recognizable image, enabling an edge enhanced visualisation from
an extra-luminal perspective or endoscope. Surface boundaries can be
made very distinctive and can provide an image that appears 3
Dimensional.
Such an image is called volume rendered.
The advantage with this is it allows visualization of the structure beyond
the surface along with vascular anatomy, and can hence be applied in
detection of any blockage in vessels.
Shaded volume display is very sensitive to the operator-selected pixel
range; this can make imaging of actual anatomical structures difficult.
CT ARTEFACTS
• ACT image artefact refers to a discrepancy between
reconstructed values in an image and the true attenuation
coefficients of the object.
• CT image artefacts are common and occur for various
reasons. Knowledge of these artefacts is important because
they can mimic pathology, and can degrade image quality.
• They can be classified according to the underlying cause.
(A)Patient based artefacts.
• Motion artefact.
• Transient interruption of contrast.
• Clothing artefact
• Jewelery artefact
46.
Motion artefact
Motion artifactis a
patient-based artifact that
occurs with voluntary or
involuntary patient
movement during image
acquisition.
Misregistration artifacts,
which appear as blurring,
streaking, or shading, are
caused by patient
movement during a CT
scan. Blurring also occurs
with patient movement
during radiographic
examinations.
47.
Transient
interruption of
contrast.
Transient interruptionof
contrast of the pulmonary
arteries. It results from an
increases in non opacified
flow contribution from the
inferior vena cava (IVC) to
the right side of the heart.
This can occur when the
patient takes a deep
breath just before the
scanning
This results in decreased
intra-thoracic pressure
with a subsequent
increase in venous
48.
Continuation
(B)Physics based artefacts
•Beamhardening
•Cupping artefact
•Streak and dark bands
•Metal artefact/high density foreign material artefact
•Partial volume averaging
•Quantum mottle
•Photon starvation
•Aliasing
•Truncation artefact
49.
Beam hardening
When thex-ray beam travels through an object, the low-energy photons
are absorbed more than the high-energy photons
50.
Cupping artefact
The centreof an
object is usually
the thickest and,
therefore, the
beam will become
harder in the
centre than at the
periphery and is
assigned lower
Hounsfield units.
51.
Partial volume
artefact
If adense object only partially
protrudes into a detector stream
the attenuation is averaged with
its surroundings and it will be
assigned a lower Hounsfield unit.
In the image above, the dense
circle lies on a less dense
background. The object fills
detector stream 2 resulting in a
very high attenuation (white). In
detector stream 3 none of the
dense object is imaged and so
the attenuation is low (black). In
detector stream 1 the object is
only partially imaged and so the
attenuation is an average
between the dense object and
52.
Photon starvation
When toofew photons
reach detector elements,
strong streaks appear
through paths of high X-
ray attenuation and an
image becomes
completely useless. This
photon starvation artifact
phenomenon occurs
frequently when a pelvis
or shoulder is scanned
with thin slices
It is also a source of streak
artifacts
53.
Aliasing artifact
Aliasing artifact,
otherwiseknown
as undersampling,
in CT refers to an
error in the
accuracy
proponent of
analog to digital
converter (ADC)
during image
digitization.
54.
(C)Hard ware basedartefact
• Ring artefact
• Tube arcing
• Out of field artefact
• Air bubble artefact
• Windmill artefect
• Cone beam effect
• MPR artefact
• Zebra artefact
• Stair step artefact
55.
Ring artefact
A ringor arc artefact in a CT
is a hardware related artefact
that occurs due to a defective
or miscalibrated detector.
It is more common with
third-generation CT scanners
with
solid-state detectors.
56.
Tube arcing
Tube arcingoccurs when
there is a short-circuit
within the tube, typically
from the cathode to the
tube envelope.
The result is a temporary
loss of x-ray output and a
localized artifact.
57.
Out of fieldartifact
also known as incomplete
projection artifact.
is due to part of the patient
existing peripheral to the
field of view of the CT scanner.
This can be a particular
issue in obese patients
who only just fit within
the scanner bore
58.
Air bubble artefact
Theair bubble artifact on
CT is due to the
presence of
abnormal gas in the oil
coolant which surrounds
the x-ray tube.
The artifact manifests as
subtle low density, which
has only been described
on brain scans.
59.
Windmill artifact
is animage
distortion in the
axial plane,
encountered
during helical
multidetector
acquisitions.
60.
Cone beam effect
Conebeam effect artifacts
are seen in multidetector
row CT (cone beam CT)
acquisitions.
Modern CT scanners use
more detector arrays to
increase the number of
sections acquired per
rotation.
This causes the x-ray beams
to become cone-shaped as
opposed to fan-shaped
61.
Stair step artefact
Stairstep artifacts appear
around the edges of
sagittal and coronal
reformatted images when
wide collimations and
non-overlapping
reconstruction intervals
are used