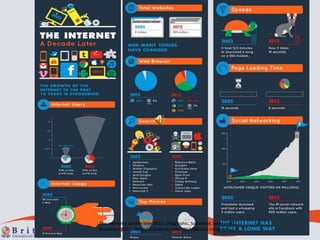
1. The internet a decade later 2012, infographic, SodaHead, accessed 01
November 2012, <http://edudemic.com/2012/08/best-infographics/>. 1
2. Infographics; a valuable tool in the
teaching & learning of visual literacy.
Monica Morscheck
Head Librarian and E-Learning Coordinator
mmorscheck@bisphuket.ac.th
@MonicaMLib
#iasl
www.bisphuket.ac.th
3. This presentation will look at many
aspects of the infographics;
1. Where to find examples on the web
2. How to catalogue infographics
3. Using infographics to teach visual literacy
4. How to create your own
3
4. Why I like infographics?
• They Are Concise. They say that a picture is worth a thousand
words.
• They Are Creative. Most infographics use an amazing blend of
information and art.
Edick, H 2012, 'Why I love infographics', Edudemic, 16th March 2012, accessed 01 November 2012,
<http://edudemic.com/2012/03/why-i-love-infographics/>.
• They help us understand complex data.
Byrne, R 2011, 'Picture this', School Library Journal, June, p.15.
• They help us understand procedure.
4
5. Amin, H n.d., They draw & cook, infographic, Easy Funfetti, accessed 01 November
2012, <http://www.theydrawandcook.com/recipes/easy-funfetti-by-hanisha-amin--3>.
5
6. Crooks, R 2010, What is a stock, infographic, Mint, accessed 01 November 2012,
<http://www.mint.com/blog/investing/what-is-a-stock-10072010/?display=wide>. 6
7. Information graphics or infographics
are visual representations of
information, data or knowledge.
Ross, A 2009, 'InfoGraphic Designs: Overview, Examples and Best Practices', InstantShift, blog, 07.06.2009, accessed 23
September 12, <http://www.instantshift.com/2009/06/07/infographic-designs-overview-examples-and-best-practices/>.
….These graphics are used where complex information
needs to be explained quickly and clearly…..
In Schools….
These graphics can be used where complex information
needs to understood by a visual learner.
These graphics can be created when complex information
needs to be presented quickly and clearly.
7
9. Rossen, B 2012, An
infographic is, photograph,
Hot Butter Studio, accessed
01 November 2012,
<http://mashable.com/201
2/07/18/lego-
infographic/>.
9
11. 1. Where to find examples on the web.
For teachers and librarians
http://www.only2clicks.com/pages/monicamlib
11
12. 1. Where to find examples on the web.
Teachers, Librarians and Students searching
Any search engine using an advanced search
• Keyword infographic
• Limited time scale
• Keyword statistics
12
13. Choosing infographics to use with your students?
Avoid “too much information” (TMI).
The purpose of an infographic is to distill thought and
reduce the clutter.
Femando, A 2012, 'Killer infographic! But does it solve TMI?', Communique, March-April, pp.10-12.
13
14. Years 2-4 Wordle Tagxedo
Years 4-6 Hohli Inkscape
Years 6-8 Prezi Glogster Piktochart
Year 9up creatley Gapminder easel.ly
www.smore.com
14
23. 2. How to catalogue infographics
They can be uploaded into any windows or web based
catalogue.
They can be uploaded as a file or as a web link.
Include a full catalogue record (for copyright), create
subjects unique to the student population.
BISP: Oliver v.5 a web based library cataloguing system.
23
24. Here is how the catalogue record appears as a file or website entry.
24
26. I also edited the resource type parameters of Oliver and
allow the list of infographics I have catalogued to appear.
Often do this for projects I am working on with students.
26
27. ??
I still haven’t worked out to include
interactive infographics into the catalogue.
http://shaheeilyas.com/flags/
27
28. BIS Libraries has NO
Information Literacy
continuum/curriculum
Berkowitz, R and Eisenberg, M 2012, Big6, , accessed 4 September
2012, <http://big6.com/>.
28
30. 3. Using infographics to teach
visual literacy.
Visual Literacy is a component of the BIS Libraries
Information Literacy continuum.
I define Visual Literacy as "The ability
to make sense, interpret, and express ideas using images,
both still and moving”.
At BIS, traditionally Visual Literacy has been taught using
picture books or still images such as a photograph in the
Early Years, Primary Years and in Years 7 & 8.
30
31. Visual Literacy resources… anything by
Debbie Abilock
Abilock, D 2010, Read, understand, evaluate, create, Diglitnews, USA, accessed 25 September2012, <>.
31
32. Visual Literacy and infographics
and non-fiction
Use of information
The synthesis of the information
The evaluation of the information
32
33. I have created a skills set for Year 7 and up
EXCEEDING EXPECTATIONS MEETING EXPECTATIONS WORKING TOWARDS
Use of The student can draw The student can identify the The student recognises the
information conclusions and make infographics topic and main topic intended purpose from
inferences on the topic.* concepts. the art/design.
The synthesis of The student predicts what The student takes notes on The student checks that the
the information further information would be the topic and is able to data and language used is
of value to the topic. combine this with other appropriate for the topic.
information to answer
questions.
The evaluation The student verifies the The student chooses to use The student can identify the
of the information represented via an infographic that is from an date of publication, the
information a third party. ** organisation or creator(s) creator(s) and their contact
The student suggests what working on behalf of an information.
bias may be present. organization.
33
34. *Although some information graphics are only intended to
display data, the overwhelming majority of information
graphics … have a communicative goal or intended
message.
'Effectively Realizing the Inferred Message of an Information Graphic' 2005, CiteSeer, accessed 2 September 2012,
<http://citeseerx.ist.psu.edu/viewdoc/summary?doi=10.1.1.122.2985>.
** Information experts predict that by 2020, there will be
40 times as much available data as there is now… to a new
breed of data designers and information artists who …
making complexity simple.
Rouse, R 2010, 'TOO MUCH INFORMATION? NOT FOR THE NEW DESIGN BREED', The Evening Standard, 26 July, p.27
34
37. EXCEEDING EXPECTATIONS MEETING EXPECTATIONS WORKING TOWARDS
Use of The majority of coral reefs in The biggest coral reefs in the The infographic shows where
information the world are in the Asia world are in Indonesia and coral reefs are located in the
Pacific region. Coral Reefs are Australia. world.
in the warm waters between
latitude…
The synthesis of What are countries of the Australia has 17.22% of the The name of the countries
the information world have small reefs? Are world’s reefs, these are are missing and the %’s do
any of the reefs in danger? situated in NE and NW not add up to 100%.
Australia, the largest is know
as the Great Barrier Reef.
The evaluation The reefs of the world are The organisation is a design It was made in 2012 by the
of the listed company called Saint H. Saint H.
information athttp://en.wikipedia.org/wi
ki/Coral_reef#Locations.
The student suggests what
bias may be present??
37
38. Research
Visual representations should … use cueing
strategies to attract attention and influence what
information learners will extract. When students
do not know what information to attend to, they
are likely to draw incorrect conclusions from the
[infographic ].
Patrick, M etal 2005, 'Visual Representations of DNA Replication: Middle Grades Students' Perceptions and
Interpretations', Journal of Science Education and Technology, vol. 14, no. 3, September, pp.353-365.
38
39. 4. How to create your own.
TOPIC KNOWLEDGE CONTENT VISUAL
http://spyrestudios.com/the-anatomy-of-an-infographic-5-steps-to-create-a-powerful-visual/
39
Our keynote speaker Eppo van Nispen talked at length regarding libraries being modern in a digital age and the rapid advances in technology. I open with this slide as it is a favourite infographic, it is just coincidence that it reflects one of the themes from Eppo’s opening keynote.
This is me, and I work at a school with tradition rather than modern. We have internet, wifi, 1-1 laptops in the sec and trialing iPads sets in the primary, but Library and IT are not agenda items in the school. I am very much a digital teacher librarian, I like and embrace technology. Much of what I will be looking at today has been spoken about by the keynote speakers such as Joyce Valenza and Ross Todd. I will be going at a much slower pace, I want you to stop and ask me questions as you go, I like to share but I want you to take away with you something that you think you can use in teaching and learning back at school.
Although I currently do most of my t’ing in Sec I am originally a primary school teacher and I do believe a picture tells a thousand words. I am often in my PL working with the Pri TL because I get picture book withdrawal. I found these reasons which come from the education environment, but I had to add my own.When researching I tried to look at sources from the education environment, not the graphic, commercial…
Example of procedural, could use this with a year 2/3 class, where there is a focus on procedural writing.
Example of factual and procedural,
I have added my own definition, this definition became clearer to me after I started using them for teaching and learning.
Current PD development that has been running at my school via this group. The workshops have been about the brain and learning to learn. One of the components was styles of learning and visual learning, something I thought was missing from the Sec programme. So I decided to do something about it.
I decided on infographics for visual learning, it was not a BHAG, but it was an idea that reflected the school user base, many esl students. So here is an infographic examples concisely and creatively.
Why choose infographics? I came across this infographic that attempts to define them….and straight away I disagreed with some of the content, is written text always disengaging? Do all uses of infographics say “a-ha” after they see one…
This is where I have listed 100’s of examples which might be a good starting point, many with creative commons ok and search able, like Flickr blue mountain which Joyce Valenza mentioned in her keynote yesterday.
They are not hard to find via a simple search with the word infographic as a search word, I have tried some of the search engines talked about such as Mashpedia, instagork but they didn’t give as good results as Google advanced, maybe because I teach students to use keyword infographic and advanced search.
Of course I intend to try smore.com which Joyce Valenza spoke about, it is an interactive infographic creator, but I have only trialed one interactive infographic evaluation with students and I will talk about my teaching and learning programme in a minute. These I have used or students have used successfully. They have free versions many of which you don’t have to create an account for, which is nice for younger children.Yesterday in Stephen Shephard and Derek Nelson’s presentation there was a by James from yr4 who used graphy online to create a statistics representation , the presenters didn’t know they were using infographics
For young
Yr7/8 lap experiment write up
Yr9 humanities
Apart from a link
I know these IL outlines and here are some more
I have had a recycle an old one I wrote in 2006 for my primary library, as I have a new TL and she is demanding one.Basically I keep a tally of the IL skills I do with each year group over the year and by the end of second term if there is some missing then I will make sure I have focused on it, I use a skills/topic list for each year group and these are based on what has been programmed in the classroom for the year.Ross Todd spoke about this during session 1, he also talked about the library being a place of critical thinking/learning, not just a place to go and study/do some research often independently.
This was given by me to the students
Whole class activity you may project the infographic, but I use and link to the Library website usually the first time so students learn where and how to use the catalogue
The subjects of this study were middle school girls (n = 21) participating in a 2 week mathematics and science
ORGINAL THOUGHTS ARE VISUAL CONTENT KNOWLEDGE, I included the word “Topic” to this concept
Infographics can be non-digital, yesterday I was in a session with Steven Shephard and Derek Nelson and students from Qatar Academy, Yusef and Ru-pert did a poster/infographic on their understanding of infographics
Something you could be doing as soon as you get back to school….
Piktochart, free account, in 2 lessons, one lesson the research, one lesson the creation….used in humanities as part of a collaborative They can send these electronically via Edmodo, I will enter some into the library catalogue with the students as the author
Great way to use your own infographics and then you have a valid author, valid information, when doing the evaluation process….I want to use this for IB: TOK / EE students as a way of presenting their surveys their own surveys