Infographics and-the-classroom
•
6 likes•2,758 views

This document discusses using infographics in the classroom. It begins with an icebreaker poll about information preferences. It then defines infographics and discusses how they can be used by teachers to engage students and teach complex topics visually. The document provides examples of infographics and discusses websites like Visual.ly and Piktochart that can be used to create infographics. It emphasizes that infographics tell stories with data and images in an easy to understand way.

Recommended
More Related Content
Similar to Infographics and-the-classroom
Similar to Infographics and-the-classroom (20)
More from Mark Richardson
More from Mark Richardson (11)
Recently uploaded
Recently uploaded (20)
Infographics and-the-classroom
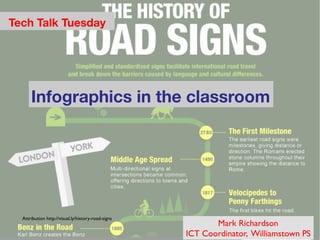
- 1. Tech Talk Tuesday Infographics in the classroom Attribution http://visual.ly/history-road-signs ! Mark Richardson! ICT Coordinator, Williamstown PS!
- 2. Ice Breaker ! • When%you%look%for%informa0on,%which% describes%you%best?%Do%you%like…………% %%%%%A.% %Text% %B. %Graphs% %C.% %Timelines% %D.% %Images% %E.% %All%of%the%above(
- 3. • A.%Text%%B.%Graphs%%C.%Timelines%%D.%Images%% E.%All%of%the%above( Ice Breaker - Results !
- 4. What are Infographics ? ! •(My(first(view(was(of( this(con6nuum( ( Data(Collec6on(>>>( Graphs(>>>( Interpreta6on(>>>( Infographics( Early&nuclear&bombs&in&Kilo&tons&
- 5. What are Infographics ? ! • Why Infographics are Important. http://www.slideshare.net/ripetungi/why-are-infographics- important ! • WHEN THE VISUAL CLEARLY REPRESENTS THE CONTEXTUAL RELATIONSHIP OF THE DATA WITHOUT PREJUDICE, TO PRESENT A MEANINGFUL AND INFORMATIVE NARRATIVE! • STATISTICAL GRAPHICS OF COMPLEX IDEAS COMMUNICATED WITH! CLARITY, PRECISION, AND EFFICIENCY!
- 6. How could Infographics be used by teachers?! • There are infographics on many subjects, you just have to find the ones you want.! ! • Many are complex and involve different reading skills.You may need to teach students how to read and interpret the data. ! ! • Analysis of infographics should leverage the Higher Order Thinking Skills of Bloom’s Digital Taxonomy.!
- 7. How could Infographics be used by teachers?! • While many are more useful for teaching secondary # students, ! many ! infographics! are useful! for many grade! levels as they ! have! many! layers ! of meaning. !
- 8. How could Infographics be used by teachers?! • Here is another great infographic that could be used at many levels. !
- 9. How could you use Infographics in your classroom?! • Discussion !
- 10. Where can I find out more? ! To&see&infographics& & Cool%Infographics%hEp://www.coolinfographics.com/& ( Visual.ly%Showcase%hEp://visual.ly/#gc_filter( ( My%Delicious%tags%( hEp://www.delicious.com/ictedservices/infographic( ( hEp://www.delicious.com/ictedservices/infographics( ( My%Pinterest%Board% % hEp://pinterest.com/ictedservices/infographics/( !
- 11. What makes a good Infographic ? ! •(It(tells(a(story( •(Data(offers(insight(and(connec6ons( Types(of(Infographics( ( •(Capturing(the(state(of(an(industry(or(a(trend( •(Provides(a(resource( •(Compares(A(to(B( •(Shows(the(evolu6on(of(a(concept( •(Make(the(complex,(simple( http://www.slideshare.net/ripetungi/why-are-infographics-important ! !
- 12. What is the process of making an Infographic ? ! •(Ask(ques6ons,(lots(of(them!( ( •(Con6nue(to(ask(them( ( •(Know(your(audience( ( •(Tell(a(story( ( •(Don’t(over(decorate!( ( •(Keep(it(simple( http://www.slideshare.net/ripetungi/why-are-infographics-important ! !
- 13. Why are Infographics important ?! •(They(present(a(compelling(narra6ve( ( •(They(can(be(easily(digested(and(shared( ( •(They(create(ac6on,([(unlike(spreadsheets(and( graphs]( http://www.slideshare.net/ripetungi/why-are-infographics-important ! !
- 14. How do I make Infographics? ! Design&yourself& & Any(graphics(program(will(do( ( Illustrator,(Inkscape,(Pages,(Publisher(etc.( & Or&Web&2.0& & hEp://librarianlifestyle.com/2012/04/13/howtocreateyourown infographics/( ( Visual.ly(( ( Piktochart(
- 15. Visual.ly ! To make infographics http://visual.ly/! ! ! !
- 16. Visual.ly ! It’s(very(easy(to(create(an(infographic(with(Visual.ly.((Once(you’re(on( their(website,(just(select(the(Create(op6on(on(their(top(naviga6on.(( A`er(you(create(an(account,(you(can(get(started(building(your( infographics.(( Currently,((Visual.ly(offers(five(different(data(visualiza6on(topics(for( your(Facebook(and(TwiEer(accounts.(Once(you(select(the(one(you( want,(you(can(connect(to(your(Facebook(or(TwiEer(account(and( presto…your(infographic(is(done(in(10(seconds.(You(can(even(share( your(infographic(on(Facebook,(TwiEer,(email,(or(on(your(website.( The(one(downside(to(Visual.ly(is(that(they(only(offer(a(handful(of( infographic(designs,(but(they(are(in(the(process(of(crea6ng(some(new( templates.(I’m(looking(very(forward(to(seeing(what(they(come(up(with,( and(I’m(hopeful(that(their(new(designs(will(let(us(play(with(our(social( media(data(in(some(interes6ng(ways.( ( ! librarianlifestyle.com/2012/04/13/how-to-create-your-own-infographics/!
- 17. Piktochart ! To make infographics http://piktochart.com/! !
- 18. Piktochart ! Picktochart(is(a(new(startup(whose(goal(is(to(make(a(tool(that(everyone( can(use(to(create(stories(out(of(their(data,(and(I(think(they’ve( accomplished(that(goal!((Picktochart(is(very(intui6ve(to(use,(and( their(tool(makes(it(really(easy(to(create(customized( infographics.(The(free(acount(lets(you(choose(from(three(different( designs,(and(for($9.99(per(month(you(can(upgrade(to(a(professional( account(with(more(template(op6ons.( You(can(customize(your(infographic(by(selec6ng(different(shapes,( colors,(graphics,(and(fonts.(The(tools(feature(lets(you(enter(data(or( import(your(data(in(a(.csv(file(that(will(automa6cally(populate(your( graph.(I(love(this(site,(because(you(can(quickly(create(an(interes6ng( infographic(without(learning(a(new(so`ware(program(like(Illustrator.( This(is(great(for(anyone(who(doesn’t(have(a(background(in(design((like( me!).( ! librarianlifestyle.com/2012/04/13/how-to-create-your-own-infographics/!
- 19. Here’s my first try at making one. ! ! !
- 20. Here’s my first try at making one. ! ! !
- 21. Here’s ! ! my first try at making one.!
- 22. Discussion! ! !