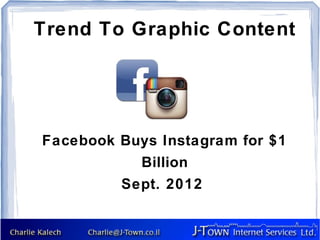
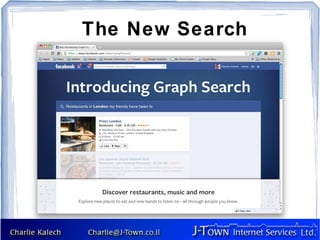
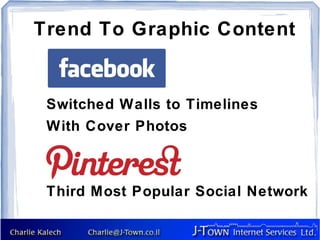
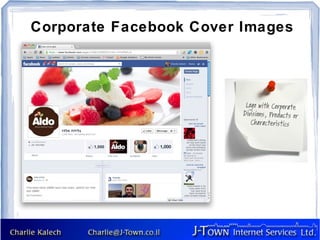
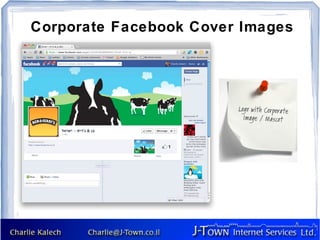
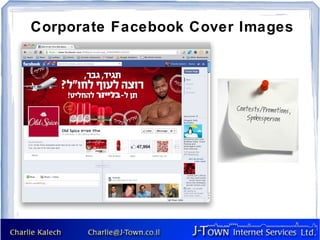
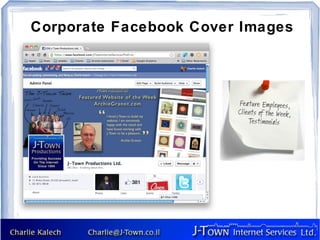
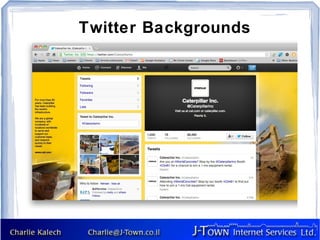
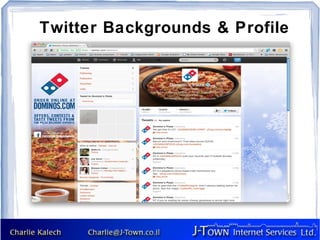
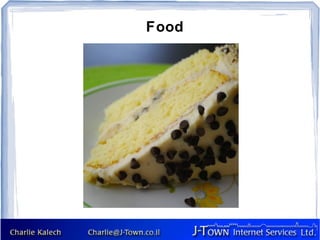
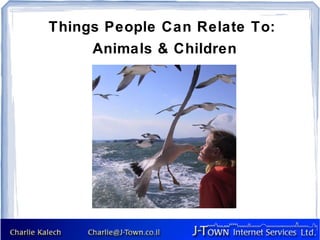
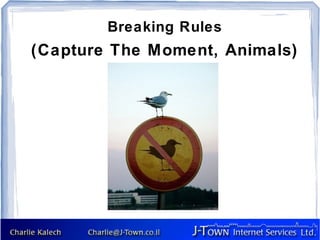
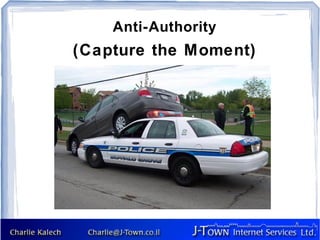
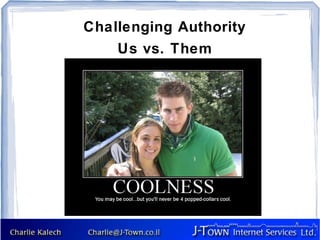
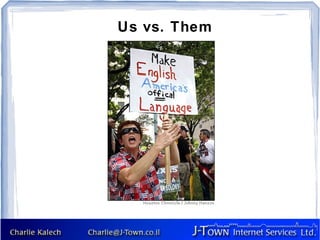
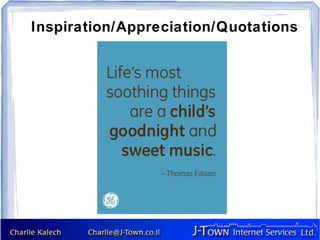
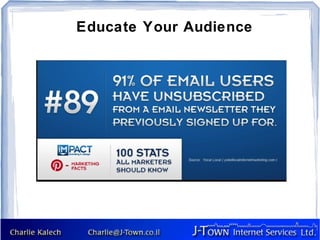
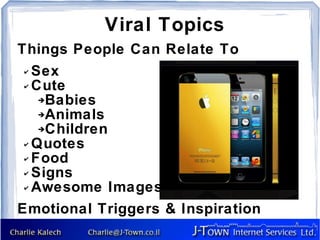
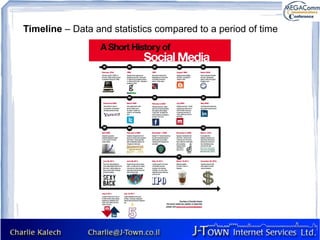
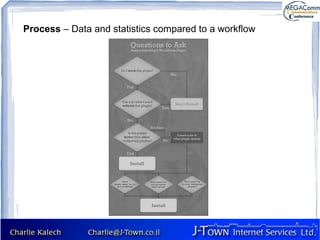
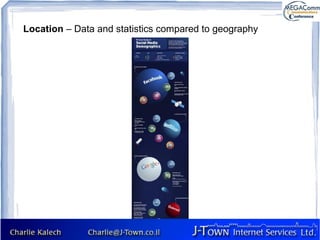
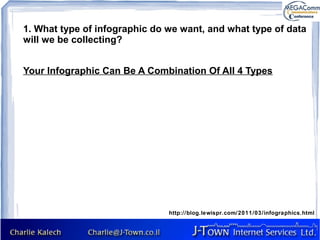
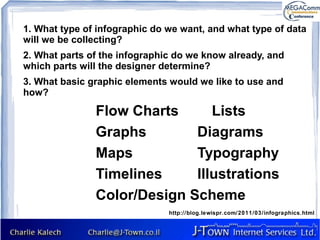
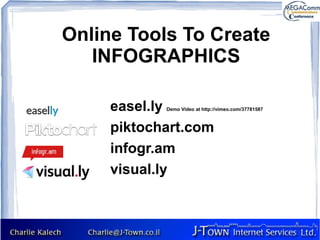
How To Create Great Sharable
       Graphics/Infographics


             Charlie Kalech
Director, J-Town Internet Services Ltd.
            @ CharlieKalech
Trend To Graphic Content

 One Click “Like” and “Share”
 Even Text is Becoming Graphics
 Easier To Convey Complex Ideas
Trend To Graphic Content


Facebook Buys Instagram for $1
           Billion
         Sept. 2012
Trend To Graphic Content


  300 million       40 million       per
day
  240 billion                    total
  1.1 billion       10 million
  New Year's 2013   Thanksgiving
2013
The New Search
Search Engines Do Not Index Text In
       Graphics/Infographics
               BUT
  Images Have Meta Data
  Geo-tagging People-tagging
  User information
  Business & Organizations
  Shares, Hashtags, Likes
The New Search
The New Search
The New Search
Trend To Graphic Content


 Switched Walls to Timelines
 With Cover Photos


 Third Most Popular Social Network
Corporate Facebook Cover Images
Twitter Backgrounds
Twitter Backgrounds & Profile
           Picture
  https://twitter.com/dominos
Food
Things People Can Relate To: Food
       Sharing Pleasure
Things People Can Relate To: Babies
       Strong Ideology + CTA
Things People Can Relate To: Animals
  (Capture The Moment + Text)
Things People Can Relate To:
     Animals & Children
Things People Can Relate To: Signs
The Unexpected (Funny)
Breaking Rules
(Capture The Moment, Animals)
Anti-Authority
(Capture the Moment)
Celebrities + The Unexpected (Rare)
        Challenging Authority


    Bill & Hillary in the 1970s
Challenging Authority
    Us vs. Them
Us vs. Them
Recycle Awesome Print Graphics
Customers
Inspiration/Appreciation
Inspiration/Appreciation/Quotations
Educate Your Audience
Think Big – Think Different – Get
            Creative
Challenge Your Audience
Viral Topics
Things People Can Relate To
 ✔ Sex

 ✔ Cute

    ➔Babies

    ➔Animals

    ➔Children

 ✔ Quotes

 ✔ Food

 ✔ Signs

 ✔ Awesome Images


Emotional Triggers & Inspiration
Viral Topics
          Funny/Unexpected
             Celebrities
 Challenge Authority (Us vs. Them)
  If You Agree Share/Act, Fill in the
                Blank
              Contests
             Customers
Informative/Educational/Confessions
On-Line Tools
www.recitethis.com
On-Line Tools
www.someecards.com
On-Line Tools
www.memecenter.com
http://blog.lewispr.com/2011/03/infographics.ht
                       ml
Three Steps To Creating An Infographic
1) Three Questions
2) Data Collection
3) Design


            http://blog.lewispr.com/2011/03/infographics.html
1. What type of infographic do we want, and what type of data
will we be collecting?

There are 4 Basic Types of Infographics:
      Statistical
         Comparative numerical data & statistics
      Timeline
         Data & statistics compared to a period of time
      Process
         Data & statistics compared to a workflow
      Location
         Data & statistics compared to geography
                              http://blog.lewispr.com/2011/03/infographics.html
Statistical – Numerical data and statistics compared to each other
Timeline – Data and statistics compared to a period of time
Process – Data and statistics compared to a workflow
Location – Data and statistics compared to geography
1. What type of infographic do we want, and what type of data
will we be collecting?


Your Infographic Can Be A Combination Of All 4 Types


                               http://blog.lewispr.com/2011/03/infographics.html
1. What type of infographic do we want, and what type of data
will we be collecting?


Your Infographic Can Be A Combination Of All 4 Types


2. What parts of the infographic do we know already, and
which parts will the designer determine?


                               http://blog.lewispr.com/2011/03/infographics.html
2. What parts of the infographic do we know already, and
which parts will the designer determine?

Visual
Color | Graphics | Icons


                               http://blog.lewispr.com/2011/03/infographics.html
Content
Time – Timelines | Calendars | Clocks
Statistics – Numbers | Charts | Graphs
References Location | Size | Quantity


                    http://blog.lewispr.com/2011/03/infographics.html
Knowledge
Facts – Conclusions from data that
support the message
Deductions – The main message


                    http://blog.lewispr.com/2011/03/infographics.html
1. What type of infographic do we want, and what type of data
will we be collecting?
2. What parts of the infographic do we know already, and
which parts will the designer determine?
3. What basic graphic elements would we like to use and
how?

               Flow Charts      Lists
               Graphs        Diagrams
               Maps          Typography
               Timelines     Illustrations
               Color/Design Scheme
                               http://blog.lewispr.com/2011/03/infographics.html
Online Tools To Create
   INFOGRAPHICS

     easel.ly
            Demo Video at http://vimeo.com/37781587


     piktochart.com
     infogr.am
     visual.ly
Know Your Platform
What Works on


Won't Work on


http://www.lunametrics.com/blog/2012/11/12/final-social-media-sizing-cheat-sheet/
Remember
Remember
Remember CTAs (Calls To Action)
Thank You
            Charlie Kalech
Director, J-Town Internet Services Ltd.
 www.j-town.co.il
 charlie@j-town.co.il
 @CharlieKalech

 For More Resources Fan Us on Facebook
 http://facebook.com/jtownproductions

               For More Events and Seminars
 Join Jerusalem Web Professionals (JWP) Facebook Group

Creating Sharable Graphics