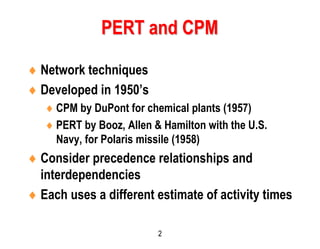
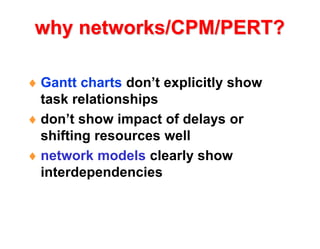
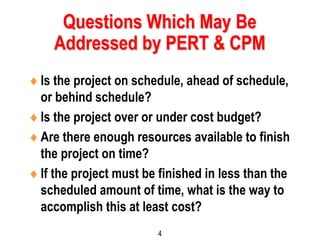
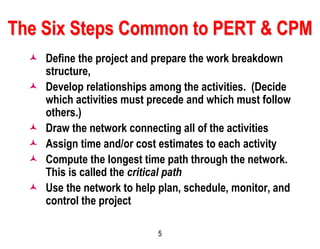
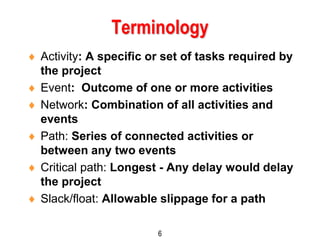
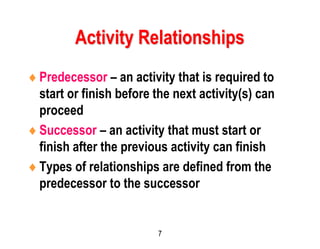
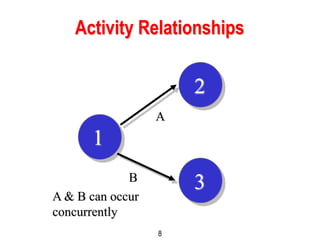
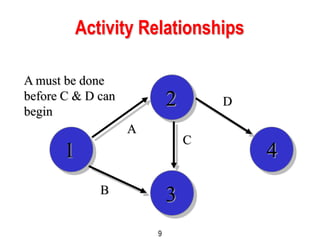
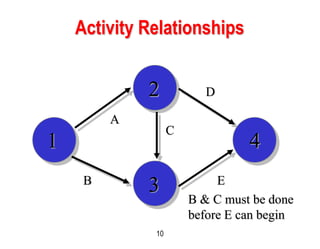
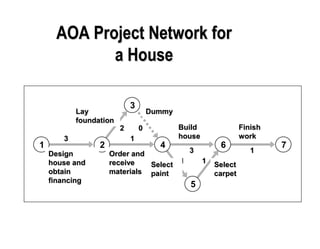
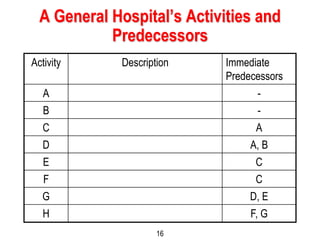
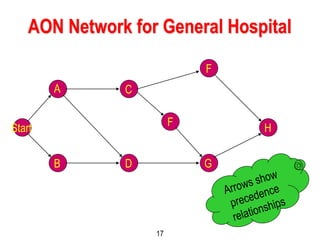
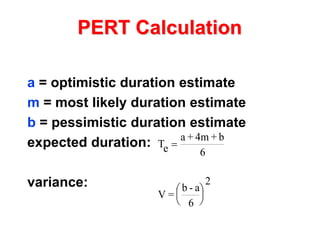
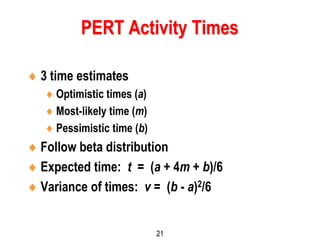
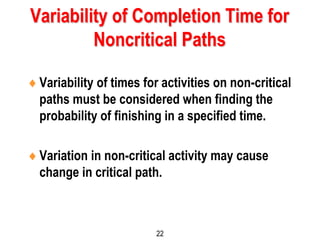
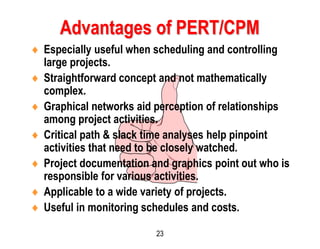
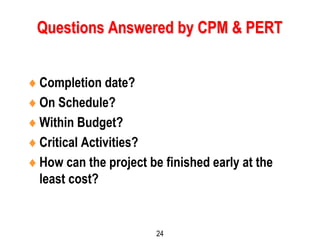
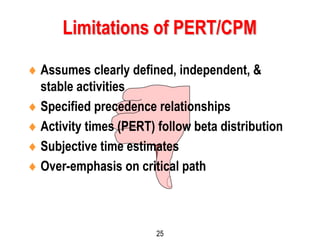
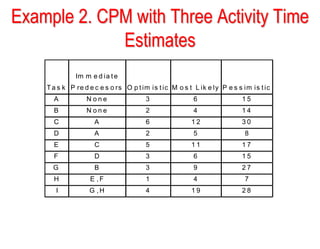
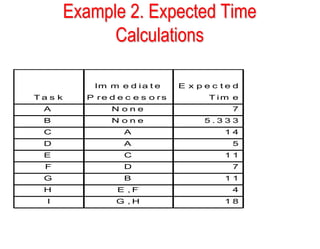
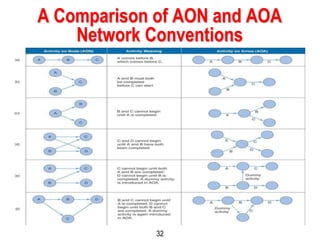
1
Project Scheduling
CPM/PERT
2
 Network techniques
 Developed in 1950’s
 CPM by DuPont for chemical plants (1957)
 PERT by Booz, Allen & Hamilton with the U.S.
Navy, for Polaris missile (1958)
 Consider precedence relationships and
interdependencies
 Each uses a different estimate of activity times
PERT and CPM
why networks/CPM/PERT?
 Gantt charts don’t explicitly show
task relationships
 don’t show impact of delays or
shifting resources well
 network models clearly show
interdependencies
4
Is the project on schedule, ahead of schedule,
or behind schedule?
Is the project over or under cost budget?
Are there enough resources available to finish
the project on time?
If the project must be finished in less than the
scheduled amount of time, what is the way to
accomplish this at least cost?
Questions Which May Be
Addressed by PERT & CPM
5
The Six Steps Common to PERT & CPM
 Define the project and prepare the work breakdown
structure,
 Develop relationships among the activities. (Decide
which activities must precede and which must follow
others.)
 Draw the network connecting all of the activities
 Assign time and/or cost estimates to each activity
 Compute the longest time path through the network.
This is called the critical path
 Use the network to help plan, schedule, monitor, and
control the project
6
Terminology
 Activity: A specific or set of tasks required by
the project
 Event: Outcome of one or more activities
 Network: Combination of all activities and
events
 Path: Series of connected activities or
between any two events
 Critical path: Longest - Any delay would delay
the project
 Slack/float: Allowable slippage for a path
7
Activity Relationships
Predecessor – an activity that is required to
start or finish before the next activity(s) can
proceed
Successor – an activity that must start or
finish after the previous activity can finish
Types of relationships are defined from the
predecessor to the successor
8
1
A
B
A & B can occur
concurrently
2
3
Activity Relationships
9
1 4
2
3
A
B
C
A must be done
before C & D can
begin
D
Activity Relationships
10
1 4
2
3
A
B E
C
B & C must be done
before E can begin
D
Activity Relationships
AOA Project Network for
a House
3
2 0
1
3
1 1
1
1 2 4 6 7
3
5
Lay
foundation
Design
house and
obtain
financing
Order and
receive
materials
Dummy
Finish
work
Select
carpet
Select
paint
Build
house
12
 Activities are defined often by beginning &
ending events
 Every activity must have unique pair of
beginning & ending events
 Otherwise, computer programs get confused
 Dummy activities maintain precedence
 Consume no time or resources
Dummy Activities
13
Job on Arc Network
 Not allowed: no two
jobs can have the
same starting and
ending node!
 Need to introduce a
dummy job.
A
B
D
C
A
B
D
C
14
1 4
3
1-2
2-3
Incorrect
1 4
2
3
5
2
2-3
3-4
1-2
2-3
2-4 4-5
3-4: Dummy
activity
Correct
Dummy Activity Example
15
Critical Path
The longest continuous path of activities
through a project, which determines the
project end date
16
A General Hospital’s Activities and
Predecessors
Activity Description Immediate
Predecessors
A -
B -
C A
D A, B
E C
F C
G D, E
H F, G
17
AON Network for General Hospital
Start
A
B
C
D
F
F
G
H
Program Evaluation and
Review Technique (PERT)
PERT is based on the assumption that an
activity’s duration follows a probability
distribution instead of being a single value.
The probabilistic information about the
activities is translated into probabilistic
information about the project.
PERT
 reflects PROBABILISTIC nature of durations
 assumes BETA distribution
 same as CPM except THREE duration
estimates
optimistic
most likely
pessimistic
PERT Calculation
a = optimistic duration estimate
m = most likely duration estimate
b = pessimistic duration estimate
expected duration:
variance:
Te
a + 4m + b
6
V =
b - a
6







2
21
 3 time estimates
 Optimistic times (a)
 Most-likely time (m)
 Pessimistic time (b)
 Follow beta distribution
 Expected time: t = (a + 4m + b)/6
 Variance of times: v = (b - a)2/6
PERT Activity Times
22
Variability of Completion Time for
Noncritical Paths
Variability of times for activities on non-critical
paths must be considered when finding the
probability of finishing in a specified time.
Variation in non-critical activity may cause
change in critical path.
23
Advantages of PERT/CPM
 Especially useful when scheduling and controlling
large projects.
 Straightforward concept and not mathematically
complex.
 Graphical networks aid perception of relationships
among project activities.
 Critical path & slack time analyses help pinpoint
activities that need to be closely watched.
 Project documentation and graphics point out who is
responsible for various activities.
 Applicable to a wide variety of projects.
 Useful in monitoring schedules and costs.
24
Questions Answered by CPM & PERT
Completion date?
On Schedule?
Within Budget?
Critical Activities?
How can the project be finished early at the
least cost?
25
 Assumes clearly defined, independent, &
stable activities
 Specified precedence relationships
 Activity times (PERT) follow beta distribution
 Subjective time estimates
 Over-emphasis on critical path
Limitations of PERT/CPM
Example 2. CPM with Three Activity Time
Estimates
Ta s k
Im m e d ia t e
P re d e c e s o rs O p t im is t ic M o s t L ik e ly P e s s im is t ic
A N o n e 3 6 1 5
B N o n e 2 4 1 4
C A 6 1 2 3 0
D A 2 5 8
E C 5 1 1 1 7
F D 3 6 1 5
G B 3 9 2 7
H E , F 1 4 7
I G , H 4 1 9 2 8
Example 2. Expected Time
Calculations
T a s k
Im m e d i a t e
P re d e c e s o rs
E x p e c t e d
T i m e
A N o n e 7
B N o n e 5 . 3 3 3
C A 1 4
D A 5
E C 1 1
F D 7
G B 1 1
H E , F 4
I G , H 1 8
Example 2. Probability Exercise
What is the probability of finishing this project in
less than 53 days?
p(t < D)
TE = 54
Z =
D - TE
cp
2


t
D=53
Activity variance, = (
Pessim. - Optim.
6
)
2 2

Ta s k O p tim is tic M o s t L ik e ly P e s s im is tic V a ria n c e
A 3 6 1 5 4
B 2 4 1 4
C 6 1 2 3 0 1 6
D 2 5 8
E 5 1 1 1 7 4
F 3 6 1 5
G 3 9 2 7
H 1 4 7 1
I 4 1 9 2 8 1 6
(Sum the variance along the critical path.) 2
 = 41
p(Z < -0.156) = 0.5 - 0.0636 = 0.436, or 43.6 %
Z =
D - T
=
53- 54
41
= -.156
E
cp
2


TE = 54
p(t < D)
t
D=53
32
A Comparison of AON and AOA
Network Conventions

CPM-PERT.ppt

  • 1.
  • 2.
    2  Network techniques Developed in 1950’s  CPM by DuPont for chemical plants (1957)  PERT by Booz, Allen & Hamilton with the U.S. Navy, for Polaris missile (1958)  Consider precedence relationships and interdependencies  Each uses a different estimate of activity times PERT and CPM
  • 3.
    why networks/CPM/PERT?  Ganttcharts don’t explicitly show task relationships  don’t show impact of delays or shifting resources well  network models clearly show interdependencies
  • 4.
    4 Is the projecton schedule, ahead of schedule, or behind schedule? Is the project over or under cost budget? Are there enough resources available to finish the project on time? If the project must be finished in less than the scheduled amount of time, what is the way to accomplish this at least cost? Questions Which May Be Addressed by PERT & CPM
  • 5.
    5 The Six StepsCommon to PERT & CPM  Define the project and prepare the work breakdown structure,  Develop relationships among the activities. (Decide which activities must precede and which must follow others.)  Draw the network connecting all of the activities  Assign time and/or cost estimates to each activity  Compute the longest time path through the network. This is called the critical path  Use the network to help plan, schedule, monitor, and control the project
  • 6.
    6 Terminology  Activity: Aspecific or set of tasks required by the project  Event: Outcome of one or more activities  Network: Combination of all activities and events  Path: Series of connected activities or between any two events  Critical path: Longest - Any delay would delay the project  Slack/float: Allowable slippage for a path
  • 7.
    7 Activity Relationships Predecessor –an activity that is required to start or finish before the next activity(s) can proceed Successor – an activity that must start or finish after the previous activity can finish Types of relationships are defined from the predecessor to the successor
  • 8.
    8 1 A B A & Bcan occur concurrently 2 3 Activity Relationships
  • 9.
    9 1 4 2 3 A B C A mustbe done before C & D can begin D Activity Relationships
  • 10.
    10 1 4 2 3 A B E C B& C must be done before E can begin D Activity Relationships
  • 11.
    AOA Project Networkfor a House 3 2 0 1 3 1 1 1 1 2 4 6 7 3 5 Lay foundation Design house and obtain financing Order and receive materials Dummy Finish work Select carpet Select paint Build house
  • 12.
    12  Activities aredefined often by beginning & ending events  Every activity must have unique pair of beginning & ending events  Otherwise, computer programs get confused  Dummy activities maintain precedence  Consume no time or resources Dummy Activities
  • 13.
    13 Job on ArcNetwork  Not allowed: no two jobs can have the same starting and ending node!  Need to introduce a dummy job. A B D C A B D C
  • 14.
    14 1 4 3 1-2 2-3 Incorrect 1 4 2 3 5 2 2-3 3-4 1-2 2-3 2-44-5 3-4: Dummy activity Correct Dummy Activity Example
  • 15.
    15 Critical Path The longestcontinuous path of activities through a project, which determines the project end date
  • 16.
    16 A General Hospital’sActivities and Predecessors Activity Description Immediate Predecessors A - B - C A D A, B E C F C G D, E H F, G
  • 17.
    17 AON Network forGeneral Hospital Start A B C D F F G H
  • 18.
    Program Evaluation and ReviewTechnique (PERT) PERT is based on the assumption that an activity’s duration follows a probability distribution instead of being a single value. The probabilistic information about the activities is translated into probabilistic information about the project.
  • 19.
    PERT  reflects PROBABILISTICnature of durations  assumes BETA distribution  same as CPM except THREE duration estimates optimistic most likely pessimistic
  • 20.
    PERT Calculation a =optimistic duration estimate m = most likely duration estimate b = pessimistic duration estimate expected duration: variance: Te a + 4m + b 6 V = b - a 6        2
  • 21.
    21  3 timeestimates  Optimistic times (a)  Most-likely time (m)  Pessimistic time (b)  Follow beta distribution  Expected time: t = (a + 4m + b)/6  Variance of times: v = (b - a)2/6 PERT Activity Times
  • 22.
    22 Variability of CompletionTime for Noncritical Paths Variability of times for activities on non-critical paths must be considered when finding the probability of finishing in a specified time. Variation in non-critical activity may cause change in critical path.
  • 23.
    23 Advantages of PERT/CPM Especially useful when scheduling and controlling large projects.  Straightforward concept and not mathematically complex.  Graphical networks aid perception of relationships among project activities.  Critical path & slack time analyses help pinpoint activities that need to be closely watched.  Project documentation and graphics point out who is responsible for various activities.  Applicable to a wide variety of projects.  Useful in monitoring schedules and costs.
  • 24.
    24 Questions Answered byCPM & PERT Completion date? On Schedule? Within Budget? Critical Activities? How can the project be finished early at the least cost?
  • 25.
    25  Assumes clearlydefined, independent, & stable activities  Specified precedence relationships  Activity times (PERT) follow beta distribution  Subjective time estimates  Over-emphasis on critical path Limitations of PERT/CPM
  • 26.
    Example 2. CPMwith Three Activity Time Estimates Ta s k Im m e d ia t e P re d e c e s o rs O p t im is t ic M o s t L ik e ly P e s s im is t ic A N o n e 3 6 1 5 B N o n e 2 4 1 4 C A 6 1 2 3 0 D A 2 5 8 E C 5 1 1 1 7 F D 3 6 1 5 G B 3 9 2 7 H E , F 1 4 7 I G , H 4 1 9 2 8
  • 27.
    Example 2. ExpectedTime Calculations T a s k Im m e d i a t e P re d e c e s o rs E x p e c t e d T i m e A N o n e 7 B N o n e 5 . 3 3 3 C A 1 4 D A 5 E C 1 1 F D 7 G B 1 1 H E , F 4 I G , H 1 8
  • 28.
    Example 2. ProbabilityExercise What is the probability of finishing this project in less than 53 days? p(t < D) TE = 54 Z = D - TE cp 2   t D=53
  • 29.
    Activity variance, =( Pessim. - Optim. 6 ) 2 2  Ta s k O p tim is tic M o s t L ik e ly P e s s im is tic V a ria n c e A 3 6 1 5 4 B 2 4 1 4 C 6 1 2 3 0 1 6 D 2 5 8 E 5 1 1 1 7 4 F 3 6 1 5 G 3 9 2 7 H 1 4 7 1 I 4 1 9 2 8 1 6 (Sum the variance along the critical path.) 2  = 41
  • 30.
    p(Z < -0.156)= 0.5 - 0.0636 = 0.436, or 43.6 % Z = D - T = 53- 54 41 = -.156 E cp 2   TE = 54 p(t < D) t D=53
  • 31.
    32 A Comparison ofAON and AOA Network Conventions