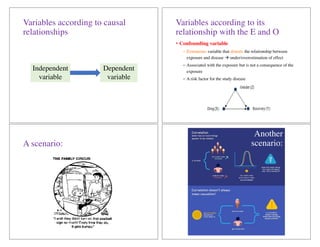
Variables
27 October 2018
The PICO(TS) Model for
Research Questions
P Patient, Population, or
Problem
Hospital-acquired infection
I Intervention, Prognostic
factor, or Exposure
Handwashing
C Comparison, or Intervention
(if appropriate)
No handwashing; other
solution; mask
O Outcome you would like to
measure or achieve
Reduced infection
T Type of question you’re
asking
(Diagnosis, Etiology/Harm,
Therapy, Prognosis,
Prevention)
S Study type (Study design)
Variable
• Its value varies from one individual to another or
within the same individual at different periods of
time.
• Types:
– Qualitative
– Quantitative
• Discrete
• Continuous
• Levels
– Nominal
– Ordinal
– Interval
– Ratio
(chat noir)
Variables according to how they
are expressed/measured
• Qualitative variables
– Variables whose categories are simply used as labels to
distinguish one group from another
– Numerical representation of the categories are for
labeling/coding and not for comparison (greater or less)
– E.g., sex, religion, place of residence, disease status
Variables according to how they
are expressed/measured
• Quantitative variables
– Values indicate a quantity or amount and can be
expressed numerically
– Values can be arranged according to magnitude
– E.g., age, height, weight, blood pressure
– May be either discrete or continuous
Types of quantitative variables
• Discrete
– Can assume only integral values or whole numbers (finite
number of values)
– E.g., number of children in the family, number of beds in the
hospital
– Counts, ratios
• Continuous
– Can attain any value including fractions or decimals (possible
values fall on a continuum)
– E.g., height, weight
– Includes proportions, rates
Variables according to levels of
measurement
• Nominal
– A classificatory scale where the categories are used as
labels only (does not represent quantity)
– Number or names which represent a set of mutually
exclusive and exhaustive categories to which individuals
or objects (attributes) may be assigned
– Most discrete variables are nominal
– E.g., sex (M, F), race, blood groups, seatbelts in car,
psychiatric diagnosis, patient ID no.
Variables according to levels of
measurement
• Ordinal
– Same characteristics as the nominal scale
– Additional feature: categories can be ordered or ranked;
however, the distance between the two categories cannot
be clearly quantified
– E.g., Likert scales, age groups (infant, child, teenager,
adult), psychosocial scales (strongly disagree, disagree,
agree, strongly agree)
Variables according to levels of
measurement
• Interval
– Same characteristics as the ordinal scales
– Additional feature: distances between all adjacent
classes are equal
– Conceptually, these scales are infinite, in that they have
neither beginning nor ending
– Zero point is arbitrary and does not mean absence of the
characteristic
– E.g., temperature, IQ
– Can be quantitative continuous
Variables according to levels of
measurement
• Ratio
– Same characteristics as for ordinal scales
– A meaningful zero point exists
– Ratio of two numbers can be meaningfully computed and
interpreted
– E.g., weight, blood pressure, height, doctor visits,
number of DMF teeth
– Can be quantitative continuous
Levels of Measurement
Information
increases;
progressively
more precise
mathematically
Variables according to causal
relationships
• Independent variable
– Variable under investigation, hypothesized to have an
effect on the outcome
– Presumed cause (exposure) in an experimental study;
under the experimenter’s control
• Dependent variable
– Outcome of interest in the investigation
– Presumed effect in an experimental study; value
dependent upon the independent variable
Variables according to causal
relationships
Independent
variable
Dependent
variable
Variables according to its
relationship with the E and O
• Confounding variable
– Extraneous variable that distorts the relationship between
exposure and disease à under/overestimation of effect
– Associated with the exposure but is not a consequence of the
exposure
– A risk factor for the study disease
A scenario:
Another
scenario:
Yet another scenario:
Amount of
salary
Work
productivity
What if they are already hard workers to begin with?
They really like what they do? Don’t want to leave the
office first? Passionate? Motivated? Competitive?
High pay is incidental. How do we know what the
cause of their increased productivity is?
Yet another scenario:
Amount of
salary
Work
productivity
Personality
Motivation
Competition
Variables according to its
relationship with the E and O
• Intermediate variable
– Variable along the causal pathway between exposure and
outcome
– Causes variation in the dependent variable
– Is itself caused to vary by the independent variable
Confounding vs Effect
modification
• Confounding – distortion of the association
between an exposure and an outcome that occurs
when the study groups differ with respect to other
factors that influence the outcome
• Effect measure modification – occurs when the
magnitude of the effect of the primary exposure on
an outcome (i.e., the association) differs depending
on the level of a third variable
Confounding
Died Survived TOTAL
Hospital A 73 2037 2110
Hospital B 16 784 800
TOTAL 89 2821 2910
RR = 1.73 (95% CI: 1.01, 2.95)
Died Survived TOTAL
Hospital A 65 1443 1508
Hospital B 8 192 800
TOTAL 73 1635 1708
RR = 1.08 (95% CI: 0.52, 2.21)
Died Survived TOTAL
Hospital A 8 594 602
Hospital B 8 592 600
TOTAL 16 1186 1202
RR = 1.00 (95% CI: 0.38, 2.64)
Patients severely ill Patients not severely ill
Accounting for the confounding
variable:
“severity of illness”
Confounding
Crude OR Adjusted OR Comments
2.5
(95% CI: 1.5, 4.2)
1.0 Confounders distort the E–D
relationship to the extent that they
completely explain the crude OR
2.5
(95% CI: 1.5, 4.2)
2.0
(95% CI: 1.1, 3.4)
Confounders modestly distort E–D
relationship; adjusted OR still
statistically significant
2.5
(95% CI: 1.5, 4.2)
3.5
(95% CI: 2.2, 5.4)
Confounder distorts the relationship
but in the opposite direction (could
be a protective factor rather than a
risk factor*)
0.40
(95% CI: 0.15, 0.75)
0.65
(95% CI: 0.40, 1.2)
Confounders modestly distort E–D
relationship; adjusted OR still not
statistically significant
Effect measure modification
(New drug and HDL increase)
Source: Boston University School of Public Health
1
A statistically significant HDL-C increase with the new drug
was expected.
Is there another variable masking the effect of the treatment?
Effect measure modification
(New drug and HDL increase)
Source: Boston University School of Public Health
Effect measure modification
(Hospitalization for MVA)
(95% CI: 1.32, 1.56)
(95% CI: 1.62, 2.00)
(95% CI: 0.80, 1.06)
Source: Boston University School of Public Health
Confounding vs Effect
modification
• Confounding is a distortion of the true association
caused by an imbalance of some other risk factor.
• Effect modification is a biological phenomenon that
should be described.
– Pooled data can be misleading.
– Stratum-specific measures of association estimates
should be reported separately.
– Allows for interaction.
Dependent
variable
Independent
variable
?
Confounding
variable/s
?
Intermediate
variable/s
Effect modifiers?
Conceptual vs Operational
Definitions
• Conceptual definition of a variable
– Nominal definition; dictionary definition
– Uses literal terms to specify the qualities of a variable
– Tells you what the concept of that variable means
• Operational definition of a variable
– Specifies the procedures and criteria for taking a
measurement of that variable
– Tells you how to measure that variable
Conceptual vs Operational
Definitions
Conceptual vs Operational
Definitions
Variable Conceptual Definition Operational Definition
Weight The heaviness of an object Heaviness measured in
kilograms
Age Amount of time during
which a person has lived
Length of time from birth
measured in months or age
in years at last birthday
Hemoglobin level Level of the red protein
responsible for
transporting oxygen in the
blood of vertebrates
Hemoglobin concentration
in capillary blood, measure
in mg/dl using a
hemoglobinometer
BMI A measure for human body
shape based on an
individual’s mass and
height
The weight in kilograms
divided by the square of
the height in meters
(kg/m2)
References
• Biostatistics 201 Lecture Notes (2013), Department of Epidemiology and Biostatistics, College of Public
Health, University of the Philippines Manila.
• Boston University School of Public Health. Confounding and Effect Measure Modification. Accessed
at http://sphweb.bumc.bu.edu/otlt/MPH-Modules/BS/BS704-EP713_Confounding-EM/BS704-
EP713_Confounding-EM8.html (21 Oct 2018)
• Daniel WW (2009). Biostatistics: A Foundation for Analysis in the Health Sciences, 9th
edition. Wiley
& Sons, Inc., USA.
• Evans JD (1996). Straightforward Statistics for the Behavioral Sciences. Brooks/Cole Publishing,
Pacific Grove, CA, USA.
• Katz DL, Elmore JG, Wild DMG (2014). Jekel’s Epidemiology, Biostatistics, Preventive Medicine, and
Public Health, 4th edition. Elsevier Saunders, Philadelphia, PA, USA.
• Mendoza OM, Borja MP (2010). Foundations of Statistical Analysis for the Health Sciences,
Department of Epidemiology and Biostatistics, College of Public Health, University of the Philippines
Manila.
• Momeni A, Pincus M, Libien J (2018). Introduction to Statistical Methods in Pathology. Springer
International Publishing.
• Riffenburgh RH (2012). Statistics in Medicine, 3rd
edition. Elsevier, Inc., USA.

Statistical methods Topic on Variables .pdf

  • 1.
    Variables 27 October 2018 ThePICO(TS) Model for Research Questions P Patient, Population, or Problem Hospital-acquired infection I Intervention, Prognostic factor, or Exposure Handwashing C Comparison, or Intervention (if appropriate) No handwashing; other solution; mask O Outcome you would like to measure or achieve Reduced infection T Type of question you’re asking (Diagnosis, Etiology/Harm, Therapy, Prognosis, Prevention) S Study type (Study design) Variable • Its value varies from one individual to another or within the same individual at different periods of time. • Types: – Qualitative – Quantitative • Discrete • Continuous • Levels – Nominal – Ordinal – Interval – Ratio (chat noir) Variables according to how they are expressed/measured • Qualitative variables – Variables whose categories are simply used as labels to distinguish one group from another – Numerical representation of the categories are for labeling/coding and not for comparison (greater or less) – E.g., sex, religion, place of residence, disease status
  • 2.
    Variables according tohow they are expressed/measured • Quantitative variables – Values indicate a quantity or amount and can be expressed numerically – Values can be arranged according to magnitude – E.g., age, height, weight, blood pressure – May be either discrete or continuous Types of quantitative variables • Discrete – Can assume only integral values or whole numbers (finite number of values) – E.g., number of children in the family, number of beds in the hospital – Counts, ratios • Continuous – Can attain any value including fractions or decimals (possible values fall on a continuum) – E.g., height, weight – Includes proportions, rates Variables according to levels of measurement • Nominal – A classificatory scale where the categories are used as labels only (does not represent quantity) – Number or names which represent a set of mutually exclusive and exhaustive categories to which individuals or objects (attributes) may be assigned – Most discrete variables are nominal – E.g., sex (M, F), race, blood groups, seatbelts in car, psychiatric diagnosis, patient ID no. Variables according to levels of measurement • Ordinal – Same characteristics as the nominal scale – Additional feature: categories can be ordered or ranked; however, the distance between the two categories cannot be clearly quantified – E.g., Likert scales, age groups (infant, child, teenager, adult), psychosocial scales (strongly disagree, disagree, agree, strongly agree)
  • 3.
    Variables according tolevels of measurement • Interval – Same characteristics as the ordinal scales – Additional feature: distances between all adjacent classes are equal – Conceptually, these scales are infinite, in that they have neither beginning nor ending – Zero point is arbitrary and does not mean absence of the characteristic – E.g., temperature, IQ – Can be quantitative continuous Variables according to levels of measurement • Ratio – Same characteristics as for ordinal scales – A meaningful zero point exists – Ratio of two numbers can be meaningfully computed and interpreted – E.g., weight, blood pressure, height, doctor visits, number of DMF teeth – Can be quantitative continuous Levels of Measurement Information increases; progressively more precise mathematically Variables according to causal relationships • Independent variable – Variable under investigation, hypothesized to have an effect on the outcome – Presumed cause (exposure) in an experimental study; under the experimenter’s control • Dependent variable – Outcome of interest in the investigation – Presumed effect in an experimental study; value dependent upon the independent variable
  • 4.
    Variables according tocausal relationships Independent variable Dependent variable Variables according to its relationship with the E and O • Confounding variable – Extraneous variable that distorts the relationship between exposure and disease à under/overestimation of effect – Associated with the exposure but is not a consequence of the exposure – A risk factor for the study disease A scenario: Another scenario:
  • 5.
    Yet another scenario: Amountof salary Work productivity What if they are already hard workers to begin with? They really like what they do? Don’t want to leave the office first? Passionate? Motivated? Competitive? High pay is incidental. How do we know what the cause of their increased productivity is? Yet another scenario: Amount of salary Work productivity Personality Motivation Competition Variables according to its relationship with the E and O • Intermediate variable – Variable along the causal pathway between exposure and outcome – Causes variation in the dependent variable – Is itself caused to vary by the independent variable Confounding vs Effect modification • Confounding – distortion of the association between an exposure and an outcome that occurs when the study groups differ with respect to other factors that influence the outcome • Effect measure modification – occurs when the magnitude of the effect of the primary exposure on an outcome (i.e., the association) differs depending on the level of a third variable
  • 6.
    Confounding Died Survived TOTAL HospitalA 73 2037 2110 Hospital B 16 784 800 TOTAL 89 2821 2910 RR = 1.73 (95% CI: 1.01, 2.95) Died Survived TOTAL Hospital A 65 1443 1508 Hospital B 8 192 800 TOTAL 73 1635 1708 RR = 1.08 (95% CI: 0.52, 2.21) Died Survived TOTAL Hospital A 8 594 602 Hospital B 8 592 600 TOTAL 16 1186 1202 RR = 1.00 (95% CI: 0.38, 2.64) Patients severely ill Patients not severely ill Accounting for the confounding variable: “severity of illness” Confounding Crude OR Adjusted OR Comments 2.5 (95% CI: 1.5, 4.2) 1.0 Confounders distort the E–D relationship to the extent that they completely explain the crude OR 2.5 (95% CI: 1.5, 4.2) 2.0 (95% CI: 1.1, 3.4) Confounders modestly distort E–D relationship; adjusted OR still statistically significant 2.5 (95% CI: 1.5, 4.2) 3.5 (95% CI: 2.2, 5.4) Confounder distorts the relationship but in the opposite direction (could be a protective factor rather than a risk factor*) 0.40 (95% CI: 0.15, 0.75) 0.65 (95% CI: 0.40, 1.2) Confounders modestly distort E–D relationship; adjusted OR still not statistically significant Effect measure modification (New drug and HDL increase) Source: Boston University School of Public Health 1 A statistically significant HDL-C increase with the new drug was expected. Is there another variable masking the effect of the treatment? Effect measure modification (New drug and HDL increase) Source: Boston University School of Public Health
  • 7.
    Effect measure modification (Hospitalizationfor MVA) (95% CI: 1.32, 1.56) (95% CI: 1.62, 2.00) (95% CI: 0.80, 1.06) Source: Boston University School of Public Health Confounding vs Effect modification • Confounding is a distortion of the true association caused by an imbalance of some other risk factor. • Effect modification is a biological phenomenon that should be described. – Pooled data can be misleading. – Stratum-specific measures of association estimates should be reported separately. – Allows for interaction. Dependent variable Independent variable ? Confounding variable/s ? Intermediate variable/s Effect modifiers? Conceptual vs Operational Definitions • Conceptual definition of a variable – Nominal definition; dictionary definition – Uses literal terms to specify the qualities of a variable – Tells you what the concept of that variable means • Operational definition of a variable – Specifies the procedures and criteria for taking a measurement of that variable – Tells you how to measure that variable
  • 8.
    Conceptual vs Operational Definitions Conceptualvs Operational Definitions Variable Conceptual Definition Operational Definition Weight The heaviness of an object Heaviness measured in kilograms Age Amount of time during which a person has lived Length of time from birth measured in months or age in years at last birthday Hemoglobin level Level of the red protein responsible for transporting oxygen in the blood of vertebrates Hemoglobin concentration in capillary blood, measure in mg/dl using a hemoglobinometer BMI A measure for human body shape based on an individual’s mass and height The weight in kilograms divided by the square of the height in meters (kg/m2) References • Biostatistics 201 Lecture Notes (2013), Department of Epidemiology and Biostatistics, College of Public Health, University of the Philippines Manila. • Boston University School of Public Health. Confounding and Effect Measure Modification. Accessed at http://sphweb.bumc.bu.edu/otlt/MPH-Modules/BS/BS704-EP713_Confounding-EM/BS704- EP713_Confounding-EM8.html (21 Oct 2018) • Daniel WW (2009). Biostatistics: A Foundation for Analysis in the Health Sciences, 9th edition. Wiley & Sons, Inc., USA. • Evans JD (1996). Straightforward Statistics for the Behavioral Sciences. Brooks/Cole Publishing, Pacific Grove, CA, USA. • Katz DL, Elmore JG, Wild DMG (2014). Jekel’s Epidemiology, Biostatistics, Preventive Medicine, and Public Health, 4th edition. Elsevier Saunders, Philadelphia, PA, USA. • Mendoza OM, Borja MP (2010). Foundations of Statistical Analysis for the Health Sciences, Department of Epidemiology and Biostatistics, College of Public Health, University of the Philippines Manila. • Momeni A, Pincus M, Libien J (2018). Introduction to Statistical Methods in Pathology. Springer International Publishing. • Riffenburgh RH (2012). Statistics in Medicine, 3rd edition. Elsevier, Inc., USA.