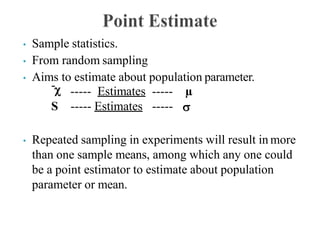
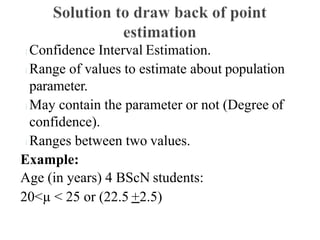
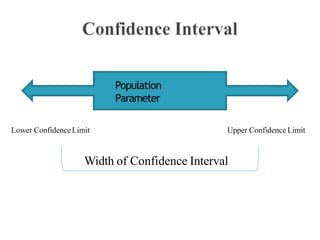
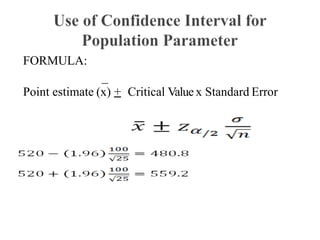
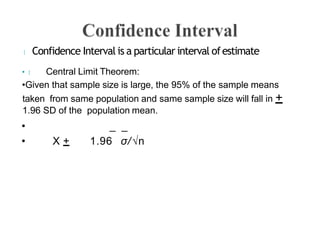
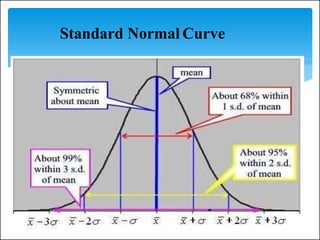
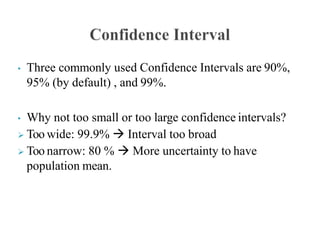
Shakir Rahman
BScN, MScN, MSc Applied Psychology, PhD Nursing (Candidate)
Principal & Assistant Professor
Ayub International College of Nursing & AHS Peshawar
Visiting Faculty
Swabi College of Nursing & Health Sciences Swabi
Nowshera College of Nursing & Health Sciences Nowshera
By the end of the session, students will be able to:
Apply the basics of inferential statistics in terms
of point estimation.
Compute point and estimation of population
means and confidence interval.
Interpret the results of point and interval
estimation.
Descriptive Inferential
Statistics
Estimation Hypothesis
testing
Point
Estimate
Interval
Estimate
3
A large group of your employees went to restaurant and
ordered a dessert. None of you liked it. May be, 45% of them
will prefer not eating it and leaving the restaurant and 15% of
them will complaint about it to the waiter to get a fresh new
dessert. With margin of error of 3% points. Youinterviewed
400 of employees.
How do mentioned estimations or predictionsare
related to true population parameter?
What is margin of error?
Is the sample of 400 sufficient to claim anything about
population of all employees ordering that dessert?
Estimating the value of parameter from thesample.
An aspect of inferential statistics.
Why to estimate: Population is large enough so we
can only estimate.
Types of estimation:
Point Estimation: A specified number value (single
value) that is an estimate of a population parameter.The
point estimate of the population mean µ is the sample
mean.
Interval Estimate: Range of values to
estimate about population parameter.
Example:
What is an estimate of score of nursing students in entry
test of Nursing school? (Out of 100 marks)
a. 90
b. 80
c. 80-95
d. 75-85
Point Estimate
Interval Estimate
The mean height of Pakistani girls at age 20 years is:
a. 5.2 fts
b. 5-5.5 fts
c. 5 fts
d. 5.1-5.6 fts
Which of the following is an example of point estimate
and which is an example of interval estimate.
• Sample statistics.
• From random sampling
• Aims to estimate about population parameter.
-
Ѕ ----- Estimates -----
----- Estimates ----- µ

• Repeated sampling in experiments will result in more
than one sample means, among which any one could
be a point estimator to estimate about population
parameter or mean.
How good is the point estimate?
Confidence Interval Estimation.
Range of values to estimate about population
parameter.
May contain the parameter or not (Degree of
confidence).
Ranges between two values.
Example:
Age (in years) 4 BScN students:
20<µ < 25 or (22.5 +2.5)
Population
Parameter
Upper Confidence Limit
Lower ConfidenceLimit
Width of Confidence Interval
Population Parameter
(22.5 yrs)
Upper Confidence
Limit (25 yrs)
Lower Confidence
Limit (20 yrs)
Width of Confidence Interval
FORMULA:
_
Point estimate (x) + Critical Value x Standard Error
Confidence Interval is a particular interval ofestimate
• Central Limit Theorem:
•Given that sample size is large, the 95% of the sample means
taken from same population and same sample size will fall in +
1.96 SD of the population mean.
• _ _
• X + 1.96 σ/n
Standard Normal Curve
μ
16
Consider a 95% confidence interval:
1   .95   .05  / 2  .025
Z= 1.96
α .025
2
α .025
2
Upper
Confidence
Limit
Point Estimation
0
.475
.475
Z= -1.96
Lower
Confidence
Limit
μl
Z
μu
90%=0.05
95%= 0.025
99%= 0.005
• Three commonly used Confidence Intervals are 90%,
95% (by default) , and 99%.
• Why not too small or too large confidence intervals?
 Too wide: 99.9%  Interval too broad
 Too narrow: 80 %  More uncertainty to have
population mean.
• The 99% of the sample means taken from same populationand
same sample size will fall in + 2.575 SD of the population
mean. _ _
X + 2.575 σ/n
• Interpretation: 99% probability that interval will enclose
population parameter and 1% chance that it will not have
population parameter.
• Level of confidence (1- ) : The level ofcertainty
that the interval will have the true population mean.
• Chances of Error : Chances that the interval will not
cater the true parameter.
• Sum of level of confidence and chances of error =100%
The more the confidence, the wider will be the
confidence interval.
FORMULA:
_
Point estimate (x) + Critical Value x Standard Error
The survey of 30 emergency room patients
found that the average waiting time for
treatment was 174.3minutes.
Given that the standard deviation is 46.5
minutes. Find the best point estimate of
population parameter (mean). The
confidence level is95%.
Reference: Bluman (2012)
Point estimate (x) + Critical Value x StandardError
174.3 + 1.96 x 46.5/ √ 30
174.3 + 1.96 x 46.5/ 5.47
174.3 + 1.96 x 8.5
174.3 + 16.6
157.7, 190.9
(LL , UL)
LL: Lower limit UL: Upper limit
Sample Size (Increase in sample sizewill
narrow confidence interval).
Increase in variability will increase confidence Interval.
Bluman (2012). Elementary Statistics: A Step by StepApproach
(8th.). McGraw Hill.
Daniel (2014). Biostatistics: Basic Concepts and Methodology
for the Health Sciences. New York: John Wiley &Sons.
Acknowledgements
Dr Tazeen Saeed Ali
RM, RM, BScN, MSc ( Epidemiology &
Biostatistics), Phd (Medical Sciences), Post
Doctorate (Health Policy & Planning)
Associate Dean School of Nursing & Midwifery
The Aga Khan University Karachi.
Kiran Ramzan Ali Lalani
BScN, MSc Epidemiology & Biostatistics (Candidate)
Registered Nurse (NICU)
Aga Khan University Hospital
Lecture 6 Point and Interval Estimation.pptx

Lecture 6 Point and Interval Estimation.pptx

  • 2.
    Shakir Rahman BScN, MScN,MSc Applied Psychology, PhD Nursing (Candidate) Principal & Assistant Professor Ayub International College of Nursing & AHS Peshawar Visiting Faculty Swabi College of Nursing & Health Sciences Swabi Nowshera College of Nursing & Health Sciences Nowshera
  • 3.
    By the endof the session, students will be able to: Apply the basics of inferential statistics in terms of point estimation. Compute point and estimation of population means and confidence interval. Interpret the results of point and interval estimation.
  • 4.
  • 5.
    A large groupof your employees went to restaurant and ordered a dessert. None of you liked it. May be, 45% of them will prefer not eating it and leaving the restaurant and 15% of them will complaint about it to the waiter to get a fresh new dessert. With margin of error of 3% points. Youinterviewed 400 of employees.
  • 6.
    How do mentionedestimations or predictionsare related to true population parameter? What is margin of error? Is the sample of 400 sufficient to claim anything about population of all employees ordering that dessert?
  • 7.
    Estimating the valueof parameter from thesample. An aspect of inferential statistics. Why to estimate: Population is large enough so we can only estimate. Types of estimation: Point Estimation: A specified number value (single value) that is an estimate of a population parameter.The point estimate of the population mean µ is the sample mean.
  • 8.
    Interval Estimate: Rangeof values to estimate about population parameter. Example: What is an estimate of score of nursing students in entry test of Nursing school? (Out of 100 marks) a. 90 b. 80 c. 80-95 d. 75-85 Point Estimate Interval Estimate
  • 9.
    The mean heightof Pakistani girls at age 20 years is: a. 5.2 fts b. 5-5.5 fts c. 5 fts d. 5.1-5.6 fts Which of the following is an example of point estimate and which is an example of interval estimate.
  • 10.
    • Sample statistics. •From random sampling • Aims to estimate about population parameter. - Ѕ ----- Estimates ----- ----- Estimates ----- µ  • Repeated sampling in experiments will result in more than one sample means, among which any one could be a point estimator to estimate about population parameter or mean.
  • 11.
    How good isthe point estimate?
  • 12.
    Confidence Interval Estimation. Rangeof values to estimate about population parameter. May contain the parameter or not (Degree of confidence). Ranges between two values. Example: Age (in years) 4 BScN students: 20<µ < 25 or (22.5 +2.5)
  • 13.
    Population Parameter Upper Confidence Limit LowerConfidenceLimit Width of Confidence Interval
  • 14.
    Population Parameter (22.5 yrs) UpperConfidence Limit (25 yrs) Lower Confidence Limit (20 yrs) Width of Confidence Interval
  • 15.
    FORMULA: _ Point estimate (x)+ Critical Value x Standard Error
  • 16.
    Confidence Interval isa particular interval ofestimate • Central Limit Theorem: •Given that sample size is large, the 95% of the sample means taken from same population and same sample size will fall in + 1.96 SD of the population mean. • _ _ • X + 1.96 σ/n
  • 17.
  • 19.
    μ 16 Consider a 95%confidence interval: 1   .95   .05  / 2  .025 Z= 1.96 α .025 2 α .025 2 Upper Confidence Limit Point Estimation 0 .475 .475 Z= -1.96 Lower Confidence Limit μl Z μu
  • 20.
  • 22.
    • Three commonlyused Confidence Intervals are 90%, 95% (by default) , and 99%. • Why not too small or too large confidence intervals?  Too wide: 99.9%  Interval too broad  Too narrow: 80 %  More uncertainty to have population mean.
  • 23.
    • The 99%of the sample means taken from same populationand same sample size will fall in + 2.575 SD of the population mean. _ _ X + 2.575 σ/n • Interpretation: 99% probability that interval will enclose population parameter and 1% chance that it will not have population parameter.
  • 25.
    • Level ofconfidence (1- ) : The level ofcertainty that the interval will have the true population mean. • Chances of Error : Chances that the interval will not cater the true parameter. • Sum of level of confidence and chances of error =100%
  • 26.
    The more theconfidence, the wider will be the confidence interval.
  • 28.
    FORMULA: _ Point estimate (x)+ Critical Value x Standard Error
  • 29.
    The survey of30 emergency room patients found that the average waiting time for treatment was 174.3minutes. Given that the standard deviation is 46.5 minutes. Find the best point estimate of population parameter (mean). The confidence level is95%. Reference: Bluman (2012)
  • 30.
    Point estimate (x)+ Critical Value x StandardError 174.3 + 1.96 x 46.5/ √ 30 174.3 + 1.96 x 46.5/ 5.47 174.3 + 1.96 x 8.5 174.3 + 16.6 157.7, 190.9 (LL , UL) LL: Lower limit UL: Upper limit
  • 31.
    Sample Size (Increasein sample sizewill narrow confidence interval). Increase in variability will increase confidence Interval.
  • 33.
    Bluman (2012). ElementaryStatistics: A Step by StepApproach (8th.). McGraw Hill. Daniel (2014). Biostatistics: Basic Concepts and Methodology for the Health Sciences. New York: John Wiley &Sons.
  • 34.
    Acknowledgements Dr Tazeen SaeedAli RM, RM, BScN, MSc ( Epidemiology & Biostatistics), Phd (Medical Sciences), Post Doctorate (Health Policy & Planning) Associate Dean School of Nursing & Midwifery The Aga Khan University Karachi. Kiran Ramzan Ali Lalani BScN, MSc Epidemiology & Biostatistics (Candidate) Registered Nurse (NICU) Aga Khan University Hospital