The document provides the test procedure for evaluating condenser performance, including instrumentation requirements and steps to determine condenser heat load, circulating water flow, terminal temperature difference, and the expected versus actual saturation temperature and back pressure. Key parameters that will be measured include circulating water temperatures, condenser back pressure, air-steam mixture temperature, and condenser duty. Deviations from expected performance will be analyzed based on differences in circulating water inlet temperature, flow rate, and condenser heat load.
Boiler purge is the basic process of resetting boiler before lightup. This presentation explains the logic, schematics & working of purge procedure. For enhanced knowledge of this topic, I can be reached at tahoorkhn03@gmail.com.
Thermal Power Plant Boiler Efficiency ImprovementAnkur Gaikwad
Boiler is one of the central equipment used in power generation & chemical process industries. Consequently, improving boiler efficiency is instrumental in bringing down costs substantially with a few simple measures. Some of these measures are discussed in this presentation
210 MW Turbine Cycle Heat Rate includes all parameters of Steam and Condensate at various inlets and outlets of HP, IP and LP Turbines, Condenser and also takes into consideration the regenerative HP, IP/LP Heaters in the Turbine Cycle. Well Illustrated with all diagrams.
The presentation deals with the most complex and fundamental process in a CFBC boiler. i.e., Combustion. Provides an insight into the various features in a CFBC boilers which are incorporated to enhance cpmbustion.
Basic and detailed discussion on Coal Mill (Raymond) and Air Fans Performance in a Thermal Power Plant.
Gives an idea as to how the performance of Coal Mills and fans can be improved
The booklet describes the Boiler Pressure parts in the power boilers of 210/250 MW TPS boilers. The booklet is a part of text book for the students of PG 1 year course in Power Plant Engineering. It describes in details about the Economiser, waterwalls,steam coils in superheaters, reheaters,etc
Flash Steam and Steam Condensates in Return LinesVijay Sarathy
In power plants, boiler feed water is subjected to heat thereby producing steam which acts as a motive force for a steam turbine. The steam upon doing work loses energy to form condensate and is recycled/returned back to reduce the required make up boiler feed water (BFW).
Recycling steam condensate poses its own challenges. Flash Steam is defined as steam generated from steam condensate due to a drop in pressure. When high pressure and temperature condensate passes through process elements such as steam traps or pressure reducing valves to lose pressure, the condensate flashes to form steam. Greater the drop in pressure, greater is the flash steam generated. This results in a two phase flow in the condensate return lines.
Design Considerations for Antisurge Valve SizingVijay Sarathy
Centrifugal Compressors experience a phenomenon called “Surge” which can be defined as a situation where a flow reversal from the discharge side back into the compressor casing causing mechanical damage.
The reasons are multitude ranging from driver failure, power failure, upset process conditions, start up, shutdown, failure of anti-surge mechanisms, check valve failure to operator error to name a few. The consequences of surge are more mechanical in nature whereby ball bearings, seals, thrust bearing, collar shafts, impellers wear out and sometimes depending on the how powerful are the surge forces, cause fractures to the machinery parts due to excessive vibrations.
The following tutorial explains how to size an anti-surge valve for a single stage VSD system for Concept/Basic Engineering purposes.
International Journal of Engineering Research and Applications (IJERA) is an open access online peer reviewed international journal that publishes research and review articles in the fields of Computer Science, Neural Networks, Electrical Engineering, Software Engineering, Information Technology, Mechanical Engineering, Chemical Engineering, Plastic Engineering, Food Technology, Textile Engineering, Nano Technology & science, Power Electronics, Electronics & Communication Engineering, Computational mathematics, Image processing, Civil Engineering, Structural Engineering, Environmental Engineering, VLSI Testing & Low Power VLSI Design etc.
Welcome to WIPAC Monthly the magazine brought to you by the LinkedIn Group Water Industry Process Automation & Control.
In this month's edition, along with this month's industry news to celebrate the 13 years since the group was created we have articles including
A case study of the used of Advanced Process Control at the Wastewater Treatment works at Lleida in Spain
A look back on an article on smart wastewater networks in order to see how the industry has measured up in the interim around the adoption of Digital Transformation in the Water Industry.
CFD Simulation of By-pass Flow in a HRSG module by R&R Consult.pptxR&R Consult
CFD analysis is incredibly effective at solving mysteries and improving the performance of complex systems!
Here's a great example: At a large natural gas-fired power plant, where they use waste heat to generate steam and energy, they were puzzled that their boiler wasn't producing as much steam as expected.
R&R and Tetra Engineering Group Inc. were asked to solve the issue with reduced steam production.
An inspection had shown that a significant amount of hot flue gas was bypassing the boiler tubes, where the heat was supposed to be transferred.
R&R Consult conducted a CFD analysis, which revealed that 6.3% of the flue gas was bypassing the boiler tubes without transferring heat. The analysis also showed that the flue gas was instead being directed along the sides of the boiler and between the modules that were supposed to capture the heat. This was the cause of the reduced performance.
Based on our results, Tetra Engineering installed covering plates to reduce the bypass flow. This improved the boiler's performance and increased electricity production.
It is always satisfying when we can help solve complex challenges like this. Do your systems also need a check-up or optimization? Give us a call!
Work done in cooperation with James Malloy and David Moelling from Tetra Engineering.
More examples of our work https://www.r-r-consult.dk/en/cases-en/
Water scarcity is the lack of fresh water resources to meet the standard water demand. There are two type of water scarcity. One is physical. The other is economic water scarcity.
Overview of the fundamental roles in Hydropower generation and the components involved in wider Electrical Engineering.
This paper presents the design and construction of hydroelectric dams from the hydrologist’s survey of the valley before construction, all aspects and involved disciplines, fluid dynamics, structural engineering, generation and mains frequency regulation to the very transmission of power through the network in the United Kingdom.
Author: Robbie Edward Sayers
Collaborators and co editors: Charlie Sims and Connor Healey.
(C) 2024 Robbie E. Sayers
1. 8.4-1
Test Procedure
8.4 Condenser Performance Test
Table of Contents
Sr. No. Contents
8.4.1 Introduction
8.4.2 Objectives
8.4.3 Plant Specific Data
8.4.4 Test Procedure
8.4.5 References
2. 8.4-2
8.4 CONDENSER PERFORMANCE TEST
8.4.1 Introduction
Steam after doing its useful work in the turbine, is dumped into the condenser
for condensation and further recycling. The amount of work that can be
extracted from the steam in the turbine will be more if the condenser
performance is better. Monitoring of condenser performance assumes much
significance because of this.
8.4.2 Objective
This test procedure shall determine the condenser performance with regard to
one or more performance indices as follows.
i Absolute Back Pressure Deviation from Expected Valve.
ii Effect on Heat Rate deviation and its Financial Implications
iii Terminal Temperature Difference (TTD).
iv Sub-cooling of Air-steam Mixture and Condensate.
v Effectiveness of Cleaning the Tubes.
vi Circulating Water Temperature Rise.
vii Flow of Air-steam Mixture.
viiiEffects of Physical Changes in the Condenser like New Tubes, etc.
ix Circulating Water Velocity in Tubes.
8.4.3 Plant Specific Data and Characteristics
i Condenser Design Data as per Format 8.4.1
ii Heat Load Vs. Condenser Back Pressure for Different C.W Inlet
temperature
iii Generator Loss curve
iv VWO Heat Balance
8.4.4 Test Procedure
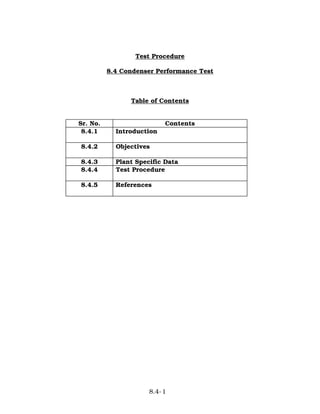
8.4.4.1 Instrumentation
The Instrumentation required for conducting performance test are :
( Refer to sketch given below – Fig- 8.4.1 & Fig 8.4.2)
3. 8.4-3
i Condenser Back Pressure (L&R)
ii CW Inlet Temperature (L&R)
iii CW Outlet Temperature (L&R)
iv Condensate temperature
v Air-steam mixture temperature (L&R)
vi Water box differential pressure (L&R)
vii CW flow
TYPICALCONDENSERINSTRUMENTATIONTYPICALCONDENSERINSTRUMENTATION
NON-CONDENSABLE
OUTLET
STEAMINLET
NON-COND.
REMOVAL
SYSTEM
CIRCULATING
WATEROUTLET
CIRCULATING
WATERINLET
F
T
F
W
PPP
P
T
DO S
T
T
P
F = FLOWMEASUREMENT
W = WATERLEVELMEASUREMENT
P = PRESSUREMEASUREMENT
PERF. TEST
CONNECTION
SUPPLEMENTAL
TESTCONNECTION
T = TEMPERATUREMEASUREMENT
DO= DISSOLVEDOXYGENMEASUREMENT
S = SALINITYMEASUREMENT
AIR/VAPOR
OUTLET
CONDENSATE
LEVEL
CONDENSATE
LEVEL
(∆∆∆∆P)
(∆∆∆∆P)
P
WW
4Nos.
Fig-8.4.1
5. 8.4-5
8.4.4.2 Test Set Up
i Ensure that condenser water box is full of water by operating water
box vents.
ii Unit should be in operation at normal full load in steady state
condition.
iii Effort should be made to conduct the test runs close to normal
operating parameters.
iv Ensure that unit is operating under specified cycle condition, for
example, cascading of H.P heater drip to deaerator.
v No make up should be taken during test.
vi High energy drains passing if any to be attended/recorded.
vii As far as possible, the condenser hot well level should be kept
constant.
viii The condenser C.W. outlet valves should be set at 100% open or as
wide as possible maintaining a full water box.
ix Make notes of any abnormal conditions pertaining to the test.
8.4.4.3 Duration of Test and frequency of readings
i. Form a data group in the DAS for Data collection during the test (see
format 8.4.2).
ii. Each test must be conducted for about 30 min for the purposes of
data collection.
iii.The frequency of data collection in DAS should be 1 min or minimum
possible to achieve, depending upon the data collection rate of DAS.
8.4.4.4 CW Flow Measurement
CW Flow measurement can be determined
i By pitot survey in the CW outlet / inlet duct
ii By Calculation of Condenser Heat Load and thereby CW flow
6. 8.4-6
It is recommended to use pitot traverse for determining CW flow The procedure
for measurement for computation of CW flow using pitot is given in the CT test
procedure in section 8.5. However in case pitot is under procurement, till then
condenser heat load method may be used to arrive at CW flow.
If Condenser Heat load method will be used for CW flow calculation, the
condenser performance test may be done along with GTCHR so that same data
can be used for condenser heat load calculation.(see format-8.4.3)
8.4.4.4.1 Determination of Condenser Duty
Condenser Duty = (Heat Added MS + Heat added by SH Attemperation +
Heat Added CRH + Heat added by BFP + Heat added
by RH Attemperation) - 860 (Pgen + Pgen Losses +
Heat Loss rad.)
Where:
Cond.Duty = kcal/hr
Heat Added MS
= Flow MS * (hMS
- hFW
), kcal/hr
Flow MS = (Flow Main Steam excluding SH Attemp ), kg/hr
hMS = (Enthalpy of Main Steam), kcal/kg
hFW
= (Enthalpy of Feed water), kcal/kg
Heat Added CRH
= Flow CRH* (hHRH
- hCRH
),kcal/hr
Flow CRH = Flow Cold Reheat Steam, kg/hr
hHRH
= (Enthalpy of Hot Reheat Steam), kcal/kg
hCRH
= (Enthalpy of Cold Reheat Steam), kcal/kg
Heat Added by BFP
= Flow FW*(hBFP Out-hBFPIn) Kcal/hr
Flow FW = Total FW flow kg/hr
hBFP Out = (Enthalpy of FW at BFP Outlet), Kcal/kg
hBFP In
= (Enthalpy of FW at BFP Inlet), Kcal/kg
Heat added by RH Attemp
= Flow RH Attemp * (hHRH-hRHATT) Kcal/hr
hRHATT = (Enthalpy of RH Attemp ), Kcal/kg
Flow RH Attemp = Kg/hr
Heat added by SH Attemp
= Flow SH Attemp* (hMS
-hSHATT
) Kcal/hr
hSHATT = (Enthalpy of SH Attemp ), Kcal/kg
Flow SH Attemp = Kg/hr
Heat Loss rad = 0.1% of Pgen (Radiation Losses) kW
7. 8.4-7
Pgen = (Gross Generator Output), kW
Pgen Losses* = (Mech Losses + Iron Losses +Stator Current Losses),
kW
* Values to be taken from Generator Loss Curve
8.4.4.4.2 Determination of CW Flow:
Cond Duty
CW Flow = ------------------------------ m3
/hr
Cp (Tout
– Tin
) x •
Where:
C.W Flow = m
3
/hr
Cond Duty = kcal/hr
Cp = 1 kcal/kg o
C (Specific heat of water)
• = 1000 kg/cubic meter (Density of water)
Tout =
o
C (Average C.W Outlet temp.)
Tin =
o
C (Average C.W Inlet temp.)
8.4.4.5 Water Velocity in Condenser Tube
Tube Velocity
C.W Flow Rate x 106
= ----------------------------------------------------------------------------------
3600 x Tube Area x (No of Tubes – No of Tube Plugged)
Where:
Tube Velocity = m/sec
C.W Flow Rate = m
3
/hr
Tube Area = mm
2
(Cross sectional area of water flow
Passage)
8.4.4.6 Determination actual Log Mean Temperature Difference (LMTD):
Tout
- Tin
LMTD = -------------------
Tsat – Tin
Ln ----------
Tsat – Tout
Where:
LMTD=
o
C
8. 8.4-8
Tsat =
o
C (saturation temperature corresponding to condenser
back pressure)
8.4.4.7 Determination of Expected LMTD :
* Correction for C.W. inlet temperature (ft)
| Saturation Temp Test - LMTD test | ¼
ft = | ------------------------------------------------ |
| Saturation Temp Design - LMTD design |
* Correction for C.W. flow (fw)
| Tube velocity test | 1/2
fw = | ----------------------- |
| Tube velocity design |
*Correction for condenser heat load (fq)
Cond. duty design
fq = ------------------------
Cond. duty test
*Expected LMTD
LMTD expected = LMTD test x ft x fw x fq
o
C
8.4.4.8 Determination of Expected Saturation Temperature:
[Tin – Tout x e
Z
]
Sat. Temp. Expected: = ---------------------------
o
C
[1 - eZ
]
Where:
Tin
= Design C.W. inlet temp.
Tour = Design C.W. outlet temp.
Tout – Tin
Z = --------------------
Expected LMTD
9. 8.4-9
Expected Back Pressure = Derived from Steam Table Corresponding to
expected Saturation Temperature
8.4.4.9 Determination of Breakup of Condenser Back Pressure Deviation:
On arriving at the backpressure deviation with respect to expected
backpressure, the following steps shall be adopted for calculating its break up,
i.e., deviation due to C.W. inlet temp, C.W. flow and effect of air ingress/dirty
tubes.
a) From design data develop a graph for a range of loads for optimum C.W.
temperature rise and TTD (Curve-II).
b) From curve-II generate another curve (load Vs BP) for different CW inlet
temperatures likely to occur as per various seasons. This curve is used to
derive expected BP for any load and for any probable CW inlet temperature
(Curve-I).
c) For computing the deviation refer the table given in Format 8.4.4
Sample test report format is given in format 8.4.5
8.4.5 References
ASME Performance Test code 12.2-1988 on steam surface Condensers.
ASME Performance Test Code 19.2-1987, Pressure Measurement
ASME Performance Test Code 19.3-1974, Temperature Measurement.
10. 8.4-10
CONDENSER DESIGN DATA
Station: ...................... Unit: .........................
DESCRIPTION UNITS VALUE
Unit Name Plate Rating
Number of Passes Number
Heat Load Considered for Design
(Condenser Duty) kcal/hr
Condenser Flow m3
/hr
Condenser Vacuum with CW Inlet Temp.
mm Hg
Tube Length Between Tube Plates meters
Total Number of Tubes Number
OD of Condenser Tubes mm
Thickness of Tubes mm
Tube Material --
Surface Area of tube mm2
Cleanliness Factor %
Water Box Diff. Pressure mwc
CW Temp. Rise
0
C
Velocity Through Tubes m/sec
TTD at Design CW Flow & Inlet Temp. 0
C
LMTD 0
C
Fromat-8.4.1
11. 8.4-11
TEST READINGS
Station: ...................... Unit: ................ Test Date: ...........
S No. DESCRIPTION UNITS TEST
READINGS
1. CW Inlet Temp(Left)
0
C
2. CW Inlet Temp(Right)
0
C
3. CW Outlet Temp(Left-1)
0
C
4. CW Outlet Temp(Left-2)
0
C
5. CW Outlet Temp(Left-3) 0
C
6. CW Outlet Temp(Left-4)
0
C
7. CW Outlet Temp(Right-1) 0
C
8. CW Outlet Temp(Right-2)
0
C
9. CW Outlet Temp(Right-3) 0
C
10. CW Outlet Temp(Right-4) 0
C
11. Condensate Temp(Left)
0
C
12. Condensate Temp(Right) 0
C
13. Air/Steam Temp(Left)*
0
C
14. Air/Steam Temp(Right)* 0
C
15. Cond B.P (Left) mmHg
16. Cond B.P (Right) mmHg
17. Water Box Diff(Left)* kg/cm
2
(abs)
18. Water Box Diff(Right)* kg/cm
2
(abs)
19. Load MW
Note : * These readings are not required for performance calculations
but needed for diagnosis of deviations/condenser performance problems
Format-8.4.2
12. 8.4-12
DAS Readings For Heat Load Calculation
S.N PARAMETER UNIT Test Data
1 Unit Load MW
2 MS Press bef ESV kg/cm2 (a)
3 MS Temp bef ESV Deg C
4 CRH Press HPT Exh kg/cm2 (a)
5 CRH Temp HPT Exh Deg C
6 HRH Press bef IV kg/cm2 (a)
7 HRH Temp bef IV Deg C
8 FW Press bef Eco kg/cm2 (a)
9 FW Temp bef Eco Deg C
10 FW Flow t/hr
11 SH Attemp. Flow t/hr
12 RH Attemp. Flow t/hr
13 HP Leak off Flow t/hr
14 HPH Extr. Temp Deg C
15 HPH Extr. Press kg/cm2 (a)
16 FW Inlet Temp Deg C
17 FW Outlet Temp Deg C
18 Drain Outlet Temp Deg C
19 Drain Inlet Temp (If applicable) Deg C
20 Drain Inlet Flow (If applicable) t/hr
21 FW Inlet Press (Optional) kg/cm2 (a)
22 FW Outlet Press (Optional) kg/cm2 (a)
23 BFP Inlet Press kg/cm2 (a)
24 BFP Inlet Temp Deg C
25 BFP Outlet Press kg/cm2 (a)
26 BFP Outlet Temp Deg C
Format-8.4.3
13. 8.4-13
Condenser Heat Load Calculation
Parameters Units Data
1 Unit Load MW 200
2 MS Press bef ESV kg/cm2 (a) 148.17
3 MS Temp bef ESV Deg C 537.42
4 CRH Press HPT Exh kg/cm2 (a) 38.645
5 CRH Temp HPT Exh Deg C 352.115
6 HRH Press bef IV kg/cm2 (a) 36.275
7 HRH Temp bef IV Deg C 526.575
8 FW Press bef Eco kg/cm2 (a) 169.77
9 FW Temp bef Eco Deg C 244
10 FW Flow t/hr 703.92
11 SH Attemp. Flow t/hr 0
12 RH Attemp. Flow t/hr 6.64
13 HP Leak off Flow t/hr 0.54
HP Heater Parameters
14 HPH Extr. Temp Deg C 335.2
15 HPH Extr. Press kg/cm2 (a) 42.742
16 FW Inlet Temp Deg C 203.3
17 FW Outlet Temp Deg C 253.4
18 Drain Outlet Temp Deg C 208.1
19 Drain Inlet Temp (If applicable) Deg C 0
20 Drain Inlet Flow (If applicable) t/hr 0
21 FW Inlet Press (Optional) kg/cm2 (a) 0
22 FW Outlet Press (Optional) kg/cm2 (a) 0
BFP Parameters
23 BFP Inlet Press kg/cm2 (a) 7
24 BFP Inlet Temp Deg C 162
25 BFP Outlet Press kg/cm2 (a) 205
26 BFP Outlet Temp Deg C 166
27 Generator Losses MW 8.489
14. 8.4-14
Condenser Parameters
28 Condenser Back Pressure mm Hg 77
29 CW Inlet Temp Deg C 33
30 CW Outlet Temp Deg C 43.45
31 No. of Cond Tubes No. 24398
32 No. of Cond Tubes Plugged No. 0
33 Tube OD mm 31.75
34 Tube ID mm 30.3276
35 Tube Length m 14.73
Condenser Duty kcal/hr 25367508
CW Flow T/hr 2428
Tube Velocity m/sec 0.077
LMTD Deg C 6.843
LMTD Expected Deg C 1.477
Saturation Temp Expected Deg C 43.459
Expected Back Pressure mm Hg 66.361
Deviation in Condenser Back Pressure mm Hg 10.639
15. 8.4-15
DETERMINATION OF BREAKUP OF CONDENSER BACK PRESSURE
DEVIATION
SR TEST
NO
.
LOAD MW
Description Derivation Unit
UNIT
No
1. Unit - Load MW 200
2. Back pressure Plant mm Hg 120.8
3. Corresponding Sat. steam temp.
o
C 55.56
4. CW inlet temp. Plant
o
C 34.16
5. CW outlet temp. (Mean) Plant
o
C 45.09
6. * Condensate temp. (Left)
* Condensate temp. (Right)
Plant
Plant
o
C 55
55
7. *Air Suction temp. (Left)
* Air Suction temp. (Right)
Plant
Plant
o
C 48.9
50.04
8. *CW Outlet Valve (Left)
* CW Outlet Valve (Right)
Plant % 100
100
9. Target back press Curve-I mm Hg 85
10. Optimum CW rise Curve-II
o
C 10
11. Optimum TTD Curve-II
o
C 2.5
12. Back pressure due to CW inlet temp. (4)+(10)+(11) mm Hg 79
13. Back pressure due to CW
flow & CW inlet temp.
(5) + (11) mm Hg 81
14. Variation due to CW inlet temp. (12)-(9) mm Hg -6
15. Variation due to CW flow (13)-(12) mm Hg 2
16. Variation due to air/dirty tubes (2)-(13) mm Hg 39.8
17. Total variation (2)- (12) mm Hg 41.8
18. No. of air pumps/ejector in service 1 No. 1
19. Air Suction Temp Depression (L) (3)-(7)
o
C 6.66
20. Air Suction Temp Depression (R) (3)-(7) o
C 6.66
21. Condensate Sub Cooling (L) (3)-(6) o
C 0.56
22 Condensate Sub Cooling (R) (3)-(6)
o
C 0.56
Remarks
Format-8.4.4
16. 8.4-16
% o f L o a d
V a r i a t i o n o f B a c k P r e s s u r e w i t h L o a d &
C W T e m p e r a t u r e
C u r v e - I
0.000
0.020
0.040
0.060
0.080
0.100
0.120
15 25 35 45 55 65 75 85 95 105
BackPressure
35 °C
30 °C
25°C
20°C
15°C
17. 8.4-17
Curve-II
% of Load
D
T
T T D
0.0
1.0
2.0
3.0
4.0
5.0
6.0
7.0
8.0
9.0
10.0
0 10 20 30 40 50 60 70 80 90 100 110
T
e
m
p
e
r
a
t
u
r
e
CW Temp Rise
TTD
T
E
M
P
E
R
A
T
U
R
E
18. 8.4-18
CONDENSER PERFORMANCE TEST REPORT
STATION Report Date:
Unit No→→→→ Unit-1 Unit-2 Unit-3 Unit-4S.N Description
Date →→→→
1 Load MW
2 Condenser Back pressure mm Hg
3 CW inlet temp. o
C
4 CW outlet temp. (Mean)
o
C
5 Condensate temp. (L&R)
o
C
6 Air Suction temp. (L&R) o
C
7 Expected Back pressure mm Hg
8 Target Back pressure mm Hg
9 Variation due to CW inlet
temp.
mm Hg
10 Variation due to CW flow mm Hg
11 Variation due to air/dirty
tubes
mm Hg
12 Total variation mm Hg
13 Air suction Temp.
Depression
o
C
Test Condition
Remarks
Format 8.4.5