This document discusses methods for assessing the energy performance of heat exchangers over time. It describes calculating the overall heat transfer coefficient U to determine if fouling or other issues have reduced efficiency. The procedure involves monitoring operating parameters, calculating thermal properties, and determining U by measuring the heat duty, surface area, and log mean temperature difference. An example application to a liquid-liquid exchanger is provided, comparing test data to design specifications to identify potential fouling issues.
How a Heat Treating Plant Ensures Tight Process Control and Exceptional Quali...InfluxData
American Metal Processing Company ("AMP") is the US' largest commercial rotary heat treat facility with customers in the automotive, construction, military, and agriculture industries. They use their atmosphere-protected rotary retort furnaces to provide their clients with three primary hardening services: neutral hardening (quench and temper), carburizing, and carbonitriding.
This furnace style ensures consistent, uniform heat treatment process vs. traditional batch-or-belt-style furnaces; excels at processing high volumes of smaller parts with tight tolerances; and improves the strength and toughness of plain carbon steels. Discover why AMP’s use of Telegraf, InfluxDB, Node-RED, and Grafana allows them to gain 24/7 insights into their plant operations and metallurgical results. Learn how they use time-stamped data to gain accurate metrics about their consumables usage, furnace profiles, and machine status.
Join this webinar as Grant Pinkos dives into:
American Metal Processing's approach to heat treating in a digitized environment through connected systems
Their approach to collecting and measuring sensor data to enable predictive maintenance and improve product quality
Why they need a time series database for managing and analyzing vast amounts of time-stamped data
Improving Industrial Machine Support Using InfluxDB, Web SCADA, and AWSInfluxData
LBBC Technologies are the world’s leading designers and manufacturers of industrial autoclave technology. Aerospace customers use this equipment in the manufacture of high performance castings, like turbine blades. With hundreds of machines all over the world, LBBC are pushing the boundaries of the support they can offer customers. All LBBC equipment comes fitted with industrial gateways which simplify the data connections between industrial PLC controllers and web services - like AWS. This enables LBBC to offer their customers “Connected Support” and Web SCADA. Through their Connected Support software solution, LBBC are providing customers with advanced diagnosis tools used for troubleshooting and process optimization. Discover how they are using a time series platform to enable faster remote anomaly detection and quicker time to resolution.
Join this webinar as Andrew Smith dives into:
The architecture that LBBC have chosen
The role that InfluxDB plays [alongside other elements of LBBC’s IIoT infrastructure]
The way in which industrial customers are using InfluxDB [to monitor equipment condition and provide advanced support services]
An example of how the infrastructure is delivering valuable insights that are leading to competitive advantage
InfluxDB tips and best practices (including the MQTT Native Collector)
Selection and Design of Condensers
0 INTRODUCTION/PURPOSE
1 SCOPE
2 FIELD OF APPLICATION
3 DEFINITIONS
4 CHOICE OF COOLANT
5 LAYOUT CONSIDERATIONS
5.1 Distillation Column Condensers
5.2 Other Process Condensers
6 CONTROL
6.1 Distillation Columns
6.2 Water Cooled Condensers
6.3 Refrigerant Condensers
7 GENERAL DESIGN CONSIDERATIONS
7.1 Heat Transfer Resistances
7.2 Pressure Drop
7.3 Handling of Inerts
7.4 Vapor Inlet Design
7.5 Drainage of Condensate
8 SUMMARY OF TYPES AVAILABLE
8.1 Direct Contact Condensers
8.2 Shell and Tube Exchangers
8.3 Air Cooled Heat Exchangers
8.4 Spiral Plate Heat Exchangers
8.5 Internal Condensers
8.6 Plate Heat Exchangers
8.7 Plate-Fin Heat Exchangers
8.8 Other Compact Designs
9 BIBLIOGRAPHY
FIGURES
1 DIRECT CONTACT CONDENSER WITH INDIRECT COOLER FOR RECYCLED CONDENSATE
2 SPRAY CONDENSER
3 TRAY TYPE CONDENSER
4 THREE PASS TUBE SIDE CONDENSER WITH INTERPASS LUTING FOR CONDENSATE DRAINAGE
5 CROSS FLOW CONDENSER WITH SINGLE PASS COOLANT
AFS slug catcher sizing in a gas gathering systemAdam Murray
Elijah Kempton of AFS gave a great lunch and learn to go over slug catcher sizing in a gas gathering system. He discusses pigging and other considerations when engineering your gathering system.
In this Thesis I will try to understand the concept associated with cooling towers and model a laboratory sized cooling tower in a software package called Engineering Equation Solver (EES). An example of system modelling is presented in this progress report, along with the comparison of a set of results with an experimental data from P.A Hilton Model H892 Bench top cooling tower with a maximum of 9% error. A user interface is also modelled to simulate off-design performance rather than conducting experiments. It also allows you to do additional scenarios that cannot be practically being done in lab,
like Relative humidity, etc.
Introduction and Theoretical Aspects
Catalyst Reduction and Start-up
Normal Operation and Troubleshooting
Shutdown and Catalyst Discharge
Nickel Carbonyl Hazard
Modern Methanation Catalyst Requirements
Reliability and Maintenance Conference - 7-9 April 2014, Al Khobar, Kingdom o...Ricky Smith CMRP, CMRT
Despite the best efforts and precautions, equipment
failures do occur hampering the equipment performance
and adversly impacting the profitibility of the business.
Rotating Equipment Reliability and Maintenance
Conference aims to create a learning platform for all the
maintenance and reliability professionals to share the
best maintenance practices and discuss the strategies to
improve reliability.
This three day conference will cover all aspects of
reliability and maintenance including reliability centered
maintenance, availability, machinery failures, risk
assessment, spare parts optimization, techniques to
facilitate equipment maintenance, root cause analysis,
condition monitoring, maintenance planning and
scheduling.
Reformer Tube design principles
- Larsen Miller Plot
- Larsen Miller & Tube Design
- Design Margins - Stress Data Used
- Max Allowable & Design Temperature
- Tube Life
- Effect of Temperature on Life
- Material Types
HK40: 25 Cr / 20 Ni
HP Modified: 25 Cr / 35 Ni + Nb
Microalloy: 25 Cr / 35 Ni + Nb + Ti
- Alloy Developments
- Comparison of Alloys
Manufacturing Technology
- Welds
Failure mechanisms
- Failure Mechanisms - Creep
- Creep Propagation
- Common Failure Modes
- Uncommon Failure Modes
- Failure by Creep
- Creep Rupture - Cross Section
- Failure at Weld
Actions to Take if Tube Fails
- Pigtail Nipping
Inspection techniques
Classification of Problems
- Visual Examination
- Girth Measurement
- Ultrasonic Attenuation
- Radiography
Eddy Current Measurement
LOTIS Tube Inspection
LOTIS Compared to External Inspection
La recupercion de Energia termica que eliminan los gases de escape a la atmotfera de las turbinas o generadores de combustion interna. Pueden ser aprovechadas para producir vapor de media presion y ser utilizadas en la industria. La cogeneracion es una importante alternativa para generar grandes ahorros de combustible. Te invito a investigar y tomar las mejores decisiones para tus proyectos de ahorro energetico.
Line Sizing presentation on Types and governing Equations.Hassan ElBanhawi
Based on my 8 years of experience in Oil & Gas industry I can claim that you can find here All what you need to know about Pipeline Sizing. This is an introduction to understand more about their:-
-The basic idea.
-Simplified method for calculations.
-Equations.
-Data Tables.
-Worked Examples.
-Excel Sheets for Calculation.
-Links to other topics which may be interesting.
You can find also more at:
http://hassanelbanhawi.com/staticequipment/linesizing/
All the data and the illustrative figures presented here can be found through two reference books:-
ENGINEERING DATA BOOK by Gas Processors Suppliers Association
Process Technology - Equipment and Systems by Charles E. Thomas
Thank you.
It’s pretty obvious, really. An efficient steam trap wastes less energy, which means you burn less fuel and reduce emissions.
The results are energy savings and a cleaner, healthier environment. By helping companies manage energy, Armstrong steam traps are also helping protect the world we all share.
As a steam trap wears, it loses efficiency and begins to waste energy. But Armstrong inverted bucket traps last years longer than other traps. They operate more efficiently longer because the inverted bucket is the most reliable steam trap operating principle known.
Clearly, the longer an efficient trap lasts, the more it reduces energy wasted, fuel burned and pollutants released into the air. It’s an all-around positive situation that lets the environment win, too. Bringing energy down to earth in your facility could begin with a renewed focus on your steam system, especially your steam traps. Said another way: Zeroing in your steam traps is an easy way to pay less money for energy—and more attention to the environment.
Companies around the world are beginning to realize that rather than being separate challenges, energy and the environment are and have always been a single mission. And that quality management in one area will surely impact the other.
The catalog below should be utilized as a guide for the installation and operation of steam trapping equipment. Selection or installation should always be accompanied by competent technical assistance or advice. Armstrong and its local representatives are available for consultation and technical assistance. We encourage you to contact your Armstrong Representative for complete details.
To demonstrate the effect of cross sectional area on the heat rate.
To measure the temperature distribution for unsteady state conduction of heat through the uniform plane wall and the wall of the thick cylinder.
The experiment demonstrates heat conduction in radial conduction models It
allows us to obtain experimentally the coefficient of thermal conductivity of some unknown materials and in this way, to understand the factors and parameters that affect the rates of heat transfer.
To understand the use of the Fourier Rate Equation in determining the rate of heat flow for of energy through the wall of a cylinder (radial energy flow).
To use the equation to determine the constant of proportionality (the thermal conductivity, k) of the disk material.
To observe unsteady conduction of heat
Heat/light/electrical energy is out today’s necessity and has scarcity also. Energy conservation is key requirement of any industry at all times.
In general, industries use heat energy for conservation of raw material to finished product. The source of heat energy is generally saturated or super heated steam. The steam generation is common use one boiler with carity of fuels. Whatever may be the fuel the generation should be as economy as possible which adds to the product cost. Further the usage of steam and recycling steam condensate back to boiler is an art depending on plant layouts.
In this project the steam generator is water tube boiler fired with rice husk. The steam is transferred to the tyre/tube moulds where tyres/tubes are cured while the heat is rejected to the tyres the condensate forms and this condensate is put back to the boiler. While doing so the steam is also stopped back to boiler without rejecting complete heat to the product. This gets flashed into atmosphere at feed water tank. The science of separation of condensate from steam saves energy. Better the separation more the fuel conservation.
In the steam generator the fuel is burnt to heat the water and form steam. This fuel burnt flue gas carries lot of energy, out through chimney. Prior to exhausting through the heat left in flue need to be recovered, through heat recovery mechanisms’. In this project an air-preheater condensate heat recovery unit is the major energy consuming station.
The French Revolution, which began in 1789, was a period of radical social and political upheaval in France. It marked the decline of absolute monarchies, the rise of secular and democratic republics, and the eventual rise of Napoleon Bonaparte. This revolutionary period is crucial in understanding the transition from feudalism to modernity in Europe.
For more information, visit-www.vavaclasses.com
Unit 8 - Information and Communication Technology (Paper I).pdfThiyagu K
This slides describes the basic concepts of ICT, basics of Email, Emerging Technology and Digital Initiatives in Education. This presentations aligns with the UGC Paper I syllabus.
Palestine last event orientationfvgnh .pptxRaedMohamed3
An EFL lesson about the current events in Palestine. It is intended to be for intermediate students who wish to increase their listening skills through a short lesson in power point.
Honest Reviews of Tim Han LMA Course Program.pptxtimhan337
Personal development courses are widely available today, with each one promising life-changing outcomes. Tim Han’s Life Mastery Achievers (LMA) Course has drawn a lot of interest. In addition to offering my frank assessment of Success Insider’s LMA Course, this piece examines the course’s effects via a variety of Tim Han LMA course reviews and Success Insider comments.
Synthetic Fiber Construction in lab .pptxPavel ( NSTU)
Synthetic fiber production is a fascinating and complex field that blends chemistry, engineering, and environmental science. By understanding these aspects, students can gain a comprehensive view of synthetic fiber production, its impact on society and the environment, and the potential for future innovations. Synthetic fibers play a crucial role in modern society, impacting various aspects of daily life, industry, and the environment. ynthetic fibers are integral to modern life, offering a range of benefits from cost-effectiveness and versatility to innovative applications and performance characteristics. While they pose environmental challenges, ongoing research and development aim to create more sustainable and eco-friendly alternatives. Understanding the importance of synthetic fibers helps in appreciating their role in the economy, industry, and daily life, while also emphasizing the need for sustainable practices and innovation.
Macroeconomics- Movie Location
This will be used as part of your Personal Professional Portfolio once graded.
Objective:
Prepare a presentation or a paper using research, basic comparative analysis, data organization and application of economic information. You will make an informed assessment of an economic climate outside of the United States to accomplish an entertainment industry objective.
1. 4. ENERGY PERFORMANCE ASSESSMENT OF HEAT
EXCHANGERS
4.1 Introduction
Heat exchangers are equipment that transfer heat from one medium to another. The
proper design, operation and maintenance of heat exchangers will make the process
energy efficient and minimize energy losses. Heat exchanger performance can deteriorate
with time, off design operations and other interferences such as fouling, scaling etc. It is
necessary to assess periodically the heat exchanger performance in order to maintain
them at a high efficiency level. This section comprises certain proven techniques of
monitoring the performance of heat exchangers, coolers and condensers from observed
operating data of the equipment.
4.2 Purpose of the Performance Test
To determine the overall heat transfer coefficient for assessing the performance of the
heat exchanger. Any deviation from the design heat transfer coefficient will indicate
occurrence of fouling.
4.3 Performance Terms and Definitions
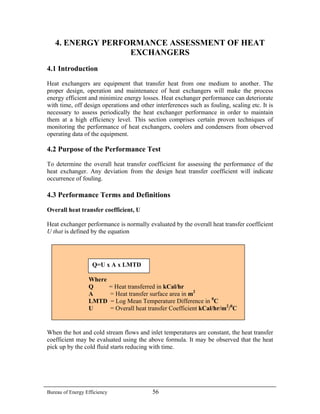
Overall heat transfer coefficient, U
Heat exchanger performance is normally evaluated by the overall heat transfer coefficient
U that is defined by the equation
Where
Q = Heat transferred in kCal/hr
A = Heat transfer surface area in m2
LMTD = Log Mean Temperature Difference in 0
C
U = Overall heat transfer Coefficient kCal/hr/m2
/0
C
Q=U x A x LMTD
When the hot and cold stream flows and inlet temperatures are constant, the heat transfer
coefficient may be evaluated using the above formula. It may be observed that the heat
pick up by the cold fluid starts reducing with time.
Bureau of Energy Efficiency 56
2. 4. Energy Performance Assessment of Heat Exchangers
Nomenclature
A typical heat exchanger is shown in figure 4.1 with nomenclature.
Shell
Baffles
Hot fluid out
W, To
Cold fluid out
w, to
Cold fluid in
w, ti
Hot fluid in
W, Ti
Figure 4.1 Typical Shell and Tube Heat Exchanger
Heat duty of the exchanger can be calculated either on the hot side fluid or cold side fluid
as given below.
Heat Duty for Hot fluid, Qh = W x Cph x (Ti-To) ………..Eqn-1,
Heat Duty for Cold fluid, Qc = w x Cpc x ( to-ti) ………...Eqn-2
If the operating heat duty is less than design heat duty, it may be due to heat losses,
fouling in tubes, reduced flow rate (hot or cold) etc. Hence, for simple performance
monitoring of exchanger, efficiency may be considered as factor of performance
irrespective of other parameter. However, in industrial practice, fouling factor method is
more predominantly used.
4.4 Methodology of Heat Exchanger Performance Assessment
4.4.1 Procedure for determination of Overall heat transfer Coefficient, U at field
This is a fairly rigorous method of monitoring the heat exchanger performance by
calculating the overall heat transfer coefficient periodically. Technical records are to be
maintained for all the exchangers, so that problems associated with reduced efficiency
and heat transfer can be identified easily. The record should basically contain historical
heat transfer coefficient data versus time / date of observation. A plot of heat transfer
coefficient versus time permits rational planning of an exchanger-cleaning program.
The heat transfer coefficient is calculated by the equation
U = Q / (A x LMTD)
Where Q is the heat duty, A is the heat transfer area of the exchanger and LMTD is
temperature driving force.
The step by step procedure for determination of Overall heat transfer Coefficient are
described below
Bureau of Energy Efficiency 57
3. 4. Energy Performance Assessment of Heat Exchangers
Step – A
Monitoring and reading of steady state parameters of the heat exchanger under
evaluation are tabulated as below:
Parameters Units Inlet Outlet
Hot fluid flow,W kg/h
Cold fluid flow,w kg/h
Hot fluid Temp, T O
C
Cold fluid Temp,t O
C
Hot fluid Pressure,P bar g
Cold fluid Pressure, p bar g
Step – B
With the monitored test data, the physical properties of the stream can be tabulated
as required for the evaluation of the thermal data
Parameters Units Inlet Outlet
Hot fluid density, ρh kg/m3
Cold fluid density, ρc kg/m3
Hot fluid Viscosity, µh MpaS*
Cold fluid Viscosity, µc MPaS
Hot fluid Thermal
Conductivity, kh
kW/(m. K)
Cold fluid Thermal
Conductivity, kc
kW/(m. K)
Hot fluid specific heat
Capacity, Cph
kJ/(kg. K)
Cold fluid specific heat
Capacity, Cpc
kJ/(kg. K)
* MpaS – Mega Pascal Second
Density and viscosity can be determined by analysis of the samples taken from the flow
stream at the recorded temperature in the plant laboratory. Thermal conductivity and
specific heat capacity if not determined from the samples can be collected from
handbooks.
Step – C
Calculate the thermal parameters of heat exchanger and compare with the design
data
Parameters Units Test Data Design Data
Heat Duty, Q kW
Hot fluid side pressure drop, ∆Ph bar *
Cold fluid side pressure drop, ∆Pc bar *
Bureau of Energy Efficiency 58
4. 4. Energy Performance Assessment of Heat Exchangers
Temperature Range hot fluid , ∆T O
C
Temperature Range cold fluid , ∆t O
C
Capacity ratio, R -----
Effectiveness, S -----
Corrected LMTD, MTD O
C
Heat Transfer Coefficient, U kW/(m2
. K)
* - The pressure drop for the design flow can be rated with the relation
Pressure drop is proportional to (Flow)1.75
Step – D
The following formulae are used for calculating the thermal parameters:
1. Heat Duty, Q = qs + ql
Where,
qs is the sensible heat and ql is the latent heat
For Senisble heat
qs = Wx Cph x(Ti- To)/1000/3600 in kW
(or)
qs = w x Cpc x (to-ti)/1000/3600 in kW
For Latent heat
ql= W x λh ,
λh – Latent heat of Condensation of a hot condensing vapor
(or)
ql = w x λc , where λc - Latent heat of Vaporization
2. Hot Fluid Pressure Drop, ∆Ph = Pi – Po
3. Cold fluid pressure drop, ∆Pc = pi- po
4. Temperature range hot fluid, ∆T = Ti- To
5. Temperature range cold fluid, ∆t = to – ti
6. Capacity ratio, R = W x CPh / w x Cpc (or) (Ti- To) / (to- ti)
7. Effectiveness, S = (to- ti) / (Ti – ti)
Bureau of Energy Efficiency 59
5. 4. Energy Performance Assessment of Heat Exchangers
8. LMTD
a) Counter current Flow Co-current flow
To
Ti ToTi
tito ti to
LMTD Counter current Flow = ((Ti-to) – (To-ti)) / ln ((Ti-to)/(To-ti))
LMTD Co current Flow = ((Ti-ti) – (To-to)) / ln ((Ti-ti)/(To-to))
b) Correction factor for LMTD to account for Cross flow
(R + 1)1/2
x ln ((1- SR)/ (1- S ))
F =
( 1 – R) x ln 2- S ( R + 1 – (R +1)1/2
)
2- S ( R + 1 + (R +1)1/2
)
9. Corrected LMTD
= F x LMTD
10. Overall Heat Transfer Co-efficient
U = Q / (A x Corrected LMTD)
4.4.2 Examples
a. Liquid – Liquid Exchanger
A shell and tube exchanger of following configuration is considered being used for oil
cooler with oil at the shell side and cooling water at the tube side.
Tube Side
460 Nos x 25.4mmOD x 2.11mm thick x 7211mm long
Pitch – 31.75mm 30o
triangular
2 Pass
Shell Side
787 mm ID
Baffle space – 787 mm
1 Pass
Bureau of Energy Efficiency 60
6. 4. Energy Performance Assessment of Heat Exchangers
The monitored parameters are as below:
Parameters Units Inlet Outlet
Hot fluid flow, W kg/h 719800 719800
Cold fluid flow, w kg/h 881150 881150
Hot fluid Temp, T O
C 145 102
Cold fluid Temp, t O
C 25.5 49
Hot fluid Pressure, P bar g 4.1 2.8
Cold fluid Pressure, p bar g 6.2 5.1
Calculation of Thermal data:
Heat Transfer Area = 264.55 m2
1. Heat Duty:
Q = qs + ql
Hot fluid, Q = 719800 x 2.847 x (145 –102) /3600 = 24477.4 kW
Cold Fluid, Q = 881150 x 4.187 x (49 – 25.5) = 24083.4 kW
3600
2.Hot Fluid Pressure Drop
Pressure Drop = Pi – Po = 4.1 – 2.8 = 1.3 bar g.
3.Cold Fluid Pressure Drop
Pressure Drop = pi – po = 6.2 – 5.1 = 1.1 bar g.
4.Temperature range hot fluid
Temperature Range ∆T = Ti – To = 145 – 102 = 43 o
C.
5.Temperature Range Cold Fluid
Temperature Range ∆t = to – ti = 49 – 25.5 = 23.5 0
C.
6.Capacity Ratio
Capacity ratio, R = (Ti-To) / (to-ti) = 43 = 1.83
23.5
7.Effectiveness
Effectiveness, S = (to – ti) / (Ti – ti) =(49 – 25.5)/(145-25.5) =23.5/119.5 = 0.20.
8.LMTD
a) LMTD, Counter Flow = (96 – 76.5)/ ln (96/76.5) = 85.9 0
C.
b) Correction Factor to account for Cross flow
Bureau of Energy Efficiency 61
7. 4. Energy Performance Assessment of Heat Exchangers
(R + 1)1/2
x ln ((1- SR)/ (1- S )
F =
( 1 – R) x ln 2- S ( R + 1 – (R +1)1/2
)
2- S ( R + 1 + (R +1)1/2)
F = 0.977.
9.Corrected LMTD
= F x LMTD = 0.977 x 85.9 = 83.9 o
C.
10. Overall Heat Transfer Co-efficient
U = Q/ A ∆T = 24477.4/ (264.55 x 83.9) = 1.104 kW/m2
. K
Comparison of Calculated data with Design Data
Parameters Units Test Data Design Data
Duty, Q kW 24477.4 25623
Hot fluid side pressure drop, ∆Ph Bar
1.3
1.34
Cold fluid side pressure drop, ∆Pc Bar
1.1
0.95
Temperature Range hot fluid, ∆T O
C
43
45
Temperature Range cold fluid, ∆t O
C 23.5 25
Capacity ratio, R ----- 1.83 0.556
Effectiveness, S ----- 0.20 0.375
Corrected LMTD, MTD O
C 83.8 82.2
Heat Transfer Coefficient, U kW/(m2
. K) 1.104 1.178
Inferences:
Actual measured
Design profile
L – Distance across the heat
exchanger;
T- Terminal temperatures
T
L
Bureau of Energy Efficiency 62
8. 4. Energy Performance Assessment of Heat Exchangers
Heat Duty: Actual duty differences will be practically negligible as these duty differences
could be because of the specific heat capacity deviation with the temperature. Also, there
could be some heat loss due to radiation from the hot shell side.
Pressure drop: Also, the pressure drop in the shell side of the hot fluid is reported normal
(only slightly less than the design figure). This is attributed with the increased average
bulk temperature of the hot side due to decreased performance of the exchanger.
Temperature range: As seen from the data the deviation in the temperature ranges could
be due to the increased fouling in the tubes (cold stream), since a higher pressure drop is
noticed.
Heat Transfer coefficient: The estimated value has decreased due to increased fouling
that has resulted in minimized active area of heat transfer.
Physical properties: If available from the data or Lab analysis can be used for verification
with the design data sheet as a cross check towards design considerations.
Troubleshooting: Fouled exchanger needs cleaning.
b. Surface Condenser
A shell and tube exchanger of following configuration is considered being used for
Condensing turbine exhaust steam with cooling water at the tube side.
Tube Side
20648 Nos x 25.4mmOD x 1.22mm thk x 18300mm long
Pitch – 31.75mm 60o
triangular
1 Pass
The monitored parameters are as below:
Parameters Units Inlet Outlet
Hot fluid flow, W kg/h 939888 939888
Cold fluid flow, w kg/h 55584000 55584000
Hot fluid Temp, T O
C No data 34.9
Cold fluid Temp, t O
C 18 27
Hot fluid Pressure, P Bar g 52.3 mbar 48.3
Cold fluid Pressure, p Bar g 4 3.6
Calculation of Thermal data:
Area = 27871 m2
1. Duty:
Q = qS + qL
Hot fluid, Q = 576990 kW
Cold Fluid, Q = 581825.5 kW
Bureau of Energy Efficiency 63
9. 4. Energy Performance Assessment of Heat Exchangers
2.Hot Fluid Pressure Drop
Pressure Drop = Pi – Po = 52.3 – 48.3 = 4.0 mbar.
3.Cold Fluid Pressure Drop
Pressure Drop = pi – po = 4 – 3.6 = 0.4 bar.
4.Temperature range hot fluid
Temperature Range ∆T = Ti – To = No data
5.Temperature Range Cold Fluid
Temperature Range ∆t = ti – to = 27 – 18 = 9 o
C.
6.Capacity Ratio
Capacity ratio, R = Not significant in evaluation here.
7.Effectiveness
Effectiveness, S = (to – ti) / (Ti – ti) = Not significant in evaluation here.
8.LMTD
Calculated considering condensing part only
a). LMTD, Counter Flow =((34.9 – 18)-(34.9-27))/ ln ((34.9-18)/(34.9-27)) = 11.8
deg C.
b). Correction Factor to account for Cross flow
F = 1.0.
9.Corrected LMTD
MTD = F x LMTD = 1.0 x 11.8 = 11.8 deg C.
10. Heat Transfer Co-efficient
Overall HTC, U = Q/ A ∆T = 576990/ (27871 x 11.8) = 1.75 kW/m2
. K
Comparison of Calculated data with Design Data
Parameters Units Test Data Design Data
Duty, Q kW 576990 588430
Hot fluid side pressure drop, ∆Ph mBar 4 mbar
3.7 mbar
Cold fluid side pressure drop, ∆Pc Bar 0.4
Temperature Range hot fluid, ∆T O
C
Temperature Range cold fluid, ∆t O
C (27-18) = 9 (28-19)=9
Capacity ratio, R -----
Effectiveness, S -----
Corrected LMTD, MTD O
C 11.8 8.9
Heat Transfer Coefficient, U kW/(m2
. K) 1.75 2.37
Bureau of Energy Efficiency 64
10. 4. Energy Performance Assessment of Heat Exchangers
Inferences:
Actual measured
Design profile
L – Distance across the heat exchanger;
T- Terminal temperatures
T
L
Heat Duty: Actual duty differences will be practically negligible as these duty differences
could be because of the specific heat capacity deviation with the temperature. Also, there
could be some heat loss due to radiation from the hot shell side.
Pressure drop: The condensing side operating pressure raised due to the backpressure
caused by the non-condensable. This has resulted in increased pressure drop across the
steam side
Temperature range: With reference to cooling waterside there is no difference in the
range however, the terminal temperature differences has increased indicating lack of
proper heat transfer.
Heat Transfer coefficient: Heat transfer coefficient has decreased due to increased
amount of non-condensable with the steam.
Trouble shooting:
Operations may be checked for tightness of the circuit and ensure proper venting of the
system. The vacuum source might be verified for proper functioning.
c. Vaporizer
A shell and tube exchanger of following configuration is considered being used for
vaporizing chlorine with steam at the shell side.
Tube Side
200 Nos x 25.4mmOD x 1.22mm thick x 6000mm long
Pitch – 31.75mm 30o
triangular
2 Pass
Area = 95.7.m2
Bureau of Energy Efficiency 65
11. 4. Energy Performance Assessment of Heat Exchangers
The monitored parameters are as below:
Parameters Units Inlet Outlet
Hot fluid flow, W kg/h 5015 5015
Cold fluid flow, w kg/h 43500 43500
Hot fluid Temp, T O
C 108 108
Cold fluid Temp, t O
C 30 34
Hot fluid Pressure, P Bar g 0.4 0.3
Cold fluid Pressure, p Bar g 9 8.8
Calculation of Thermal data:
1. Duty:
Q = qS + qL
Hot fluid, Q = 3130 kW
Cold Fluid, Q = qS + qL = 180.3 kW + 2948 kW = 3128.3 kW
2.Hot Fluid Pressure Drop
Pressure Drop = Pi – Po = 0.4 – 0.3 = 0.1 bar
3.Cold Fluid Pressure Drop
Pressure Drop = pi – po = 9 – 8.8 = 0.2 bar.
4.Temperature range hot fluid
Temperature Range ∆T = Ti – To = 0 o
C
5.Temperature Range Cold Fluid
Temperature Range ∆t = ti – to = 34 – 30 = 4 o
C.
6.Capacity Ratio
Capacity ratio, R = Not significant in evaluation here.
7.Effectiveness
Effectiveness, S = (to – ti) / (Ti – ti) = Not significant in evaluation here.
8.LMTD
Calculated considering condensing part only
a) LMTD, Counter Flow =((108 – 30)-(108-34))/ ln ((108-30)/(108-34)) = 76 o
C.
b) Correction Factor to account for Cross flow
F = 1.0.
9.Corrected LMTD
MTD = F x LMTD = 1.0 x 76 = 76 o
C.
10. Heat Transfer Co-efficient
Overall HTC, U = Q/ A ∆T = 3130/ (95.7 x 76) = 0.43 kW/m2
. K
Bureau of Energy Efficiency 66
12. 4. Energy Performance Assessment of Heat Exchangers
Comparison of Calculated data with Design Data
Parameters Units Test Data Design Data
Duty, Q kW 3130 3130
Hot fluid side pressure drop,
∆Ph
Bar 0.1 Neg
Cold fluid side pressure
drop, ∆Pc
Bar 0.2
Temperature Range hot
fluid, ∆T
O
C
Temperature Range cold
fluid, ∆t
O
C 4 4
Capacity ratio, R -----
Effectiveness, S -----
Corrected LMTD, MTD O
C 76
Heat Transfer Coefficient, U kW/(m2
. K) 0.42 0.44
Inferences:
Actual measured
Design profile
T
L – Distance across the heat
exchanger;
T- Terminal temperatures
L
Heat Duty: There is no difference inferred from the duty as the exchanger is performing
as per the requirement
Pressure drop: The steam side pressure drop has increased in spite of condensation at the
steam side. Indication of non-condensable presence in steam side
Temperature range: No deviations
Heat Transfer coefficient: Even at no deviation in the temperature profile at the chlorine
side, heat transfer coefficient has decreased with an indication of overpressure at the shell
side. This indicates disturbances to the condensation of steam at the shell side. Non-
condensable suspected at steam side.
Trouble shooting:
Operations may be checked for presence of chlorine at the shell side through tube
leakages. Observing the steam side vent could do this. Alternately condensate pH could
be tested for presence of acidity.
Bureau of Energy Efficiency 67
13. 4. Energy Performance Assessment of Heat Exchangers
d. Air heater
A finned tube exchanger of following configuration is considered being used for heating
air with steam in the tube side.
The monitored parameters are as below:
Parameters Units Inlet Outlet
Hot fluid flow, W kg/h 3000 3000
Cold fluid flow, w kg/h 92300 92300
Hot fluid Temp, T O
C 150 150
Cold fluid Temp, t O
C 30 95
Hot fluid Pressure, P Bar g
Cold fluid Pressure, p Bar g 200 mbar 180 mbar
Calculation of Thermal data:
Bare tube Area = 42.8 m2
; Fined tube area = 856 m2
1.Duty:
Hot fluid, Q = 1748 kW
Cold Fluid, Q = 1726 kW
2.Hot Fluid Pressure Drop
Pressure Drop = Pi – Po = Neg
3.Cold Fluid Pressure Drop
Pressure Drop = pi – po = 200–180 = 20 mbar.
4.Temperature range hot fluid
Temperature Range ∆T = Ti – To = Not required.
5.Temperature Range Cold Fluid
Temperature Range ∆t = ti – to = 95 – 30 = 65 o
C.
6.Capacity Ratio
Capacity ratio, R = Not significant in evaluation here.
7.Effectiveness
Effectiveness, S = (to – ti) / (Ti – ti) = Not significant in evaluation here.
8.LMTD
Calculated considering condensing part only
a) LMTD, Counter Flow =((150 – 30)-(150-95)/ ln ((150-30)/(150-95)) = 83.3 o
C.
b) Correction Factor to account for cross flow
F = 0.95
9.Corrected LMTD
MTD = F x LMTD = 0.95 x 83.3 = 79 o
C.
10. Overall Heat Transfer Co-efficient (HTC)
U = Q/ A ∆T = 1748/ (856 x 79) = 0.026 kW/m2
. K
Bureau of Energy Efficiency 68
14. 4. Energy Performance Assessment of Heat Exchangers
Comparison of Calculated data with Design Data
Parameters Units Test Data Design Data
Duty, Q kW 1748 1800
Hot fluid side pressure drop, ∆Ph Bar Neg Neg
Cold fluid side pressure drop, ∆Pc Bar 20 15
Temperature Range hot fluid, ∆T O
C
Temperature Range cold fluid, ∆t O
C 65 65
Capacity ratio, R -----
Effectiveness, S -----
Corrected LMTD, MTD O
C 79 79
Heat Transfer Coefficient, U kW/(m2
. K) 0.026 0.03
Inferences:
Actual measured
Design profile
L – Distance across the heat
exchanger;
T- Terminal temperatures
L
T
Heat Duty: The difference inferred from the duty as the exchanger is under performing than
required
Pressure drop: The airside pressure drop has increased in spite of condensation at the steam side.
Indication of choking and dirt blocking at the airside.
Temperature range: No deviations
Heat Transfer coefficient: Decreased because of decreased fin efficiency due to choking on air
side.
Trouble shooting:
Operations may be checked to perform pulsejet cleaning with steam / blow air jet on air side if the
facility is available. Mechanical cleaning may have to be planned during any down time in the
immediate future.
Bureau of Energy Efficiency 69
15. 4. Energy Performance Assessment of Heat Exchangers
4.4.3 Instruments for monitoring:
The test and evaluation of the performance of the heat exchanger equipment is carried out
by measurement of operating parameters upstream and downstream of the exchanger.
Due care needs to be taken to ensure the accuracy and correctness of the measured
parameter. The instruments used for measurements require calibration and verification
prior to measurement.
Parameters Units Instruments used
Fluid flow kg/h Flow can be measured with instruments like Orifice
flow meter, Vortex flow meter, Venturi meters,
Coriollis flow meters, Magnetic flow meter as
applicable to the fluid service and flow ranges
Temperature O
C Thermo gauge for low ranges, RTD, etc.
Pressure Bar g Liquid manometers, Draft gauge, Pressure gauges
Bourdon and diaphragm type, Absolute pressure
transmitters, etc.
Density kg/m3
Measured in the Laboratory as per ASTM standards,
hydrometer, etc
Viscosity MpaS Measured in the Laboratory as per ASTM standards,
viscometer, etc.
Specific heat capacity J/(kg.K) Measured in the Laboratory as per ASTM standards
Thermal conductivity W/(m.K) Measured in the Laboratory as per ASTM standards
Composition+
%wt (or) % Vol Measured in the Laboratory as per ASTM standards
using Chemical analysis, HPLC, GC,
Spectrophotometer, etc.
4.4.4 Terminology used in Heat Exchangers
Terminology Definition Unit
Capacity ratio Ratio of the products of mass flow rate and specific heat capacity of the
cold fluid to that of the hot fluid.
Also computed by the ratio of temperature range of the hot fluid to that
of the cold fluid.
Higher the ratio greater will be size of the exchanger
Co current flow
exchanger
An exchanger wherein the fluid flow direction of the cold and hot fluids
are same
Counter flow
exchanger
Exchangers wherein the fluid flow direction of the cold and hot fluids
are opposite. Normally preferred
Cross flow An exchanger wherein the fluid flow direction of the cold and hot fluids
are in cross.
Bureau of Energy Efficiency 70
16. 4. Energy Performance Assessment of Heat Exchangers
Density It is the mass per unit volume of a material kg/m3
Effectiveness Ratio of the cold fluid temperature range to that of the inlet temperature
difference of the hot and cold fluid. Higher the ratio lesser will be
requirement of heat transfer surface.
Fouling The phenomenon of formation and development of scales and deposits
over the heat transfer surface diminishing the heat flux. The process of
fouling will get indicated by the increase in pressure drop
Fouling Factor The reciprocal of heat transfer coefficient of the dirt formed in the heat
exchange process. Higher the factor lesser will be the overall heat
transfer coefficient.
(m2
.K)/W
Heat Duty The capacity of the heat exchanger equipment expressed in terms of
heat transfer rate, viz. magnitude of energy or heat transferred per time.
It means the exchanger is capable of performing at this capacity in the
given system
W
Heat exchanger Refers to the nomenclature of equipment designed and constructed to
transmit heat content (enthalpy or energy) of a comparatively high
temperature hot fluid to a lower temperature cold fluid wherein the
temperature of the hot fluid decreases (or remain constant in case of
losing latent heat of condensation) and the temperature of the cold fluid
increases (or remain constant in case of gaining latent heat of
vaporisation). A heat exchanger will normally provide indirect contact
heating. E.g. A cooling tower cannot be called a heat exchanger where
water is cooled by direct contact with air
Heat Flux The rate of heat transfer per unit surface of a heat exchanger W/ m2
Heat transfer The process of transport of heat energy from a hot source to the
comparatively cold surrounding
Heat transfer
surface or heat
Transfer area
Refers to the surface area of the heat exchanger that provides the
indirect contact between the hot and cold fluid in effecting the heat
transfer. Thus the heat transfer area is defined as the surface having both
sides wetted with one side by the hot fluid and the other side by the cold
fluid providing indirect contact for heat transfer
m2
Individual Heat
transfer Coefficient
The heat flux per unit temperature difference across boundary layer of
the hot / cold fluid film formed at the heat transfer surface. The
magnitude of heat transfer coefficient indicates the ability of heat
conductivity of the given fluid. It increases with increase in density,
velocity, specific heat, geometry of the film forming surface
W/( m2
.K)
LMTD Correction
factor
Calculated considering the Capacity and effectiveness of a heat
exchanging process. When multiplied with LMTD gives the corrected
LMTD thus accounting for the temperature driving force for the cross
flow pattern as applicable inside the exchanger
Logarithmic Mean
Temperature
difference, LMTD
The logarithmic average of the terminal temperature approaches across
a heat exchanger
o
C
Bureau of Energy Efficiency 71
17. 4. Energy Performance Assessment of Heat Exchangers
Overall Heat
transfer
Coefficient
The ratio of heat flux per unit difference in approach across
a heat exchange equipment considering the individual
coefficient and heat exchanger metal surface conductivity.
The magnitude indicates the ability of heat transfer for a
given surface. Higher the coefficient lesser will be the heat
transfer surface requirement
W/(m2
.K)
Pressure drop The difference in pressure between the inlet and outlet of a
heat exchanger
Bar
Specific heat
capacity
The heat content per unit weight of any material per degree
raise/fall in temperature
J/(kg.K)
Temperature
Approach
The difference in the temperature between the hot and cold
fluids at the inlet / outlet of the heat exchanger. The greater
the difference greater will be heat transfer flux
o
C
Temperature
Range
The difference in the temperature between the inlet and
outlet of a hot/cold fluid in a heat exchanger
o
C
Terminal
temperature
The temperatures at the inlet / outlet of the hot / cold fluid
steams across a heat exchanger.
o
C
Thermal
Conductivity
The rate of heat transfer by conduction though any
substance across a distance per unit temperature difference
W/(m2
.K)
Viscosity The force on unit volume of any material that will cause per
velocity
Pa
Bureau of Energy Efficiency 72
18. 4. Energy Performance Assessment of Heat Exchangers
QUESTIONS
1. What is meant by LMTD ?
2. Distinguish between heat exchanger efficiency and effectiveness.
3. Explain the terms heat duty and capacity ratio.
4. What is meant by fouling?
5. List five heat exchangers used in industrial practice.
6. What are the parameters, which are to be monitored for the performance
assessment of heat exchangers?
7. In a heat exchanger the hot stream enters at 70O
C and leaves at 55O
C. On
the other side the cold stream enters at 30O
C and leaves at 55O
C. Find out
the LMTD of the heat exchanger.
8. In a condenser what type of heats are considered in estimating the heat
duty?
a) Latent Heat b) Sensible heat c) Specific heat d) Latent heat and sensible
heat
9. What is the need for performance assessment of a heat exchanger?
10. The unit of overall coefficient of heat transfer is
a) kCal/hr/m2 o
C b) kCal/kg o
C c) kCal/m2
hr d) kCal/hg m2
REFERENCES
1. “Process Heat Transfer” by D.Q.Kern, Edn. 1965.
2. “Modern Power Station Practice” – British Electricity International- Volume – G;
Chapter – 7 – “ Plant performance and performance monitoring.
3. Coulsons & Richardson’s CHEMICAL ENGINEERING Volume 3 third edition
4. Scimod “ Scientific Modeling Software”, techno software International, India
5. Ganapathy. V, “Fouling factor estimated quickly”, O&G Journal, Aug 1992.
6. Liberman, Norman P, Trouble shooting Process Operations, Penwell Books,
Tulsa, Oklahoma
Bureau of Energy Efficiency 73