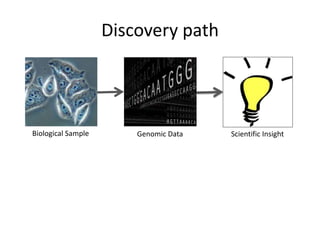
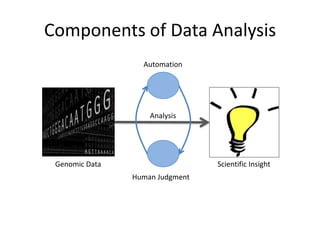
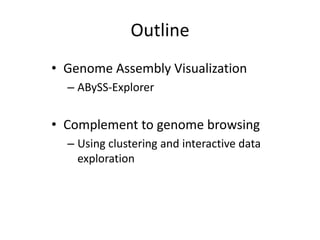
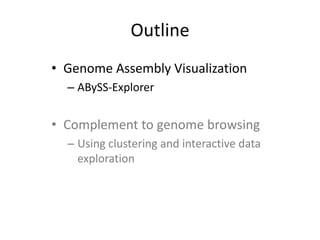
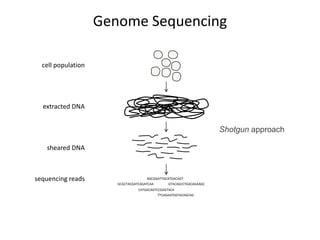
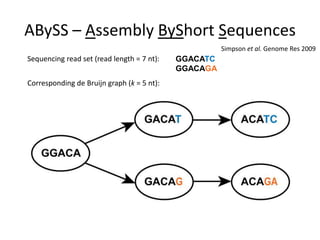
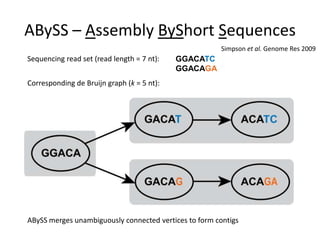
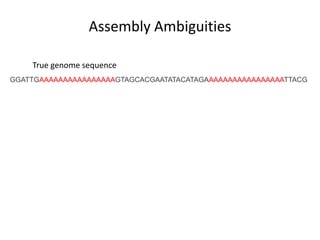
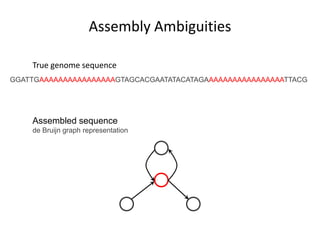
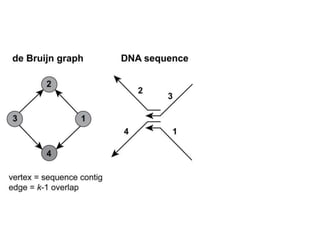
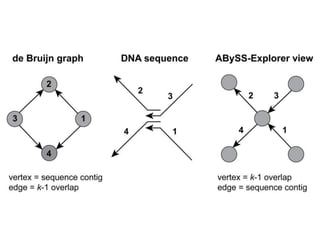
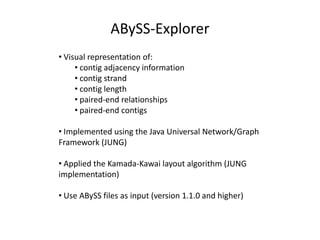
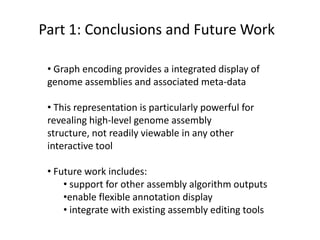
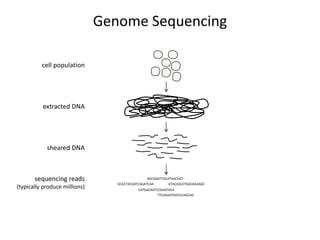
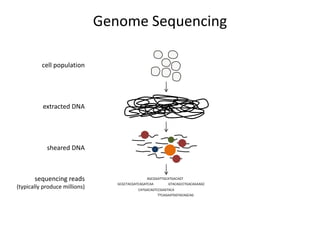
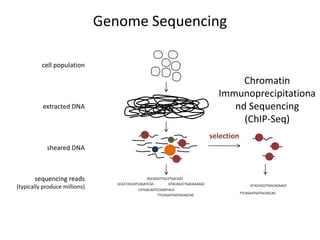
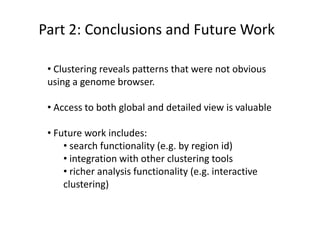
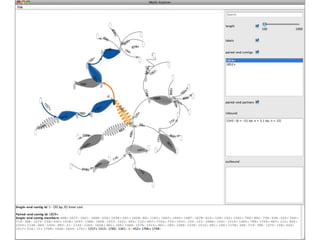
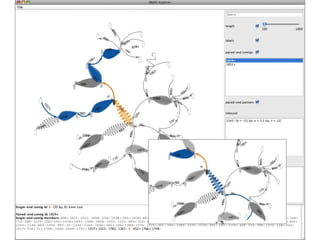
British Columbia Cancer AgencyGenome Sciences CentreVancouver . British Columbia . CanadaComplementing Computation with Visualization in GenomicsMarch 11, 2010EBI Interfaces Interest ForumCydney Nielsen
Discovery pathBiological SampleGenomic DataScientific Insight
Components of Data AnalysisAutomationAnalysisGenomic DataScientific InsightHuman Judgment
OutlineGenome Assembly VisualizationABySS-ExplorerComplement to genome browsing Using clustering and interactive data exploration
Genome Sequencingcell populationextracted DNAShotgun approachsheared DNAsequencing readsAGCGGATTGCATGACAGTGTACAGCCTGACAGAAGCGCGCTACGATCAGATCAACATGACAGTCCGAGTACATTCAGAATGGTACAGCAG
ABySS – Assembly ByShort SequencesSimpson et al. Genome Res 2009Sequencing read set (read length = 7 nt):GGACATCGGACAGACorresponding de Bruijn graph (k = 5 nt):
ABySS – Assembly ByShort SequencesSimpson et al. Genome Res 2009Sequencing read set (read length = 7 nt):GGACATCGGACAGACorresponding de Bruijn graph (k = 5 nt):ABySS merges unambiguously connected vertices to form contigs
Assembly AmbiguitiesTrue genome sequenceGGATTGAAAAAAAAAAAAAAAAGTAGCACGAATATACATAGAAAAAAAAAAAAAAAAATTACG
Assembly AmbiguitiesTrue genome sequenceGGATTGAAAAAAAAAAAAAAAAGTAGCACGAATATACATAGAAAAAAAAAAAAAAAAATTACGAssembled sequence de Bruijn graph representation
Starting PointShaun Jackman
Example of existing tools: Consed
Properties of DNA
Capture sequence strandAAAAAT2+1+
Capture sequence strandAAAAAT2+1+TTTTTA2-1-
Capture sequence strandAAAAAT1+2+TTTTTA
Capture sequence strandAAAAAT1-2-TTTTTA
Capture sequence lengthone oscillation = 100 nt
Genome Sequencingcell populationextracted DNAread pair informationreadsheared DNAdsDNAfragment(known size)sequencing reads(typically produce millions)AGCGGATTGCATGACAGTreadGTACAGCCTGACAGAAGCGCGCTACGATCAGATCAACATGACAGTCCGAGTACATTCAGAATGGTACAGCAG
Capture read pair informationAfter building the initial single-end (SE) contigs from k-mer sequences, ABySS uses paired-end reads to resolve ambiguities.
Capture read pair informationPaired end read information is used the construct paired end (PE) contigs… 13+  44-  46+  4+  79+  70+ …blue gradient = paired end contigorange = selected single end contig
ABySS-Explorer Visual representation of:
 contig adjacency information
 contig strand
 contig length
 paired-end relationships
 paired-end contigs
 Implemented using the Java Universal Network/Graph Framework (JUNG)
 Applied the Kamada-Kawai layout algorithm (JUNG implementation)
 Use ABySS files as input (version 1.1.0 and higher)
http://www.bcgsc.ca/platform/bioinfo/software/abyss-explorer
Part 1: Conclusions and Future Work Graph encoding provides a integrated display of genome assemblies and associated meta-data
 This representation is particularly powerful for revealing high-level genome assembly structure, not readily viewable in any other interactive tool
 Future work includes:
 support for other assembly algorithm outputs
enable flexible annotation display
 integrate with existing assembly editing toolsOutlineGenome Assembly VisualizationABySS-ExplorerComplement to genome browsing Using clustering and interactive data exploration
Genome Sequencingcell populationextracted DNAsheared DNAsequencing reads(typically produce millions)AGCGGATTGCATGACAGTGTACAGCCTGACAGAAGCGCGCTACGATCAGATCAACATGACAGTCCGAGTACATTCAGAATGGTACAGCAG
Genome Sequencingcell populationChromatin Immunoprecipitationand Sequencing (ChIP-Seq)extracted DNAselectionsheared DNAsequencing reads(typically produce millions)AGCGGATTGCATGACAGTGTACAGCCTGACAGAAGCGCGCTACGATCAGATCAAGTACAGCCTGACAGAAGCCATGACAGTCCGAGTACATTCAGAATGGTACAGCAGTTCAGAATGGTACAGCAG
Align sequences to the genomeCCGAGTACAGCCTGACAGAGCATGACAGTCCGAGTACTTGCATGACAGTCCGAGTAGCGGATTGCATGACAGTAGCGGATTGCATGACAGTAGCGGATTGCATGACAGTReference GenomeAGCGGATTGCATGACAGTCCGAGTACAGCCTGACAGARead coverageGenomic coordinate
Genome browser can reveal local patternsH3K4me3H3K36me3H3K27me3H3K9me3H3K9AcMRE
Difficult to get global overview
Focus on regions of interest1. For example, transcriptional start sites (TSS +/- 3000 nt)H3K4me3H3K9AcH3K4me1H3K36me3MeDIPMRE2. Extract data matricesNormalization for bin i, sample h:3. Cluster matrices (k-means clustering with Euclidean distance)

Complementing Computation with Visualization in Genomics