Download as PDF, PPTX


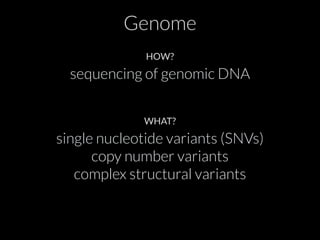
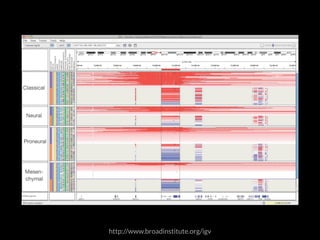
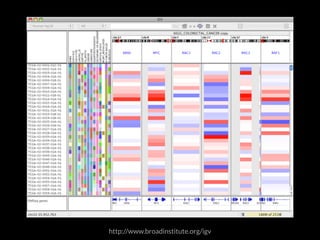
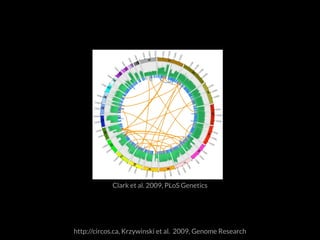
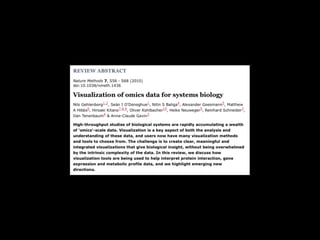
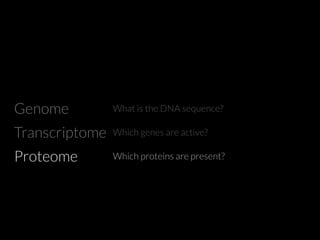
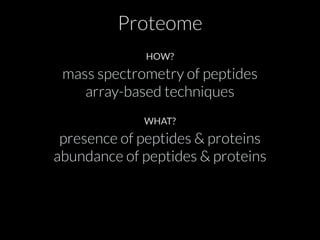
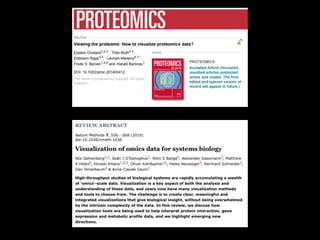
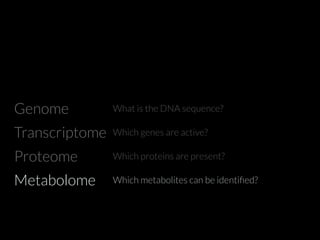
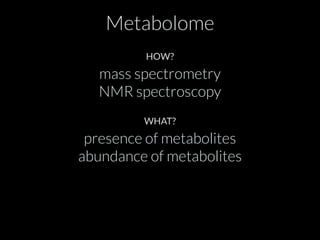
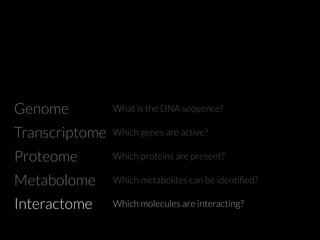
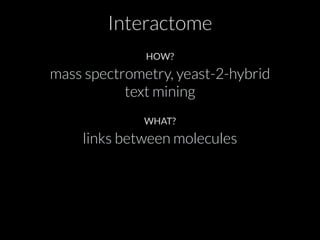
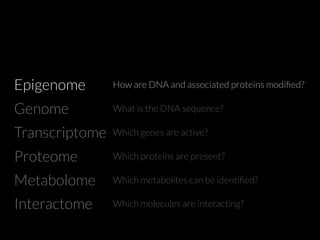
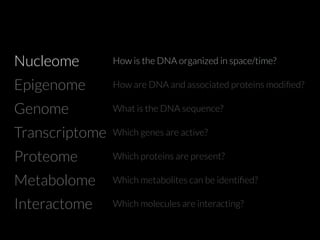


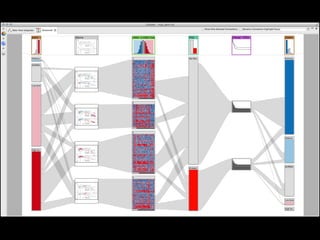
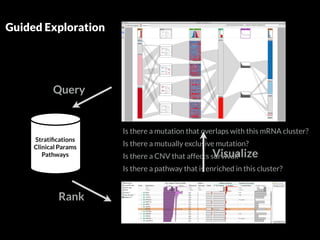


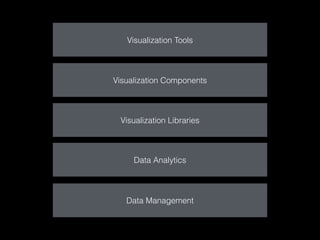
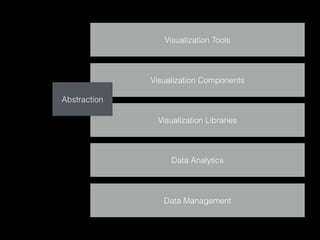
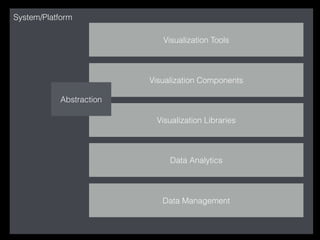


The document discusses various visualization approaches for analyzing biomedical omics data, including genome, transcriptome, proteome, metabolome, and interactome. It emphasizes the importance of integrating different types of data for better insights into biological processes and clinical implications. The document also highlights the need for building infrastructure and tools for effective data visualization and management in biomedical research.


![[DSC Europe 23][DigiHealth] Vesna Pajic - Machine Learning Techniques for omi...](https://cdn.slidesharecdn.com/ss_thumbnails/dxgiw6wysauhxm3dnays-vesna-pajic-machine-learning-techniques-for-omics-data-analysis-231130112724-c1268146-thumbnail.jpg?width=640&height=640&fit=bounds)


![Polymer [ बहुलक ] Chemistry Notes PDF - Irfanullah Mehar - JJ Sir Chemistry.pdf](https://cdn.slidesharecdn.com/ss_thumbnails/polymerchemistrynotespdf-irfanullahmehar-jjsirchemistry-260210172118-3f9b37f7-thumbnail.jpg?width=640&height=640&fit=bounds)


