Spectrophometry as aTool in
Clinical Biochemistry
Gideon Adotey & Abraham Quarcoo
Science Laboratory Technology
Department
Accra Technical University
2.
Learning Objectives
1. Generaloverview of spectrophotometry
2. Basic components of spectrophotometer
3. Spectrophotometric measurement & Beer’s Law
4. Operation of a spectrophotometer & standard curve
generation
5. Determination of concentration using a standard curve
6. Sources of Error in Beer’s Law Measurements
3.
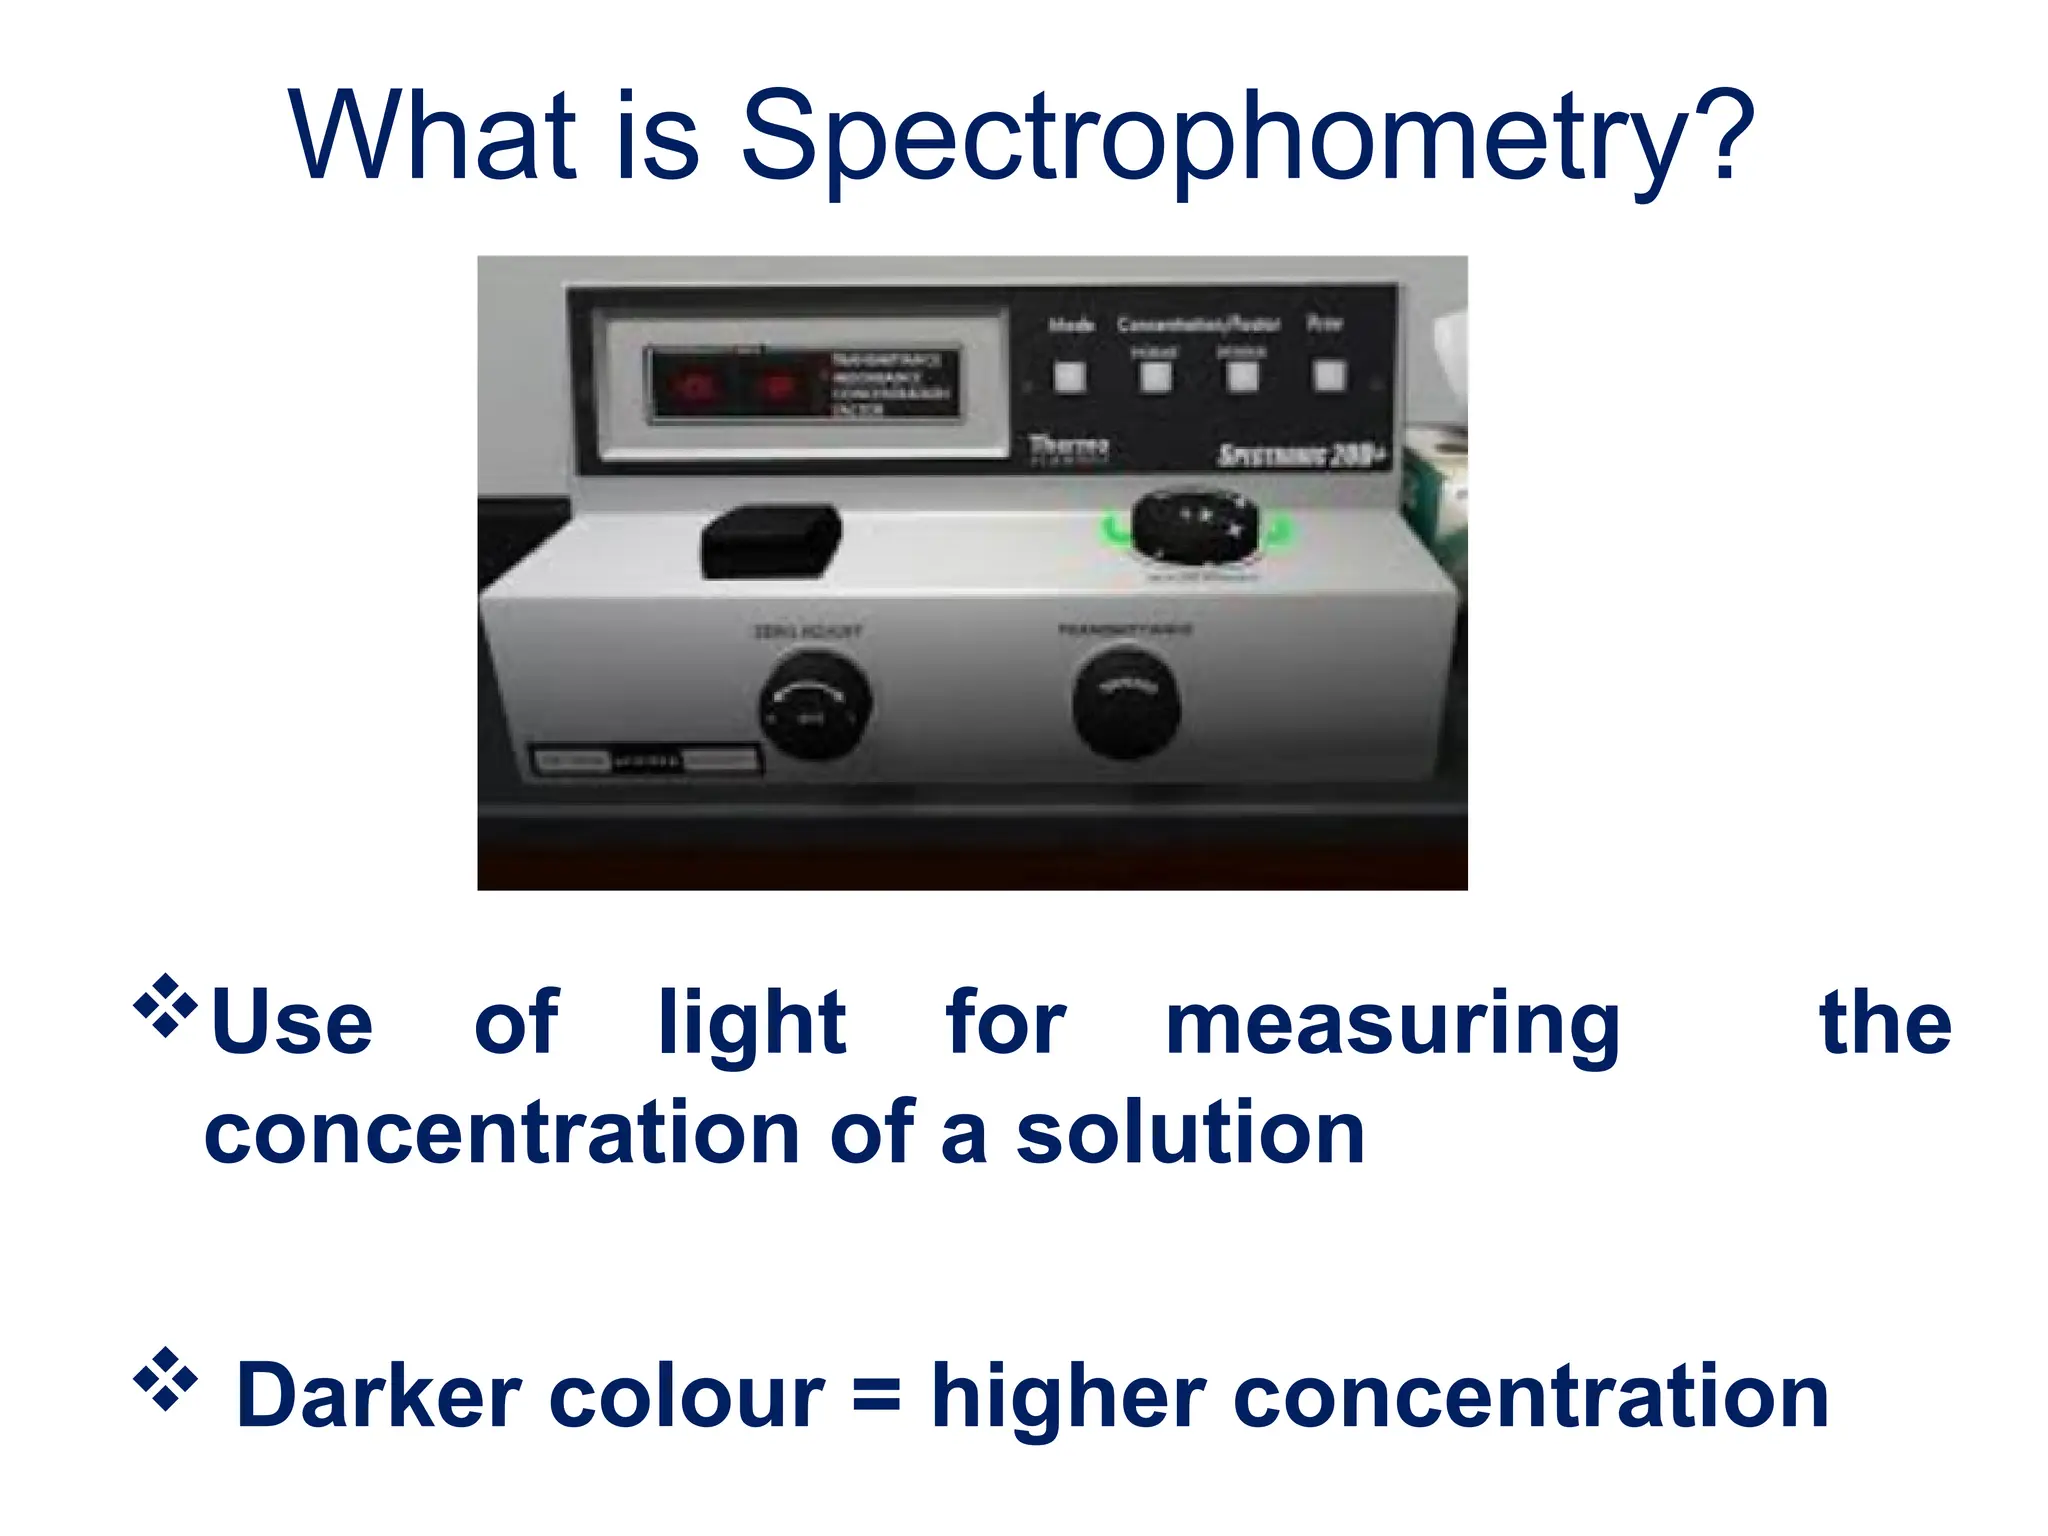
What is Spectrophometry?
Useof light for measuring the
concentration of a solution
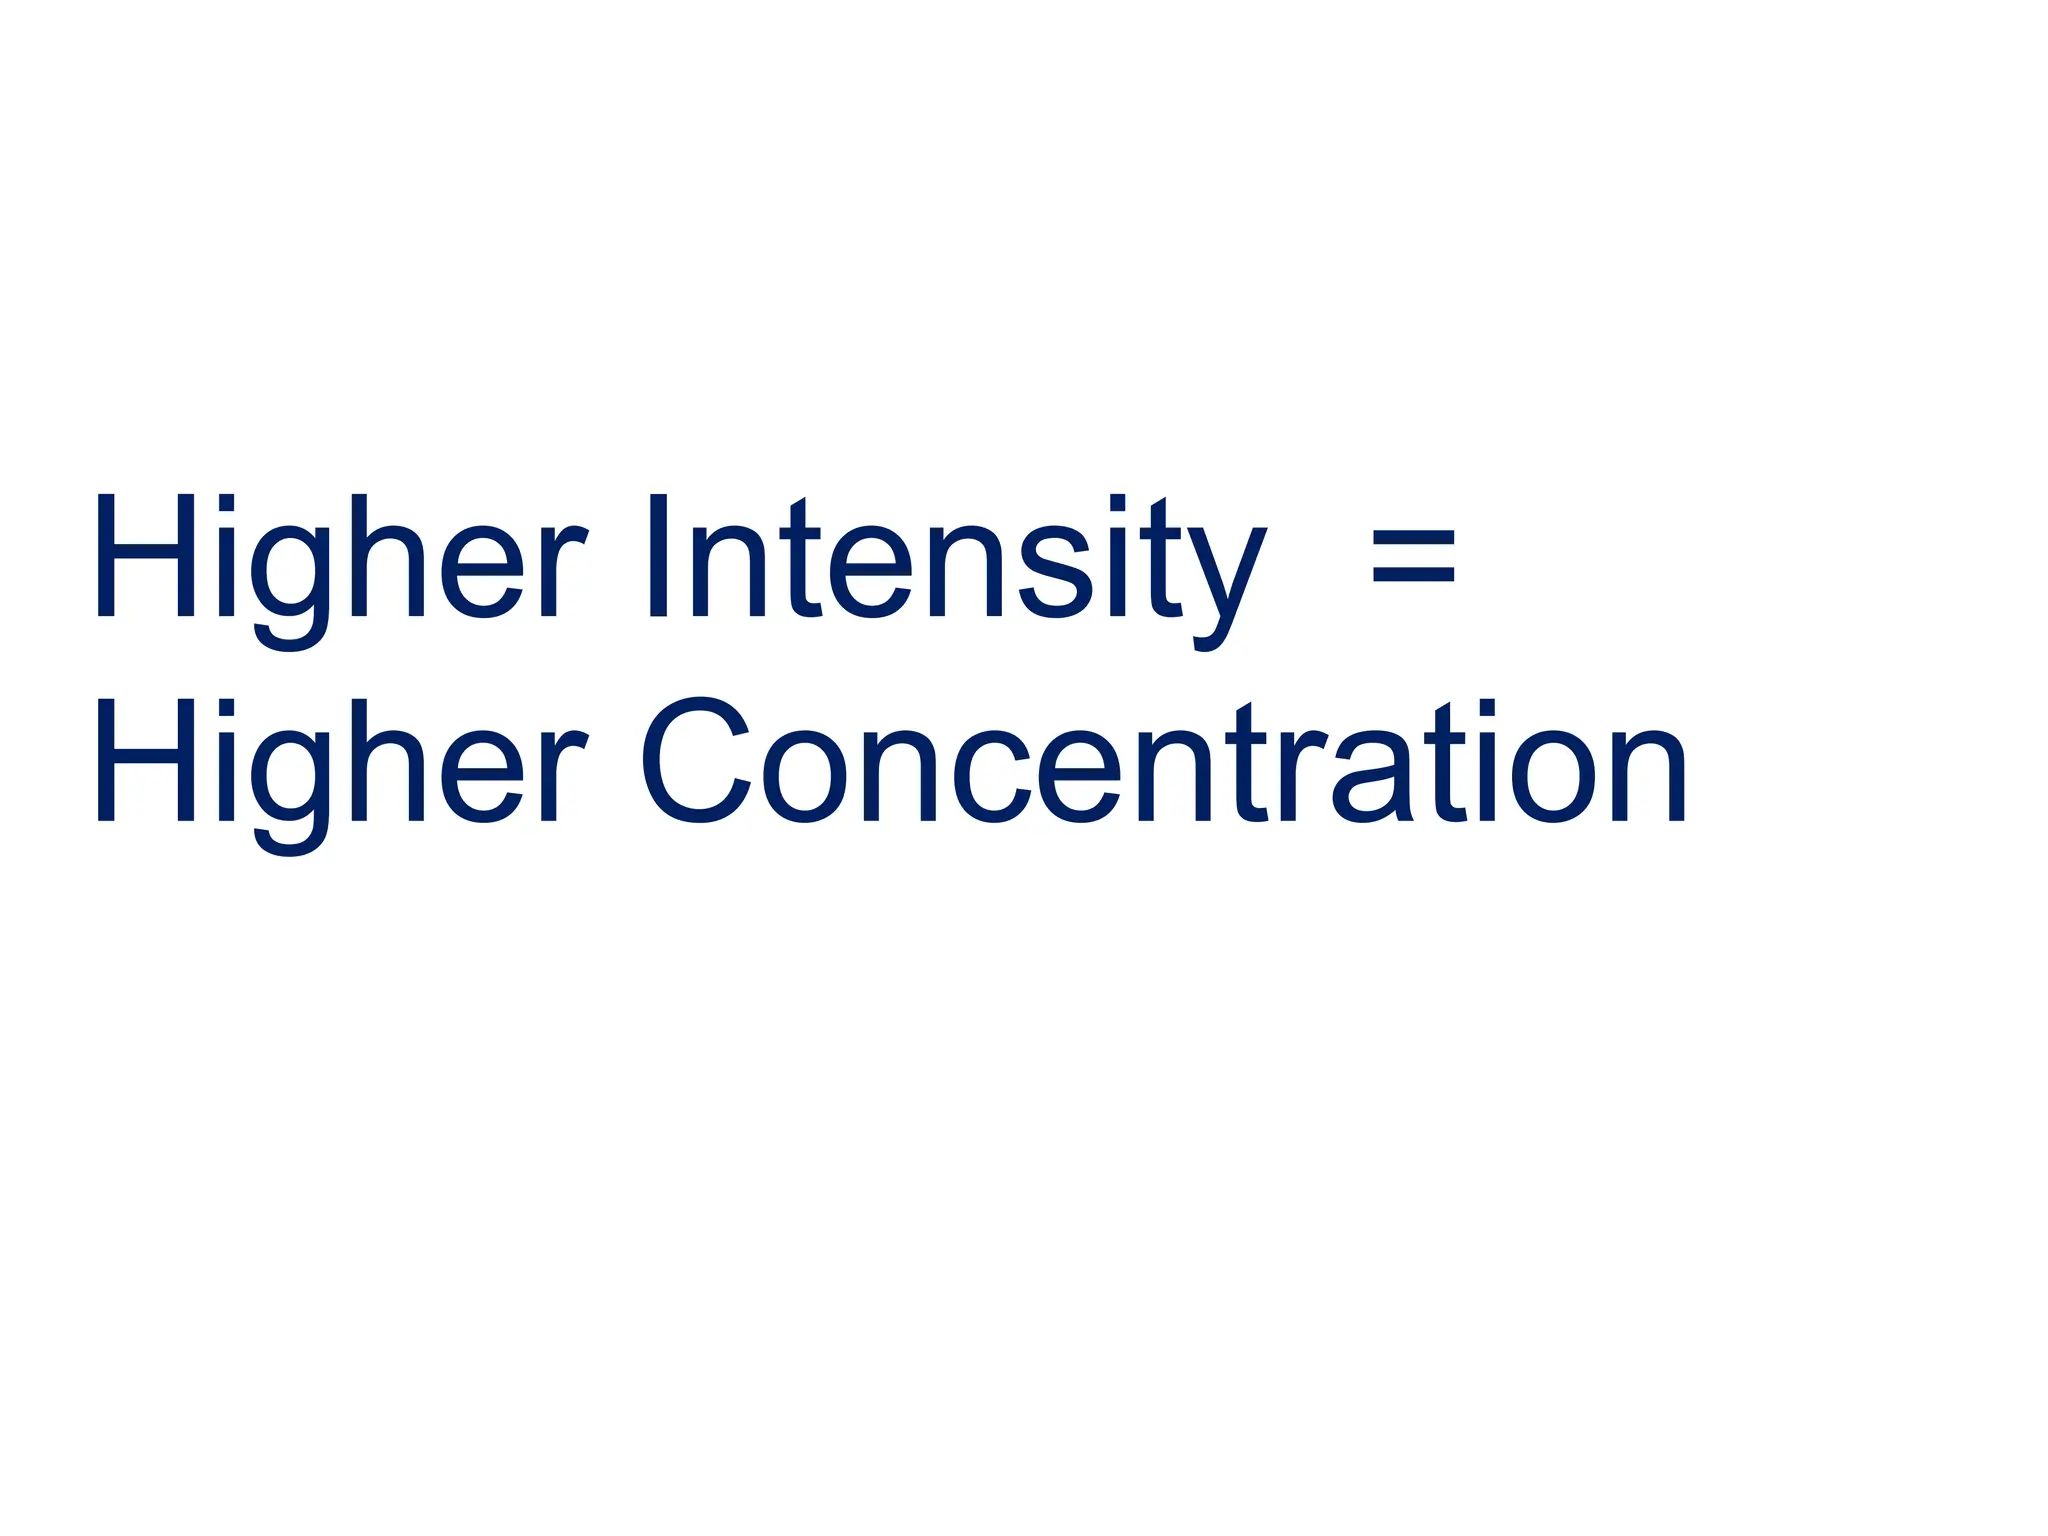
Darker colour = higher concentration
4.
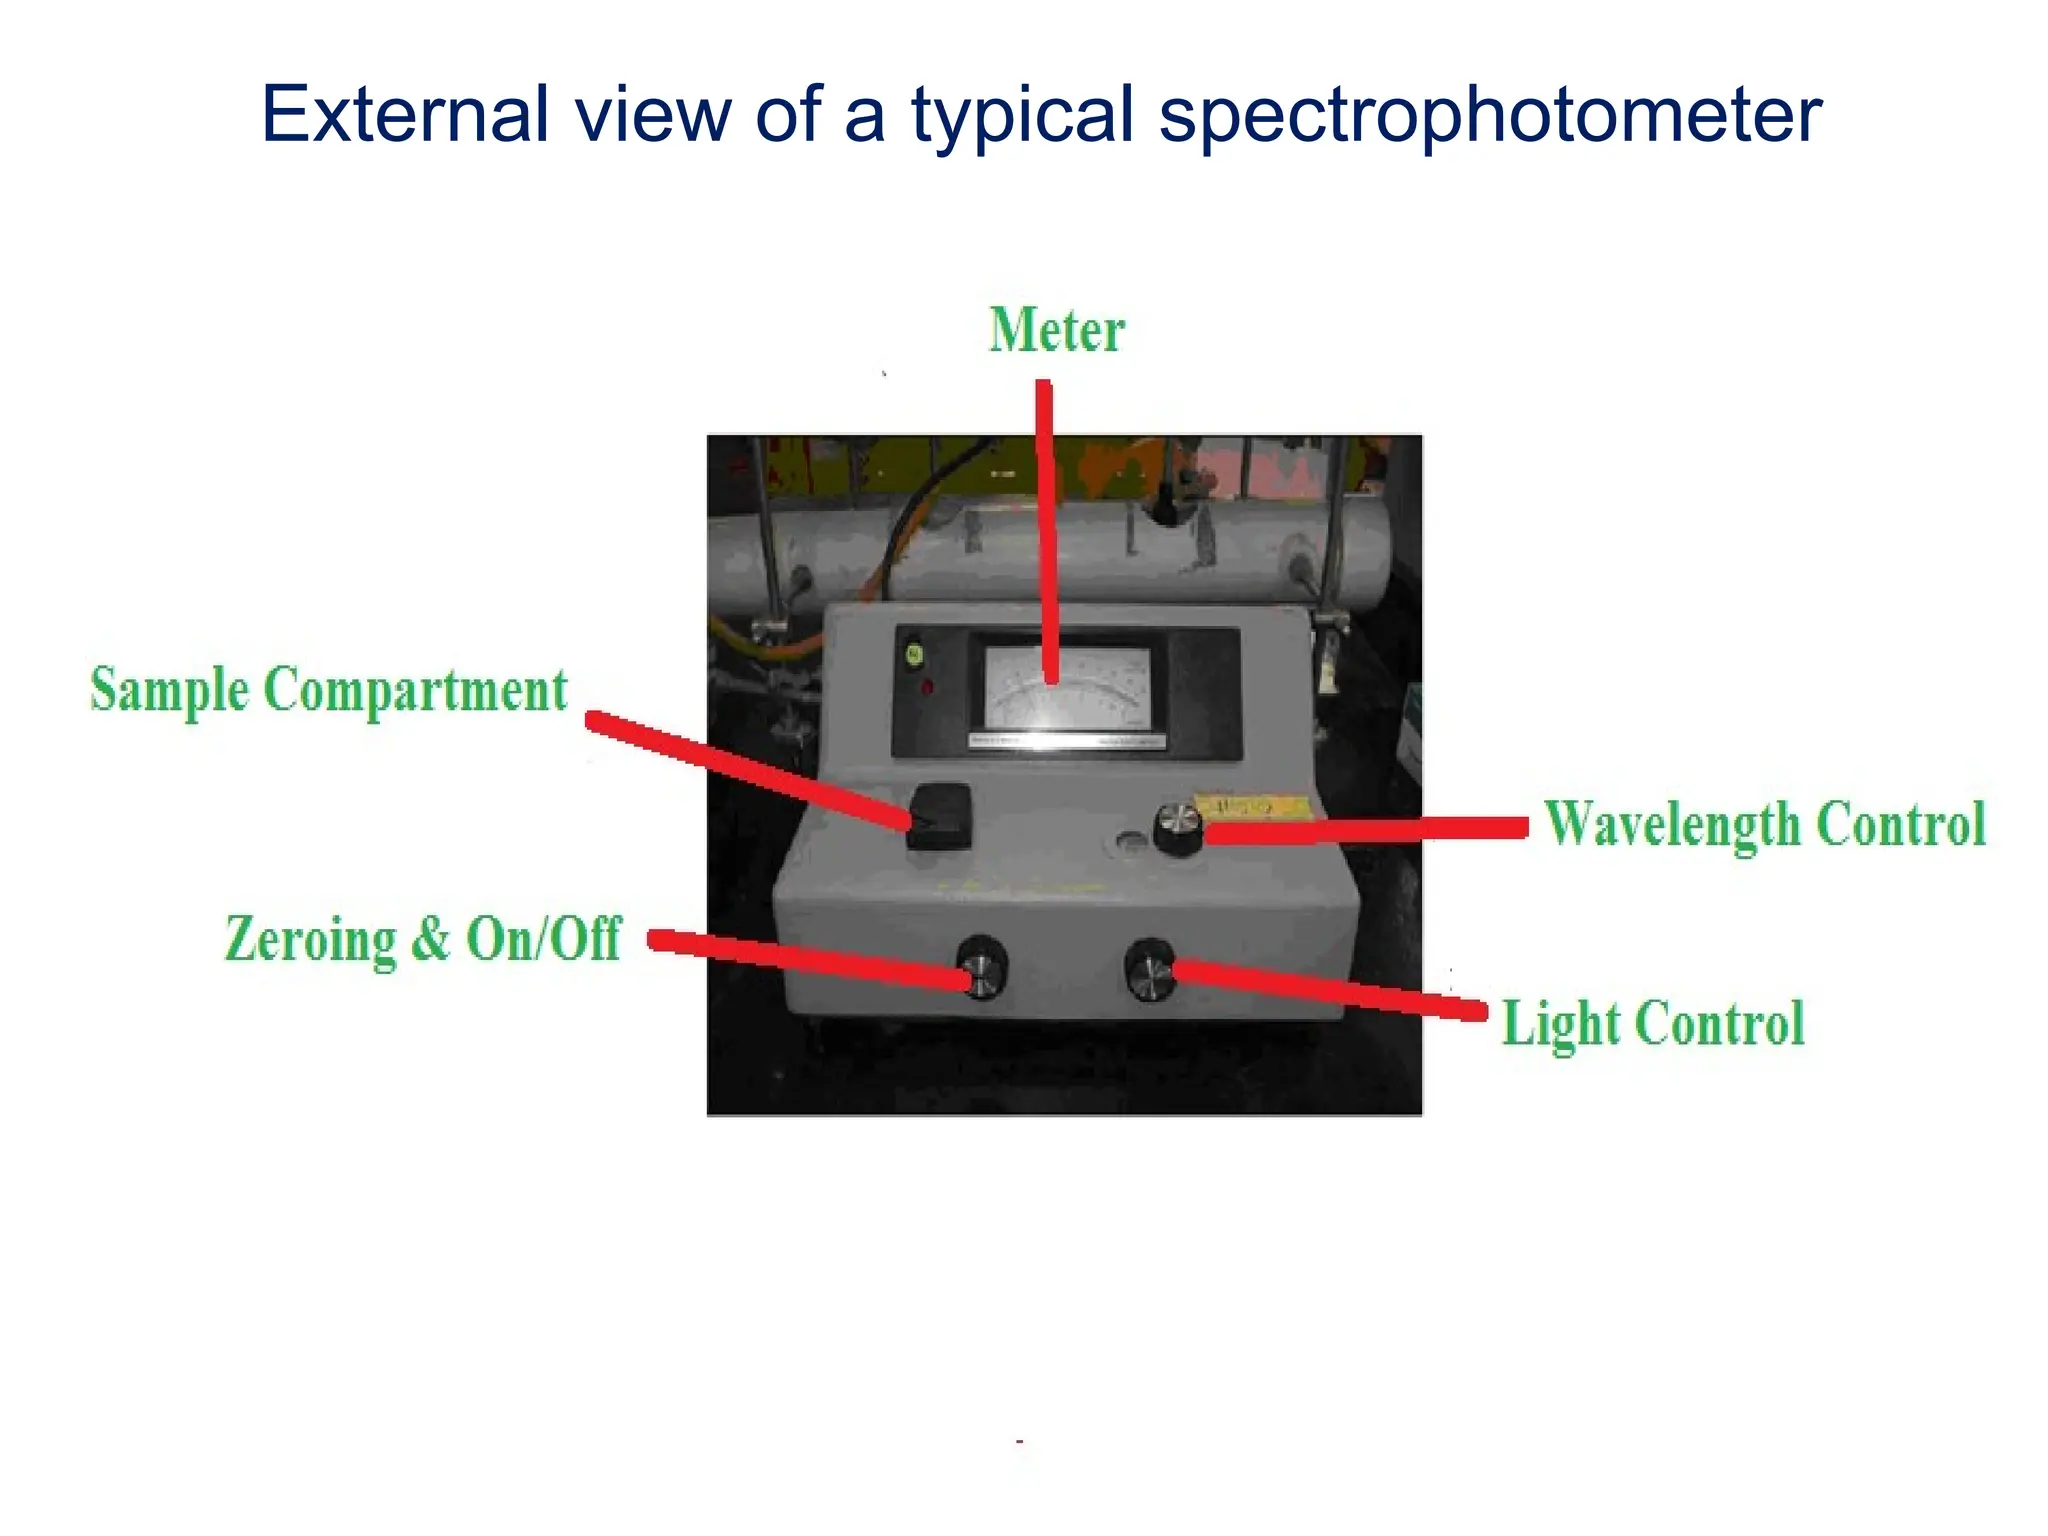
Spectrophotometer
Instrument for measuring
intensityof light
Consists of two major
components
Spectrometer for
producing light of any selected
color (wavelength)
Photometer for measuring
intensity of light produced
by the spectrometer
5.
Spectrometer Portion
I. Lightsource
II. Focusing lens
III. Diffraction grating to split light into
different wavelengths.
6.
Photometer Portion
IV. Photosensitivedetector which measures the light
passing through the sample
V. Amplifier
VI. Output device such as a meter or recorder
VII. Sample Holder
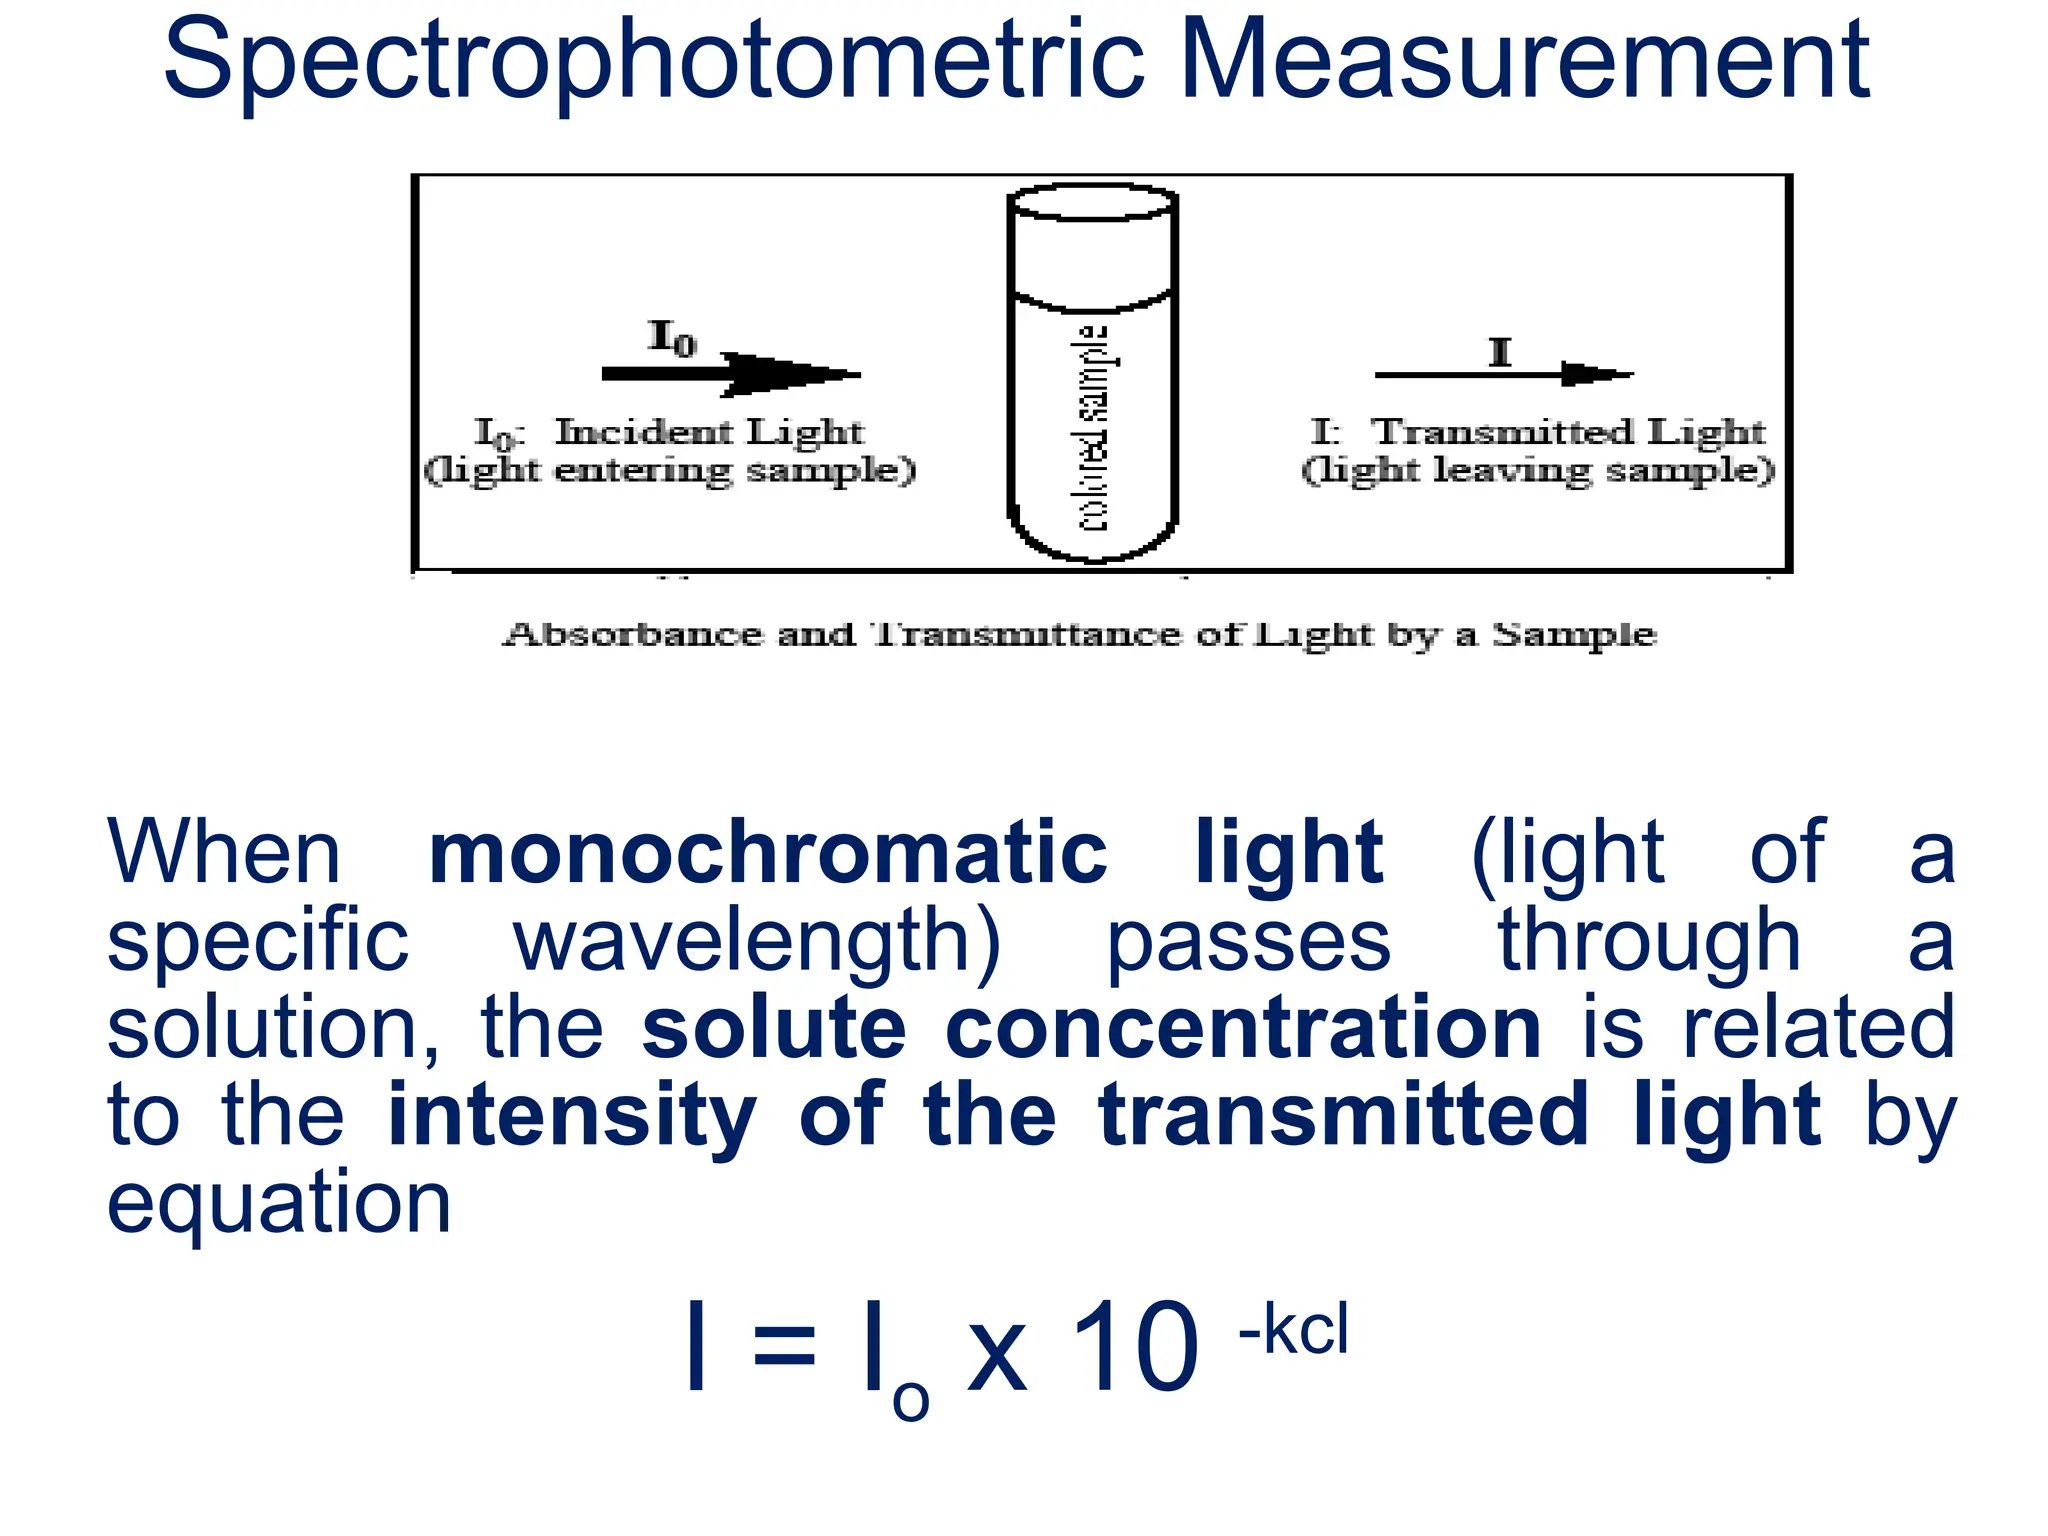
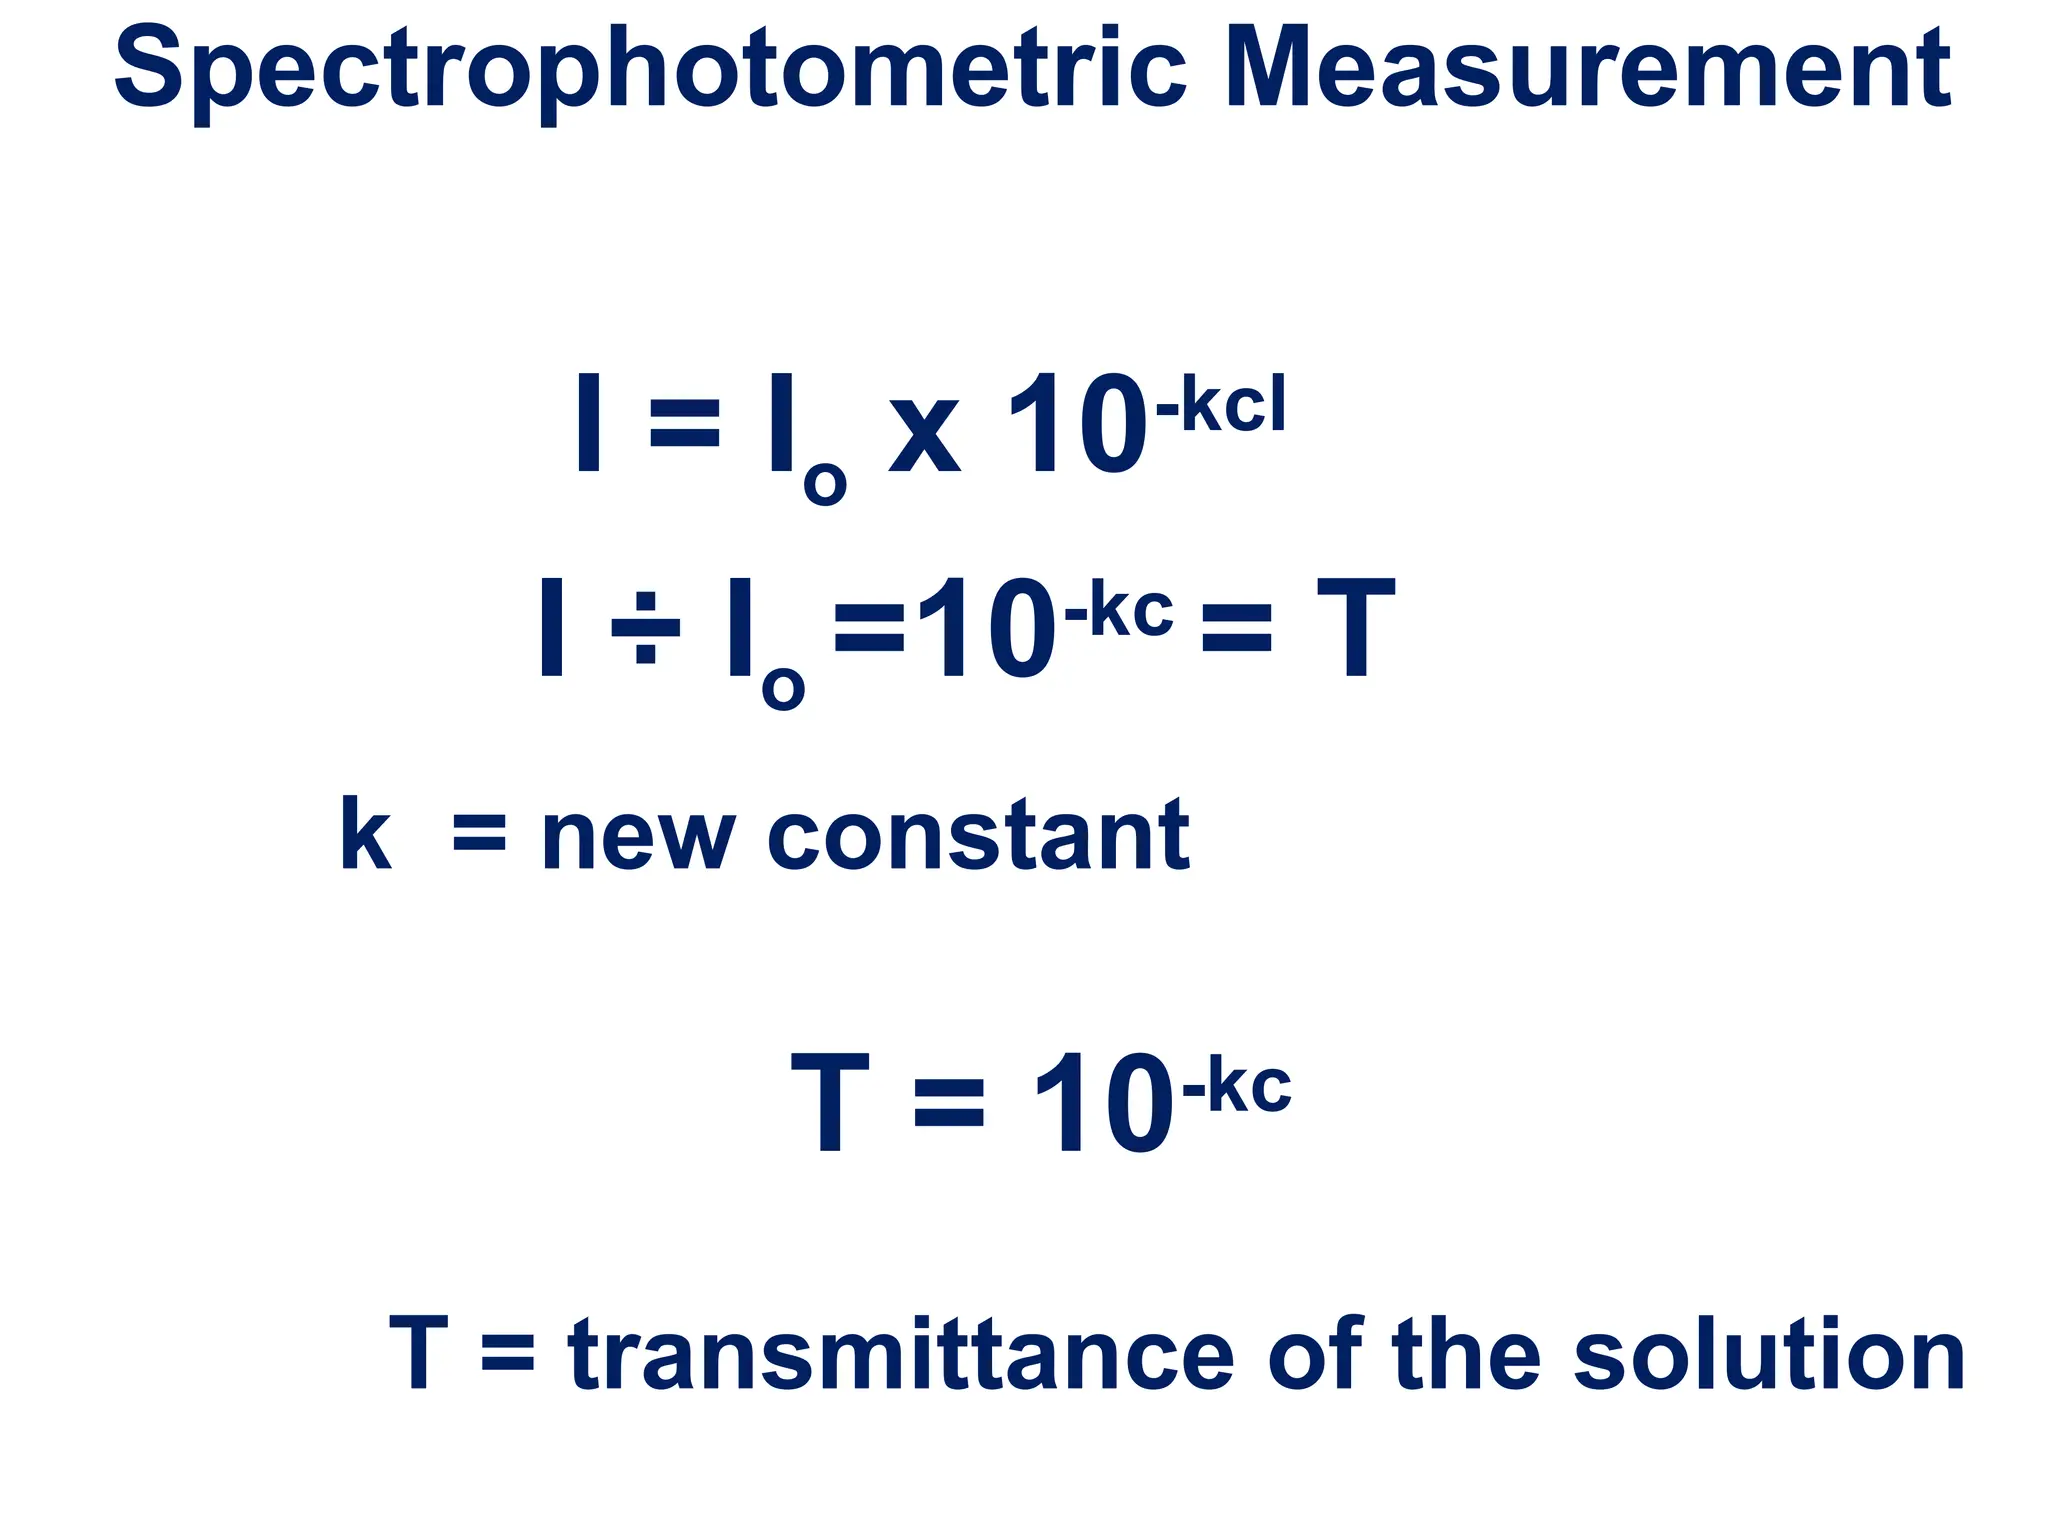
Spectrophotometric Measurement
When monochromaticlight (light of a
specific wavelength) passes through a
solution, the solute concentration is related
to the intensity of the transmitted light by
equation
I = Io x 10 -kcl
The Optical density(O.D) or Absorbance
(A) of a coloured solution is directly
proportional to the concentration by the
equation
-log T = log1/T = kc = (OD)
Absorbance Vrs Conc.
Absorbance and PercentTransmittance
Most spectrophotometers read both O.D.
(absorbance) unit, which is a logarithmic scale, and
in % transmittance, which is an arithmetic scale.
Absorbance and percent transmittance increase or
decrease in OPPOSITE DIRECTIONS.
Absorbance scale is the most useful for
spectrophotometric assays.
15.
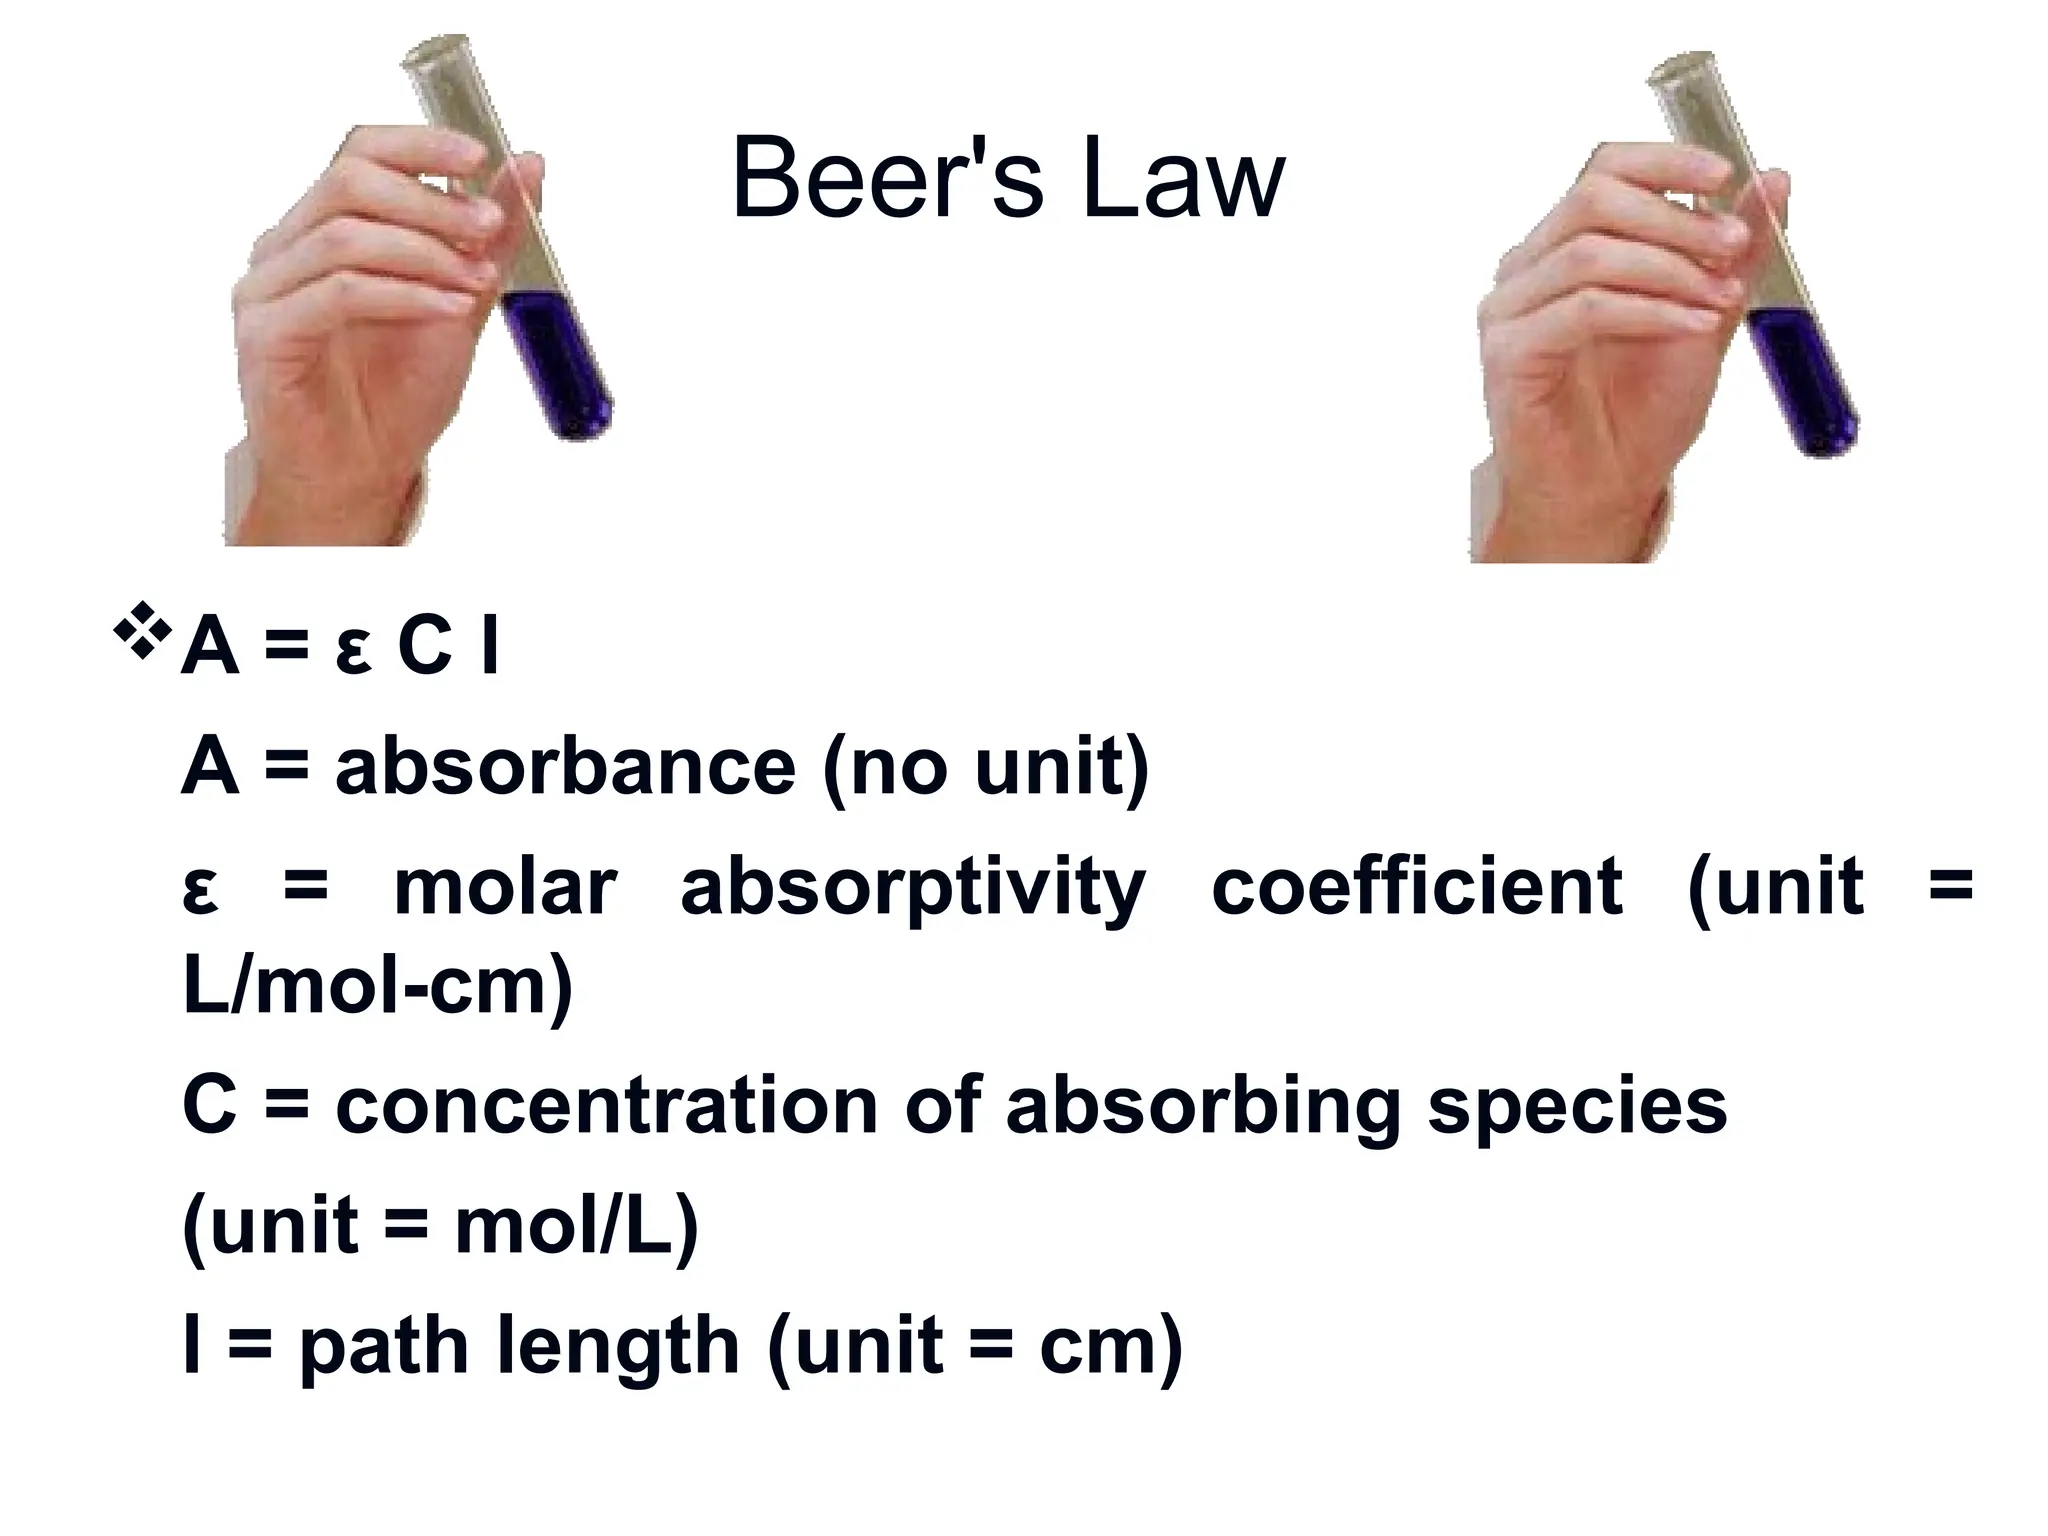
Beer's Law
For verydilute solutions, the amount
of light absorbed at a specific
wavelength is directly proportional to
the concentration of the solution.
This relationship is called Beer's Law
16.
Beer's Law
A =ε C l
A = absorbance (no unit)
ε = molar absorptivity coefficient (unit =
L/mol-cm)
C = concentration of absorbing species
(unit = mol/L)
l = path length (unit = cm)
17.
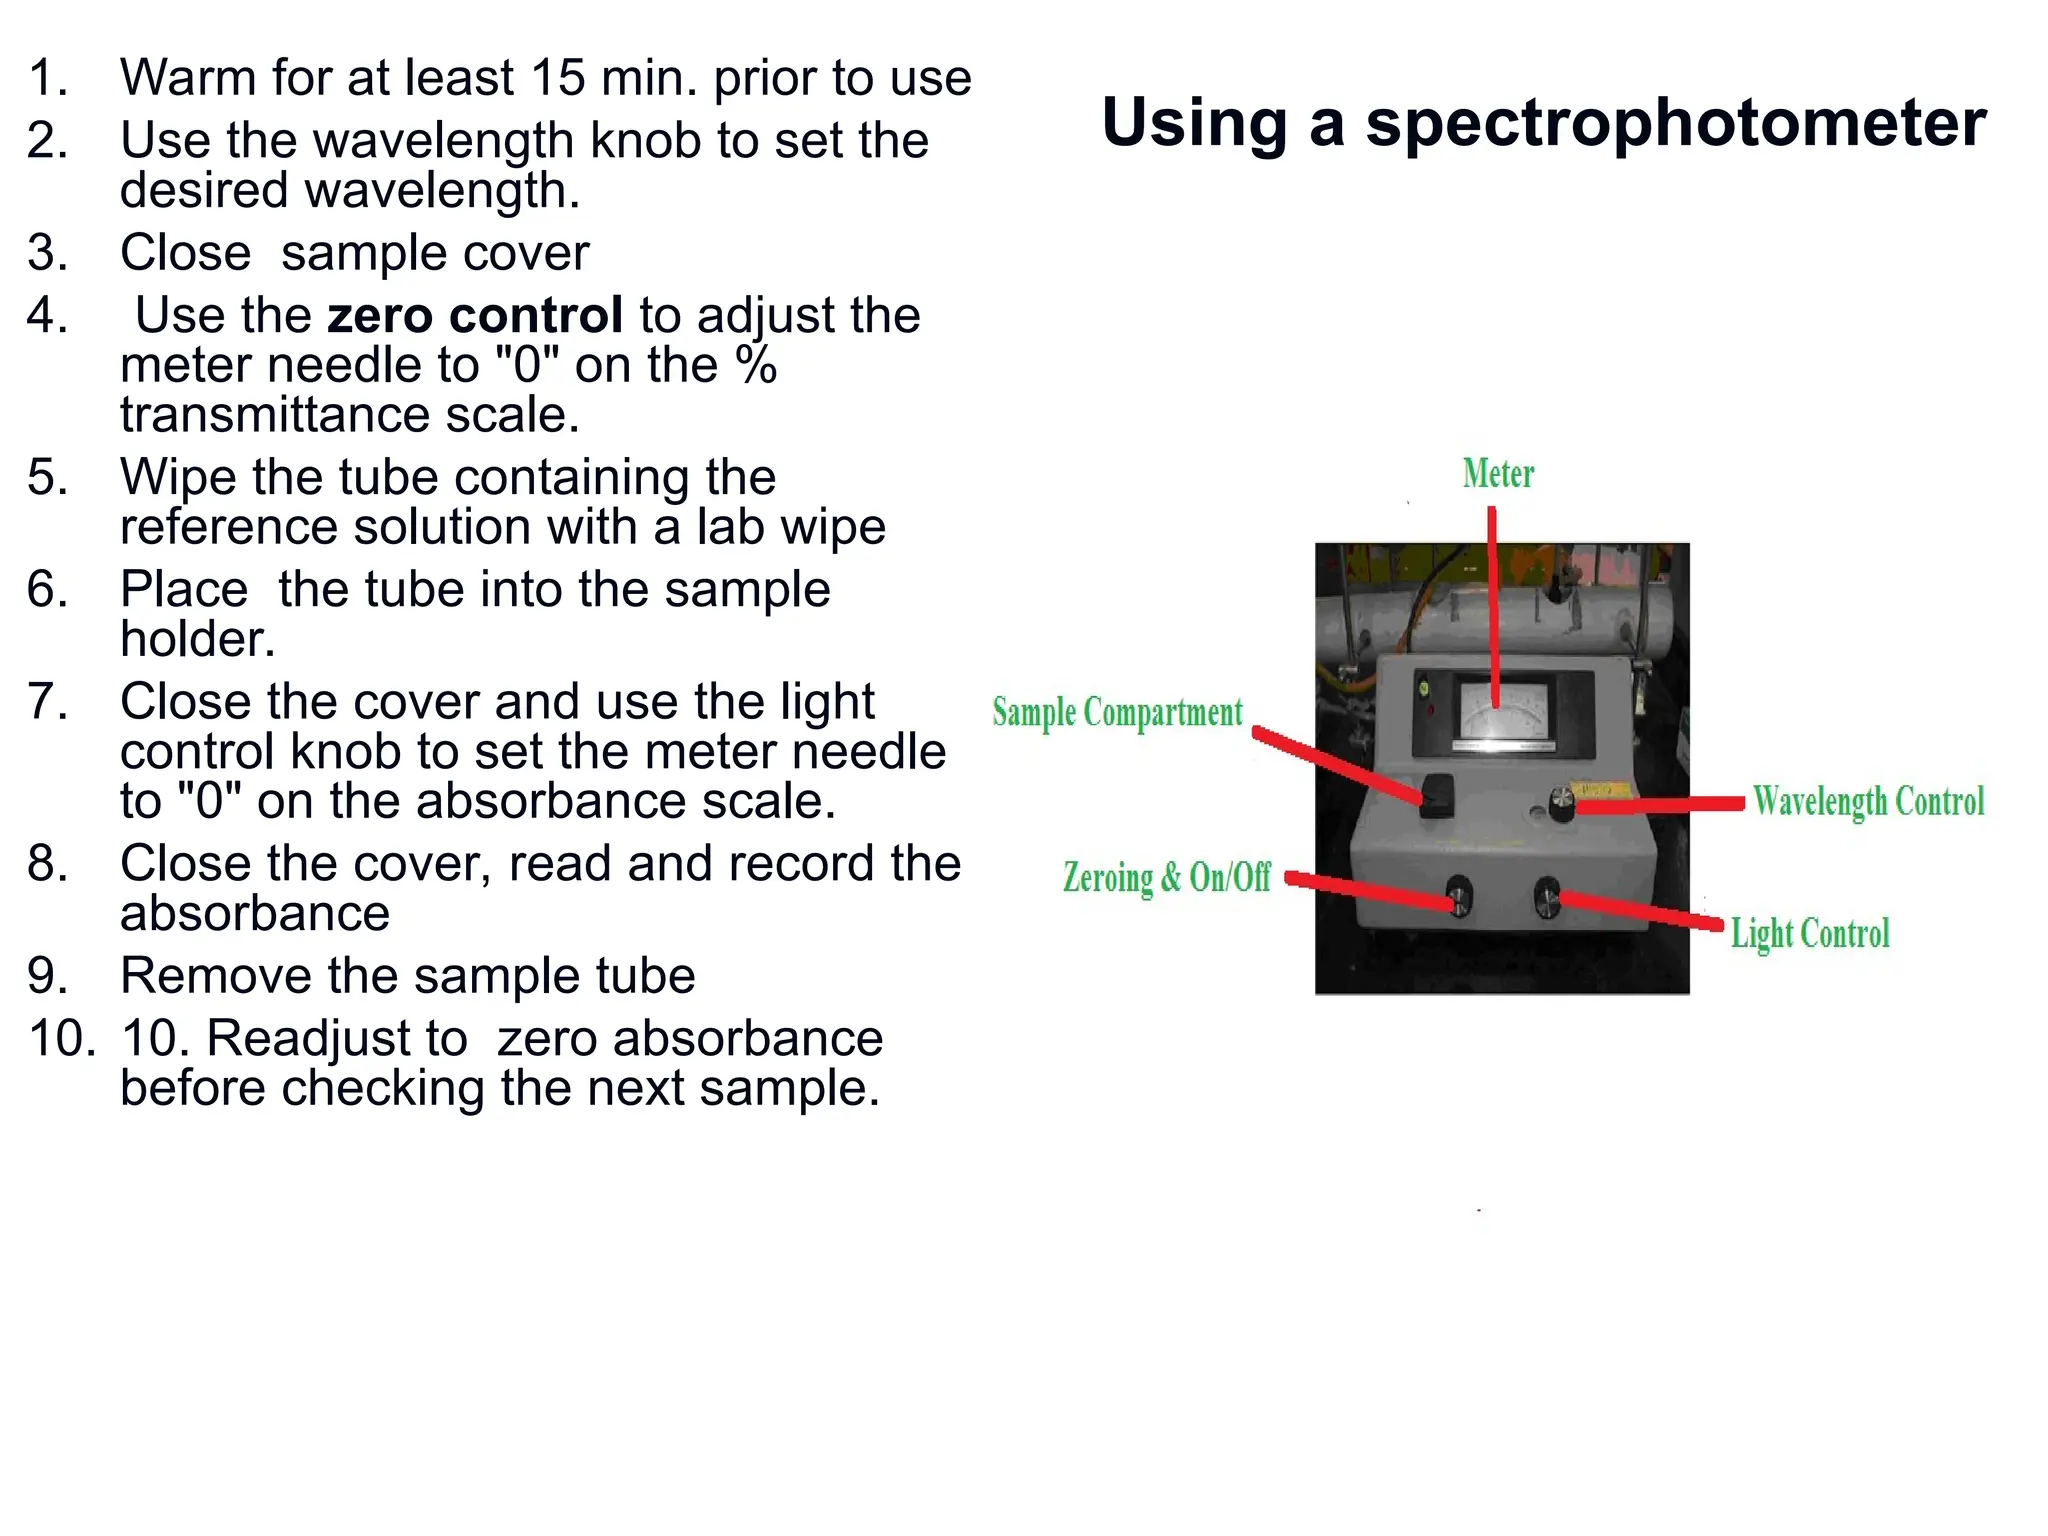
Using a spectrophotometer
1.Warm for at least 15 min. prior to use
2. Use the wavelength knob to set the
desired wavelength.
3. Close sample cover
4. Use the zero control to adjust the
meter needle to "0" on the %
transmittance scale.
5. Wipe the tube containing the
reference solution with a lab wipe
6. Place the tube into the sample
holder.
7. Close the cover and use the light
control knob to set the meter needle
to "0" on the absorbance scale.
8. Close the cover, read and record the
absorbance
9. Remove the sample tube
10. 10. Readjust to zero absorbance
before checking the next sample.
Use the warm-uptime to prepare samples
Turn on spectrophotometer
21.
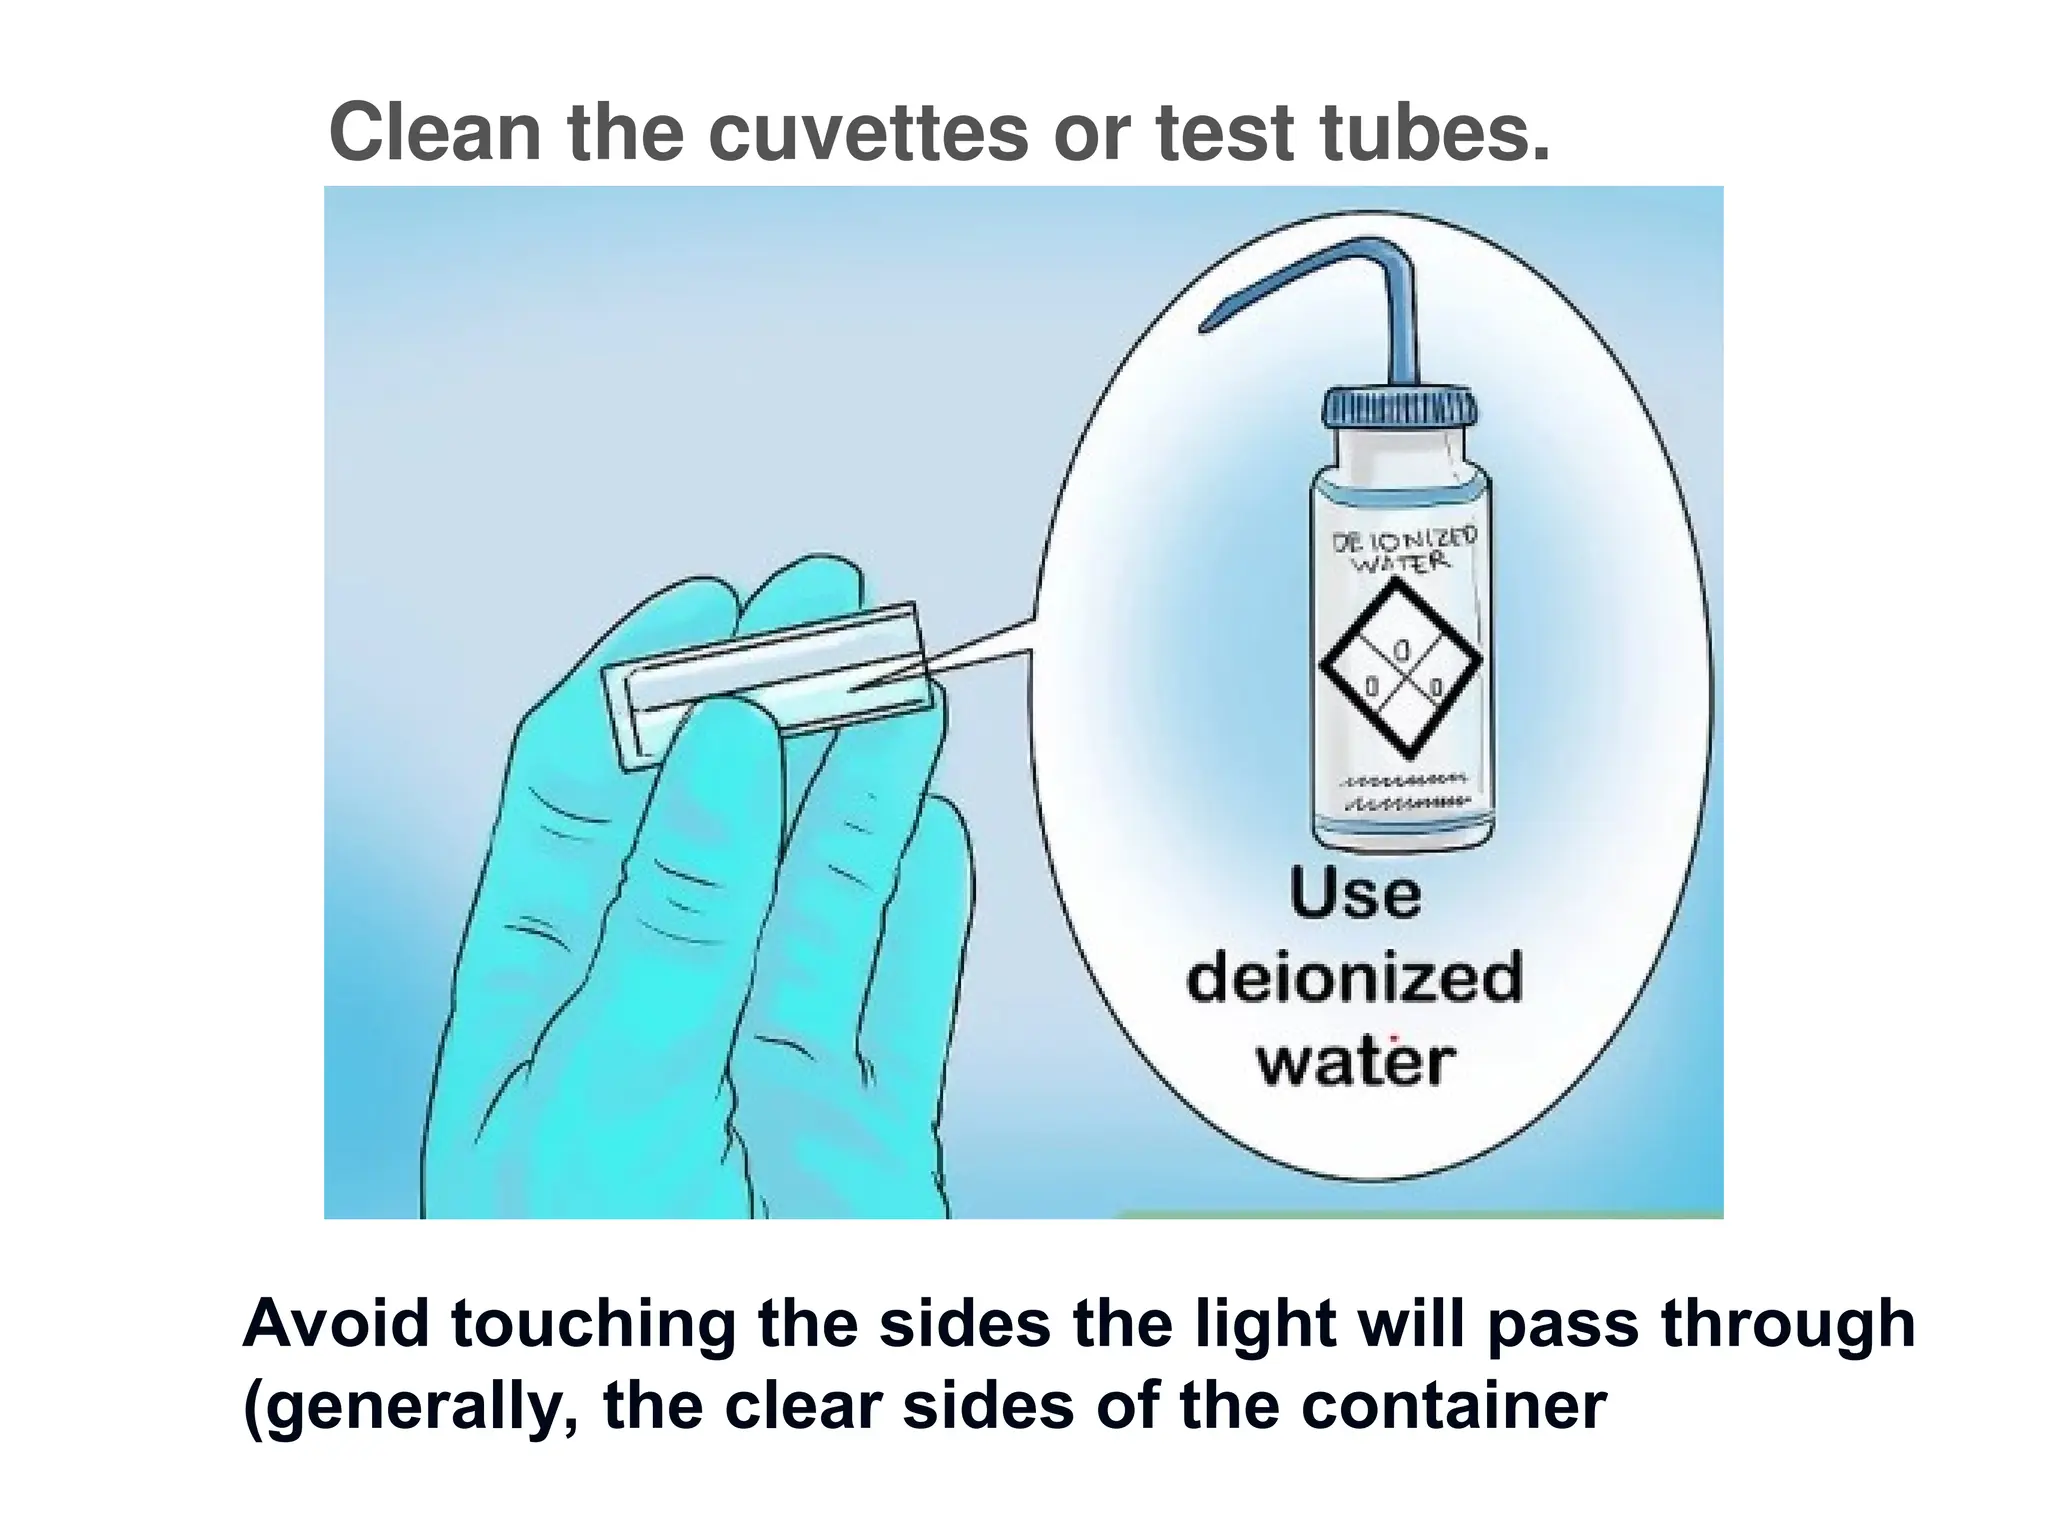
Clean the cuvettesor test tubes.
Avoid touching the sides the light will pass through
(generally, the clear sides of the container
22.
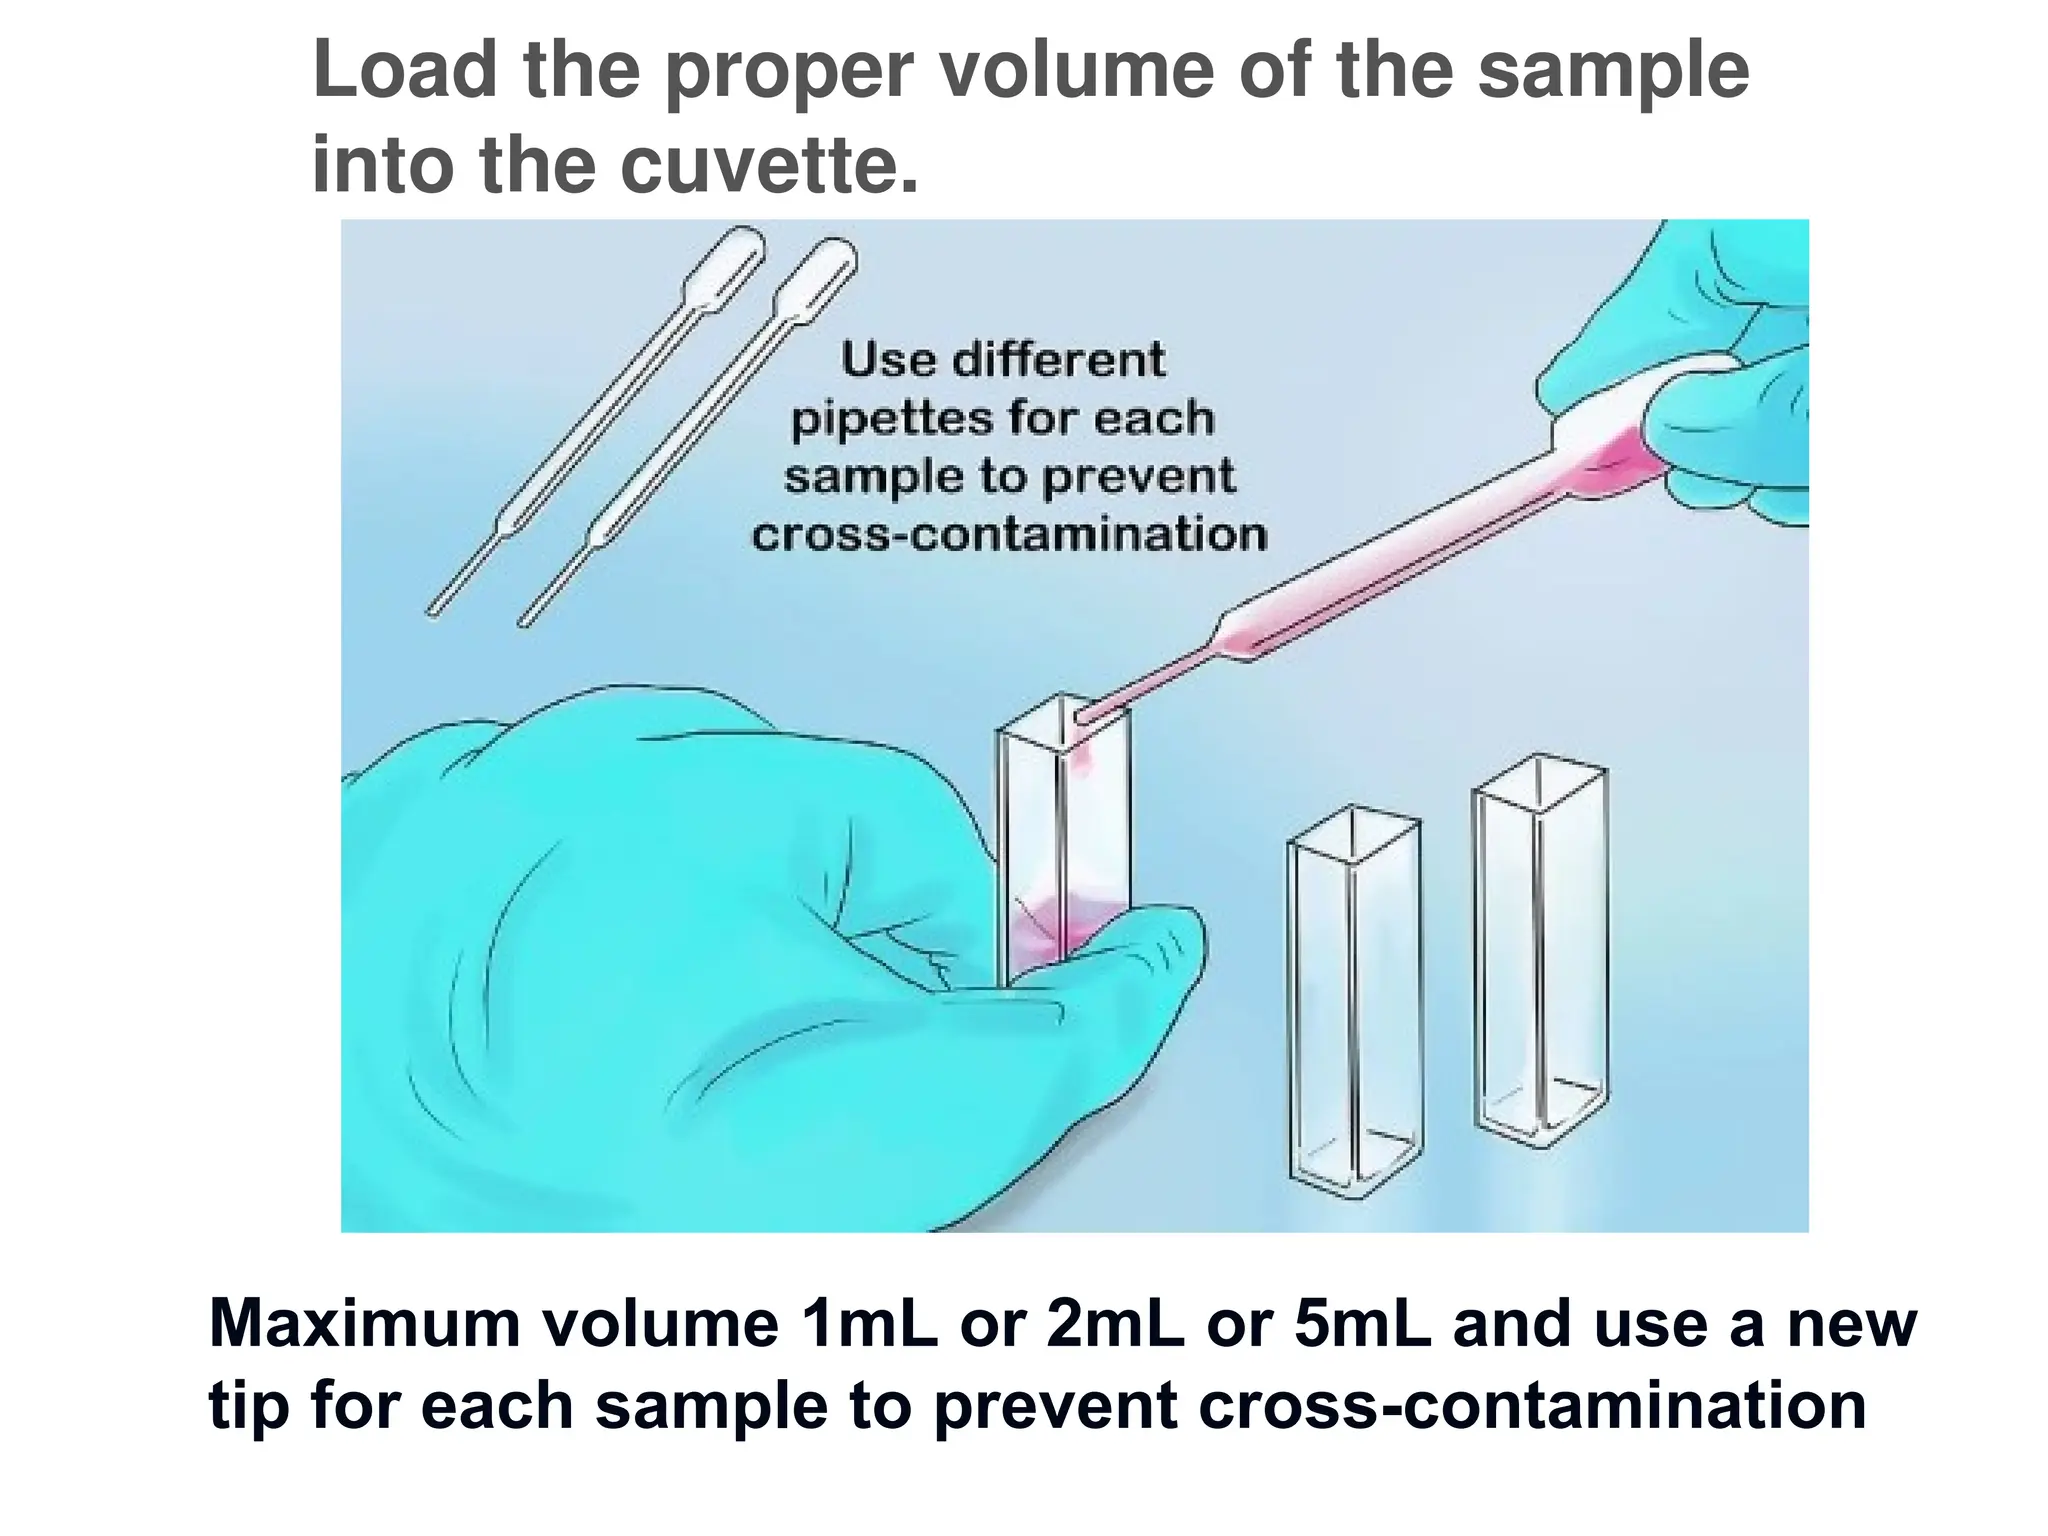
Load the propervolume of the sample
into the cuvette.
Maximum volume 1mL or 2mL or 5mL and use a new
tip for each sample to prevent cross-contamination
23.
Prepare a controlsolution (blank)
Example, if a salt is dissolved in water, the blank would
be just water. If a dye is dissolved in water red, the
blank must also contain red water
24.
Wipe the outsideof the cuvette
Clean the outside of cuvette to avoid interference from
dirt or dust particles using a lint free cloth
Choose and setthe wavelength of light to
analyze the sample
Colour of the light chosen should be one known to be absorbed
by one of the chemicals thought to be in the test solute
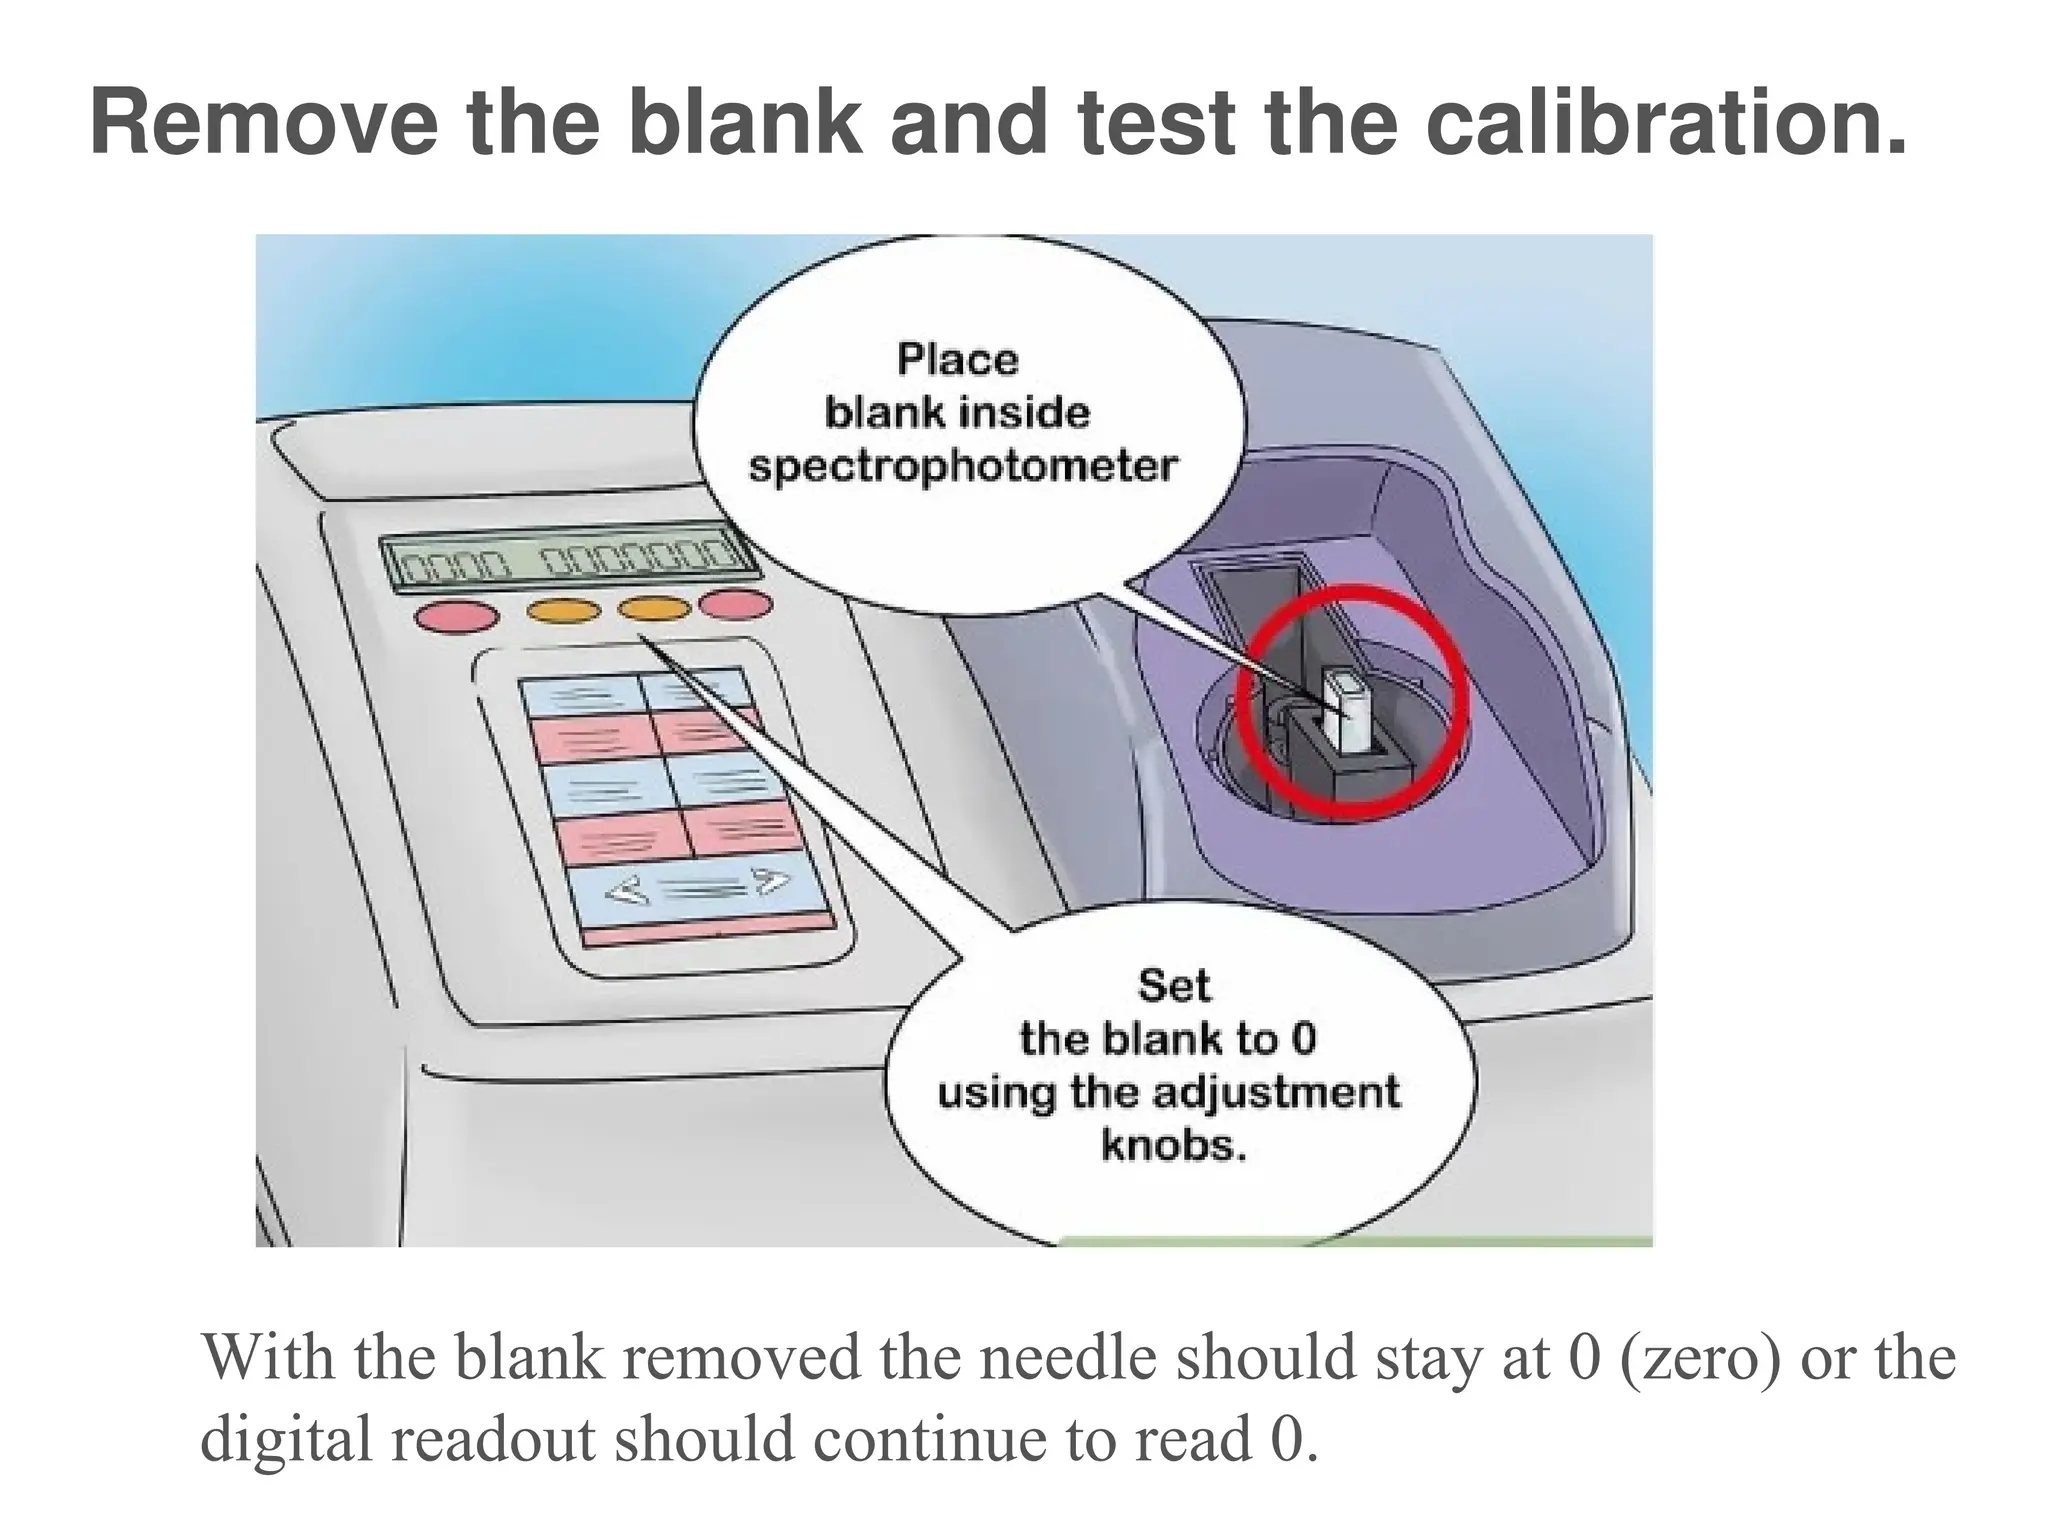
Remove the blankand test the calibration.
With the blank removed the needle should stay at 0 (zero) or the
digital readout should continue to read 0.
30.
Measure the absorbanceof
experimental sample.
Remove the blank and place the
experimental sample into the
machine
Slide the cuvette into the
designated groove and ensure it
stands upright.
Wait about 10 seconds until the
needle is steady or until the
digital numbers stop changing.
Record the values of %
transmittance and/or absorbance..
Generation of standardcurve
1. A series of standard solutions
containing known
concentrations of the analyte
are prepared.
2. A blank solution containing
only the solvent matrix is also
prepared.
3. Absorbance is read for both
the blank and standard
solutions
4. Net readings of standard
solution minus blank
(background) are plotted
versus the concentrations of
the standard solutions to
obtain the working calibration
curve.
33.
Single vrs Multiple-
point standardization
When using a single standard of
known concentration the
standardization is called single
point standardization.
The preferred approach to
standardizing a method is to
prepare a series of standards each
containing different concentration.
This is known as multiple - point
standardization.
In multiple point standardization at
least three standards should be
used.
A plot of measured value (OD)
versus concentration of standards
is known as calibration curve.
The most useful calibration curve is
a straight line.
34.
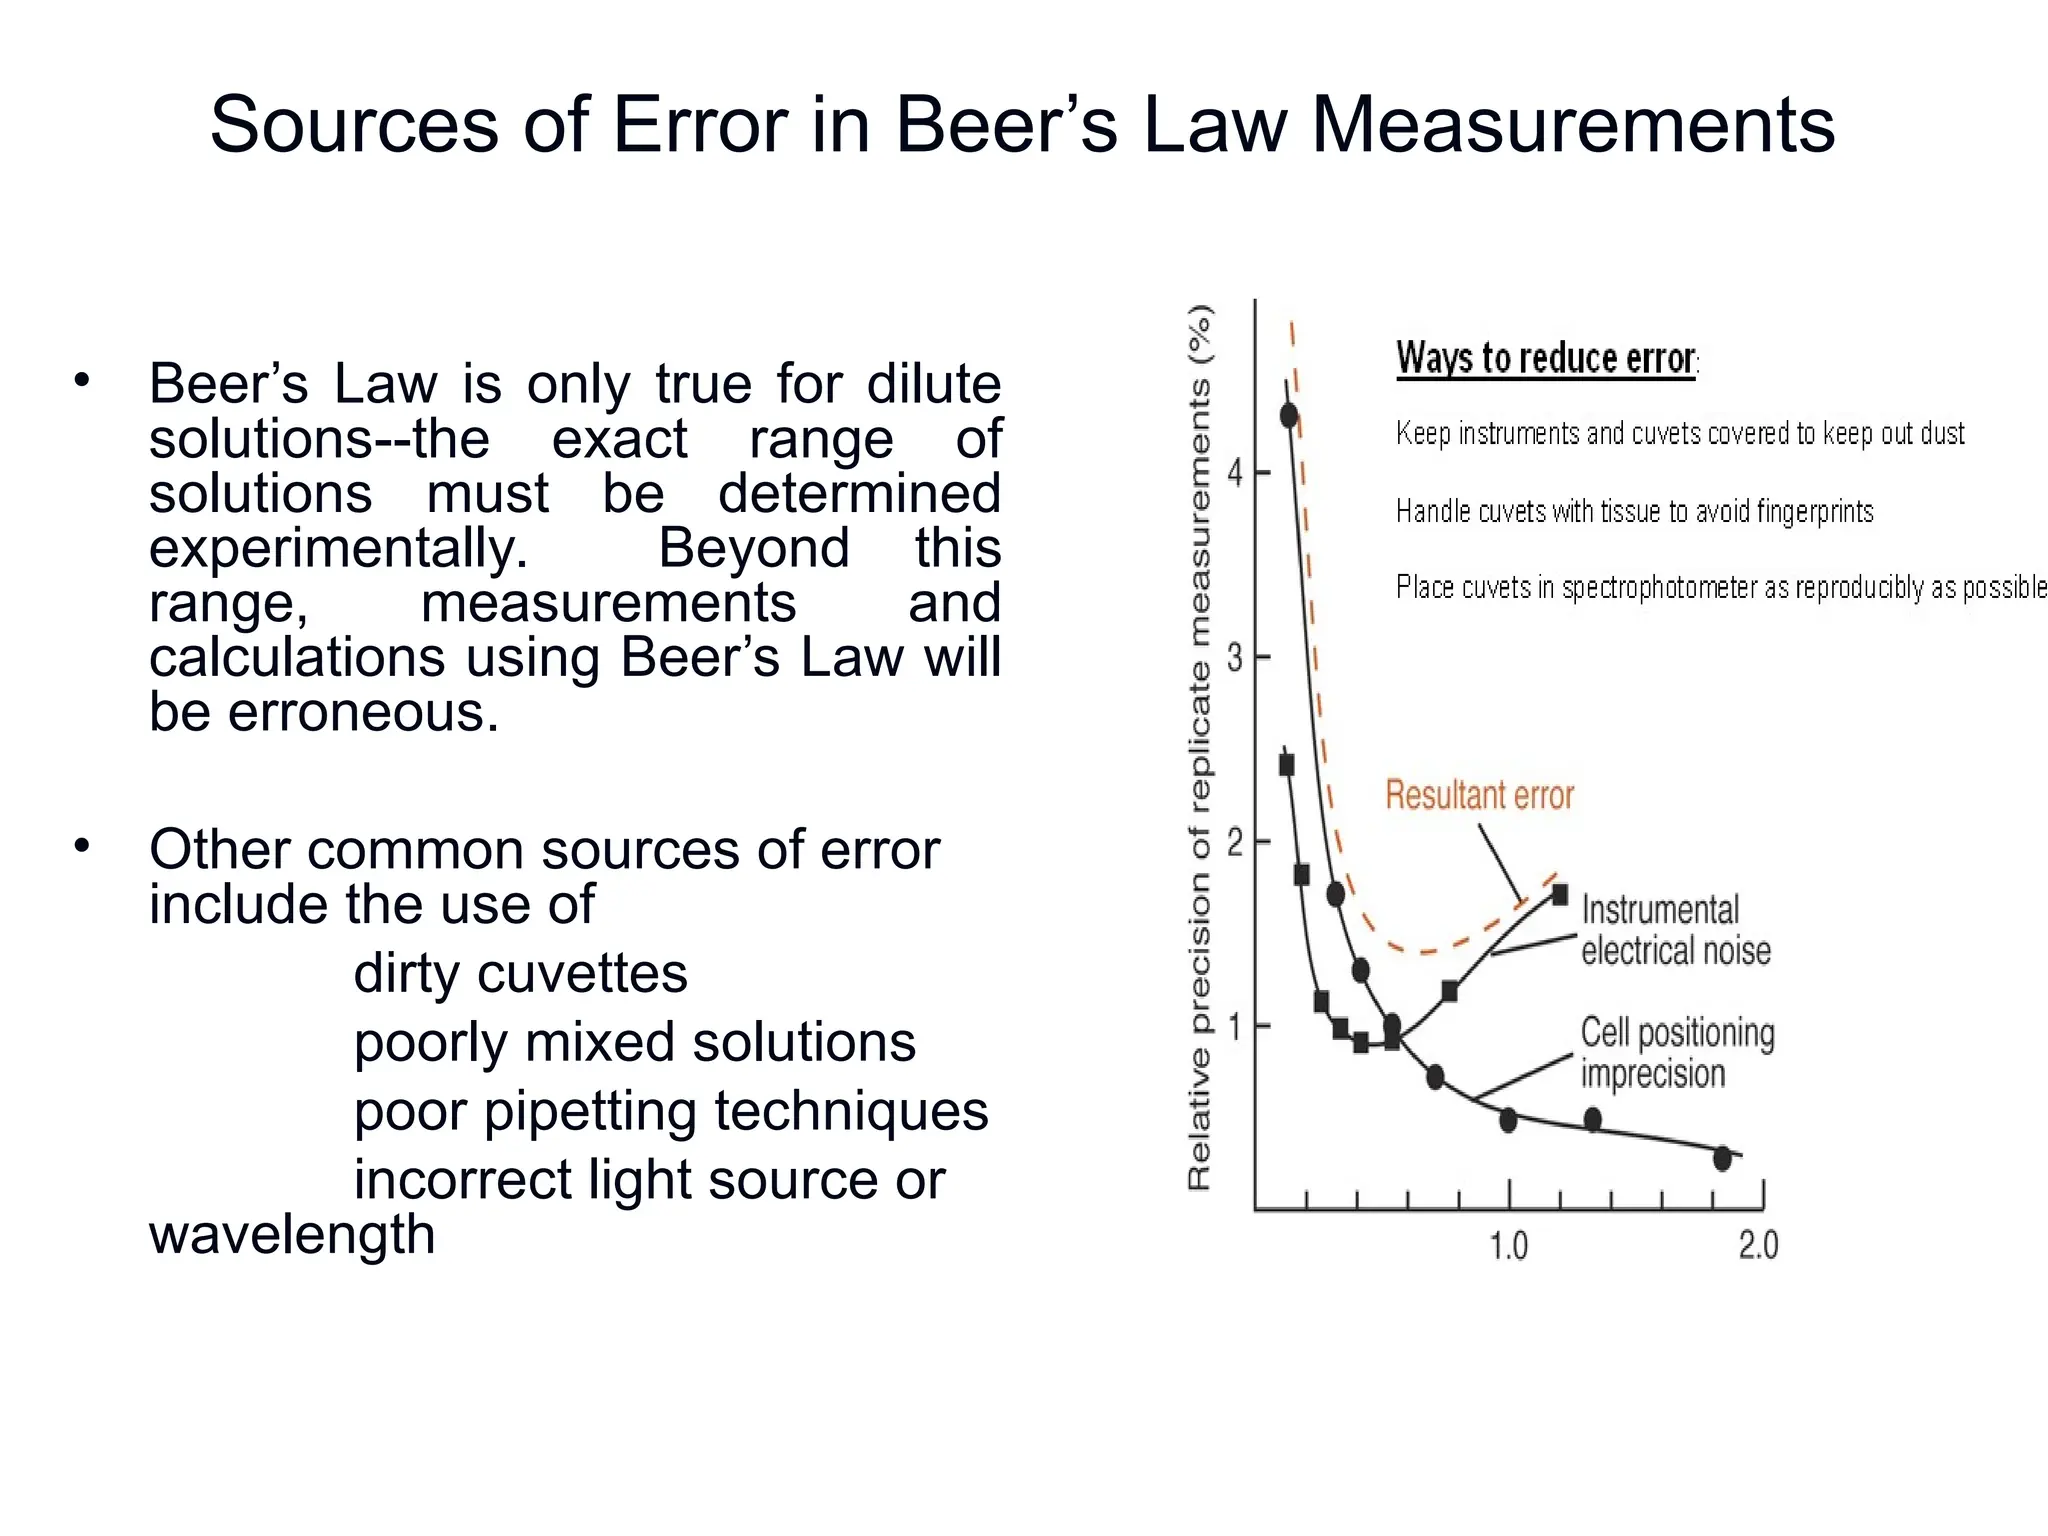
Sources of Errorin Beer’s Law Measurements
• Beer’s Law is only true for dilute
solutions--the exact range of
solutions must be determined
experimentally. Beyond this
range, measurements and
calculations using Beer’s Law will
be erroneous.
• Other common sources of error
include the use of
dirty cuvettes
poorly mixed solutions
poor pipetting techniques
incorrect light source or
wavelength
35.
Why generate astandard curve?
1. Standard curves are generated
when ε is not known and/or to
minimize experimental error.
2. In this case, the researcher
determines the absorbance of
several known concentrations of the
solution.
3. These known concentrations are
referred to as standard solutions.
0
0.1
0.2
0.3
0.4
0.5
0.6
0.7
0 0.1 0.2 0.3 0.4 0.5 0.6
Concentration, M
Absorbance
36.
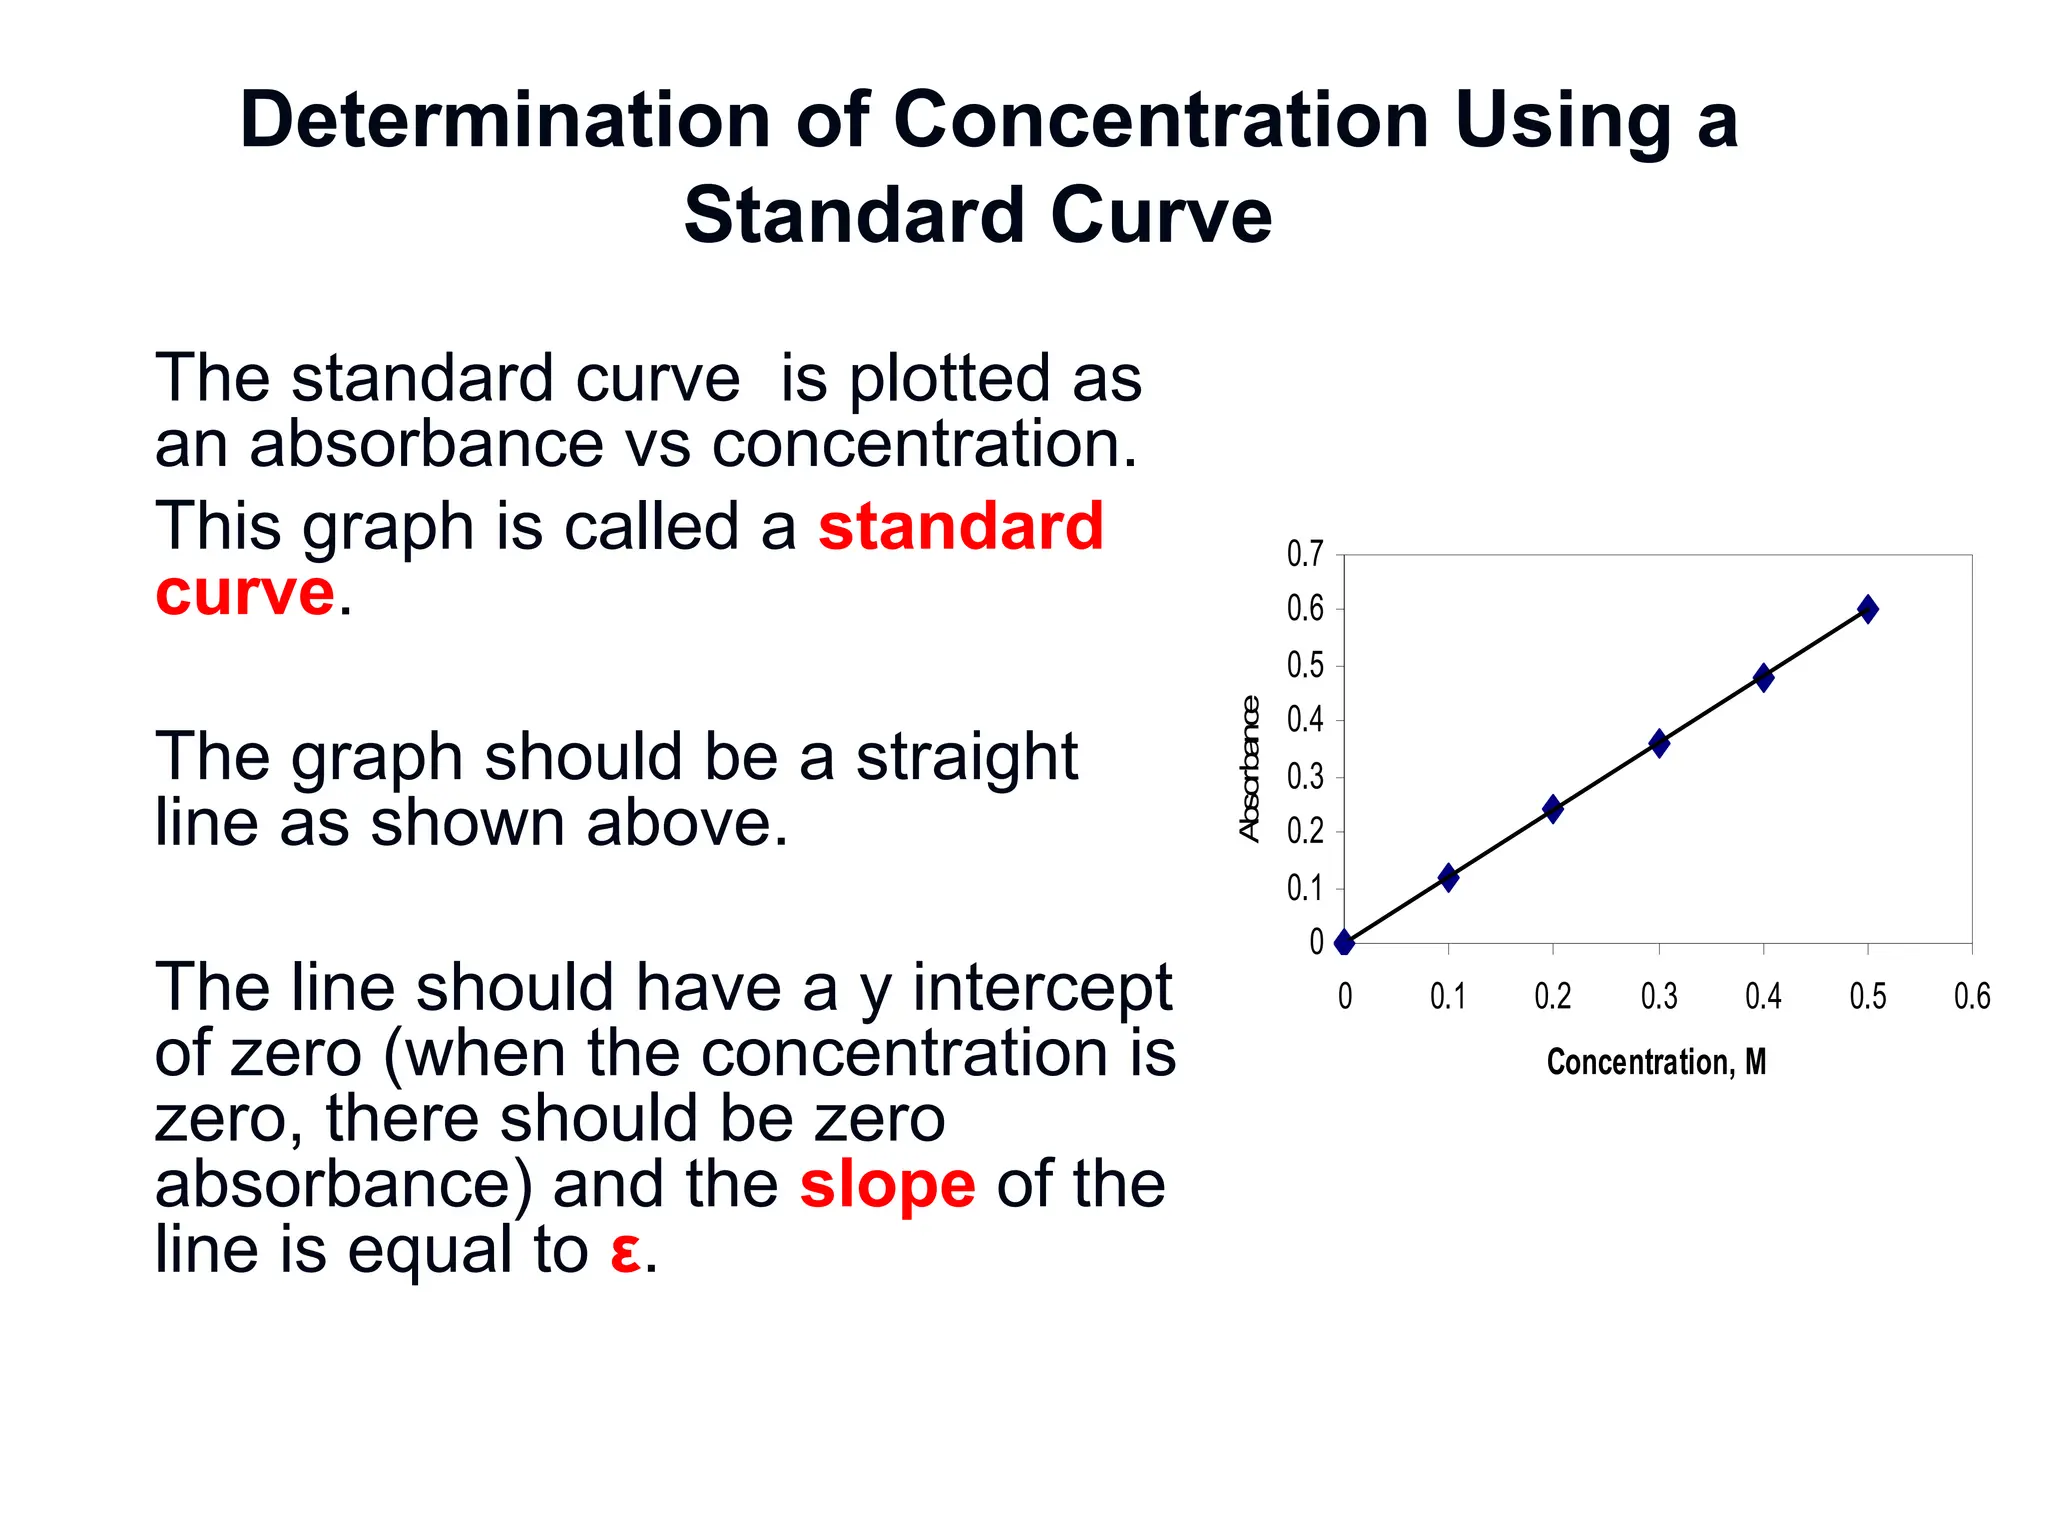
Determination of ConcentrationUsing a
Standard Curve
The standard curve is plotted as
an absorbance vs concentration.
This graph is called a standard
curve.
The graph should be a straight
line as shown above.
The line should have a y intercept
of zero (when the concentration is
zero, there should be zero
absorbance) and the slope of the
line is equal to ε.
0
0.1
0.2
0.3
0.4
0.5
0.6
0.7
0 0.1 0.2 0.3 0.4 0.5 0.6
Concentration, M
A
b
so
rb
a
nc
e
37.
Determination of Concentrationof
Experimental Solutions
1 Measure the absorbance of the
experimental solution.
2 Find the absorbance of the
experimental solution on the y-axis
of the standard curve
3 Draw a line parallel to the x-axis
until you reach the line on the
graph
4 Draw a line parallel to the y-axis
until you reach the x-axis.
5 The point on the x-axis tells you
the concentration of your solution
as shown in the figure above.
0
0.1
0.2
0.3
0.4
0.5
0.6
0.7
0 0.1 0.2 0.3 0.4 0.5 0.6
Concentration, M
A
b
s
o
rb
a
nc
e
38.
Assignment 1
1. Definethe following:
a) Spectrophotometry
b) Transmittance
c) Absorbance
d) Monochromatic light
e) Molar absorptivity
2. State Beer’s law and defined the terms involved
3. Graph the following data and determine the concentration in [M] of a
solution that has an absorbance of 0.420
Concentration [M] Absorbance
0.222 0.087
0.436 0.179
0.680 0.255
0.900 0.367
1.123 0.500
39.
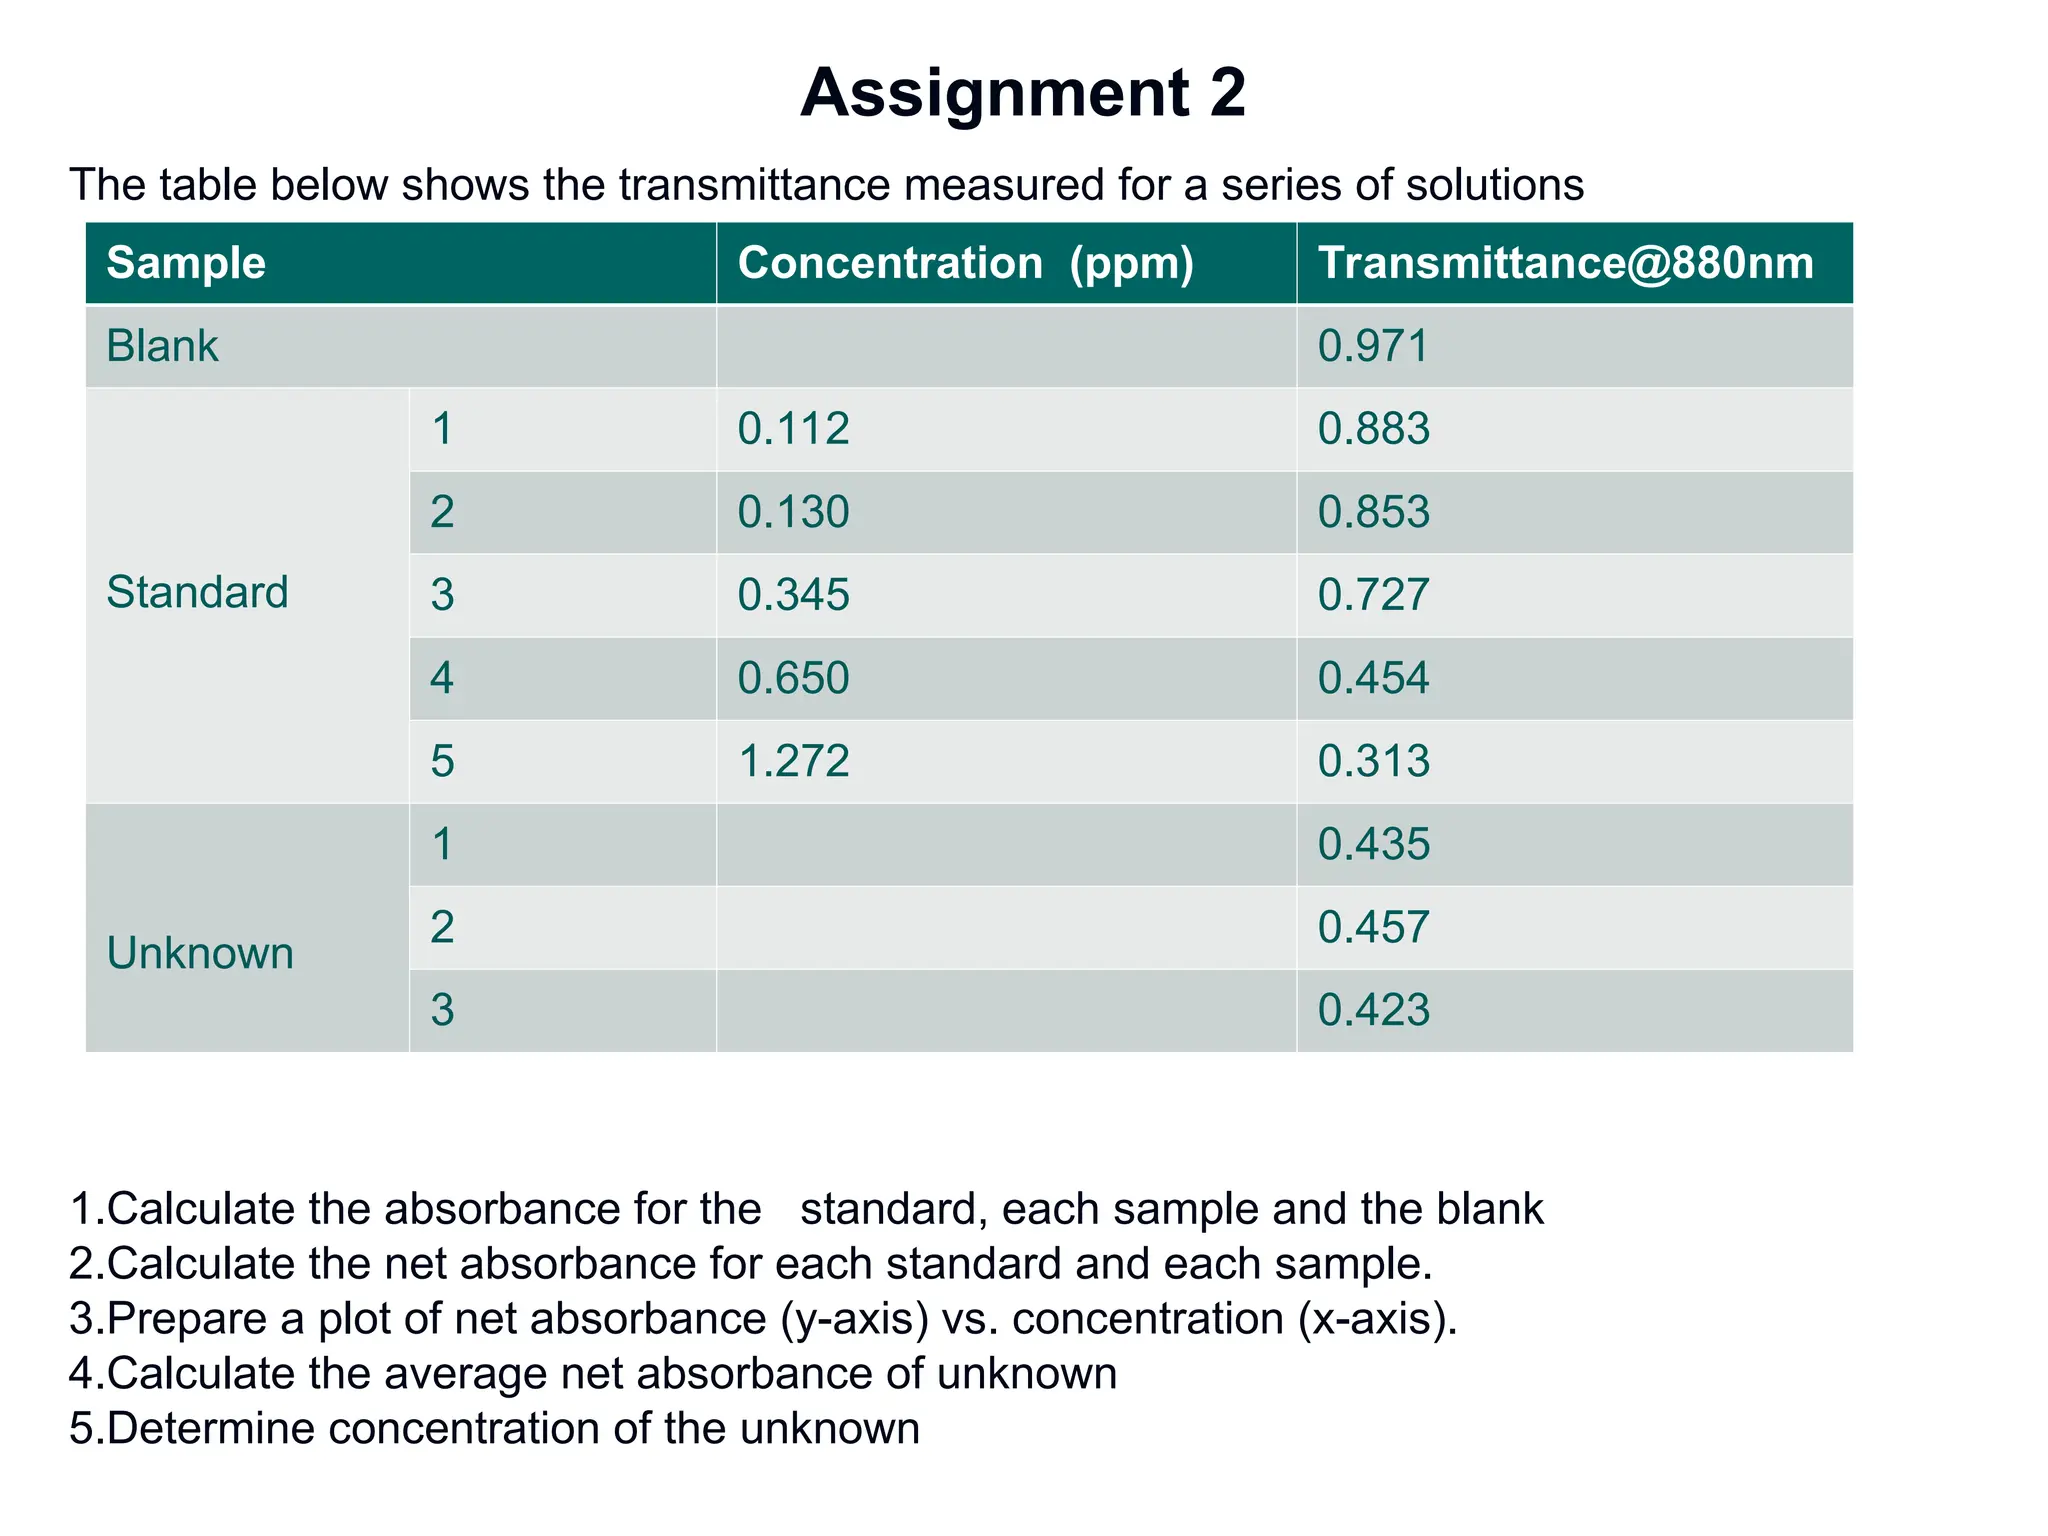
Assignment 2
The tablebelow shows the transmittance measured for a series of solutions
1.Calculate the absorbance for the standard, each sample and the blank
2.Calculate the net absorbance for each standard and each sample.
3.Prepare a plot of net absorbance (y-axis) vs. concentration (x-axis).
4.Calculate the average net absorbance of unknown
5.Determine concentration of the unknown
Sample Concentration (ppm) Transmittance@880nm
Blank 0.971
Standard
1 0.112 0.883
2 0.130 0.853
3 0.345 0.727
4 0.650 0.454
5 1.272 0.313
Unknown
1 0.435
2 0.457
3 0.423


![Assignment 1
1. Define the following:
a) Spectrophotometry
b) Transmittance
c) Absorbance
d) Monochromatic light
e) Molar absorptivity
2. State Beer’s law and defined the terms involved
3. Graph the following data and determine the concentration in [M] of a
solution that has an absorbance of 0.420
Concentration [M] Absorbance
0.222 0.087
0.436 0.179
0.680 0.255
0.900 0.367
1.123 0.500](https://image.slidesharecdn.com/spectrophotometry-20231-1-250721070311-4aab12ed/75/Spectrophotometry-2023-1-presentation-38-2048.jpg)


![0LD-spectrophotometry-130121010534-phpapp02 [Autosaved] - Copy.ppt](https://cdn.slidesharecdn.com/ss_thumbnails/0ld-spectrophotometry-130121010534-phpapp02autosaved-copy-251007052503-e63bc71f-thumbnail.jpg?width=640&height=640&fit=bounds)


![Understanding Parkinson’s Disease: Causes, Symptoms, and Treatment [2025]](https://cdn.slidesharecdn.com/ss_thumbnails/understandingparkinson-251208102525-80ba3223-thumbnail.jpg?width=640&height=640&fit=bounds)


