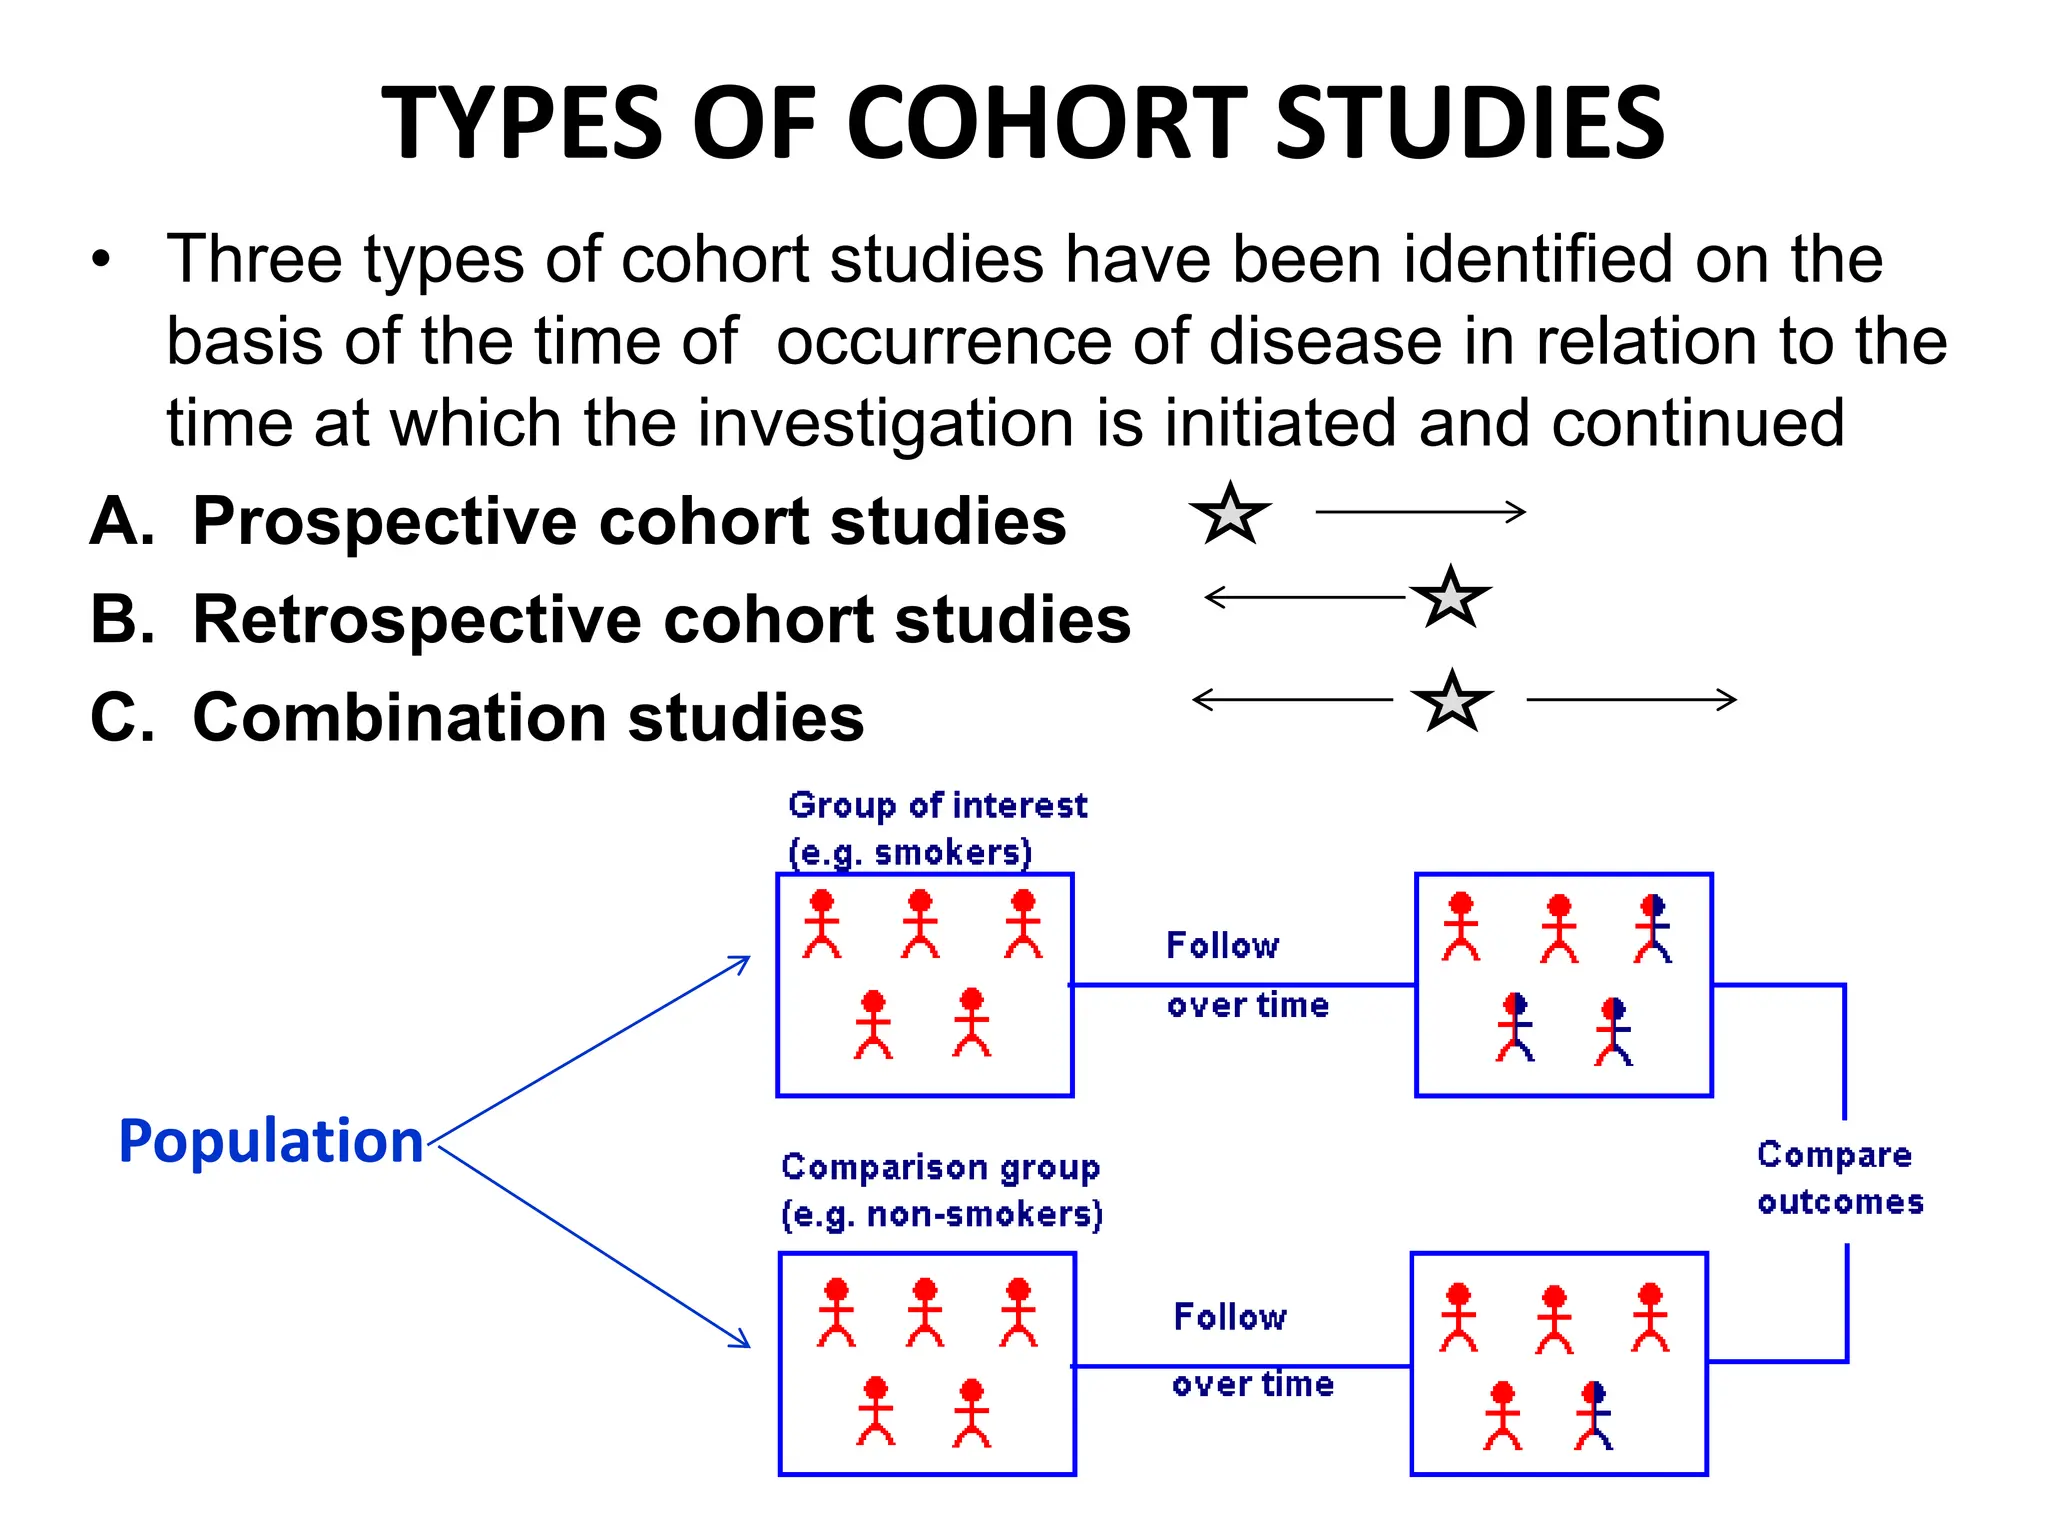
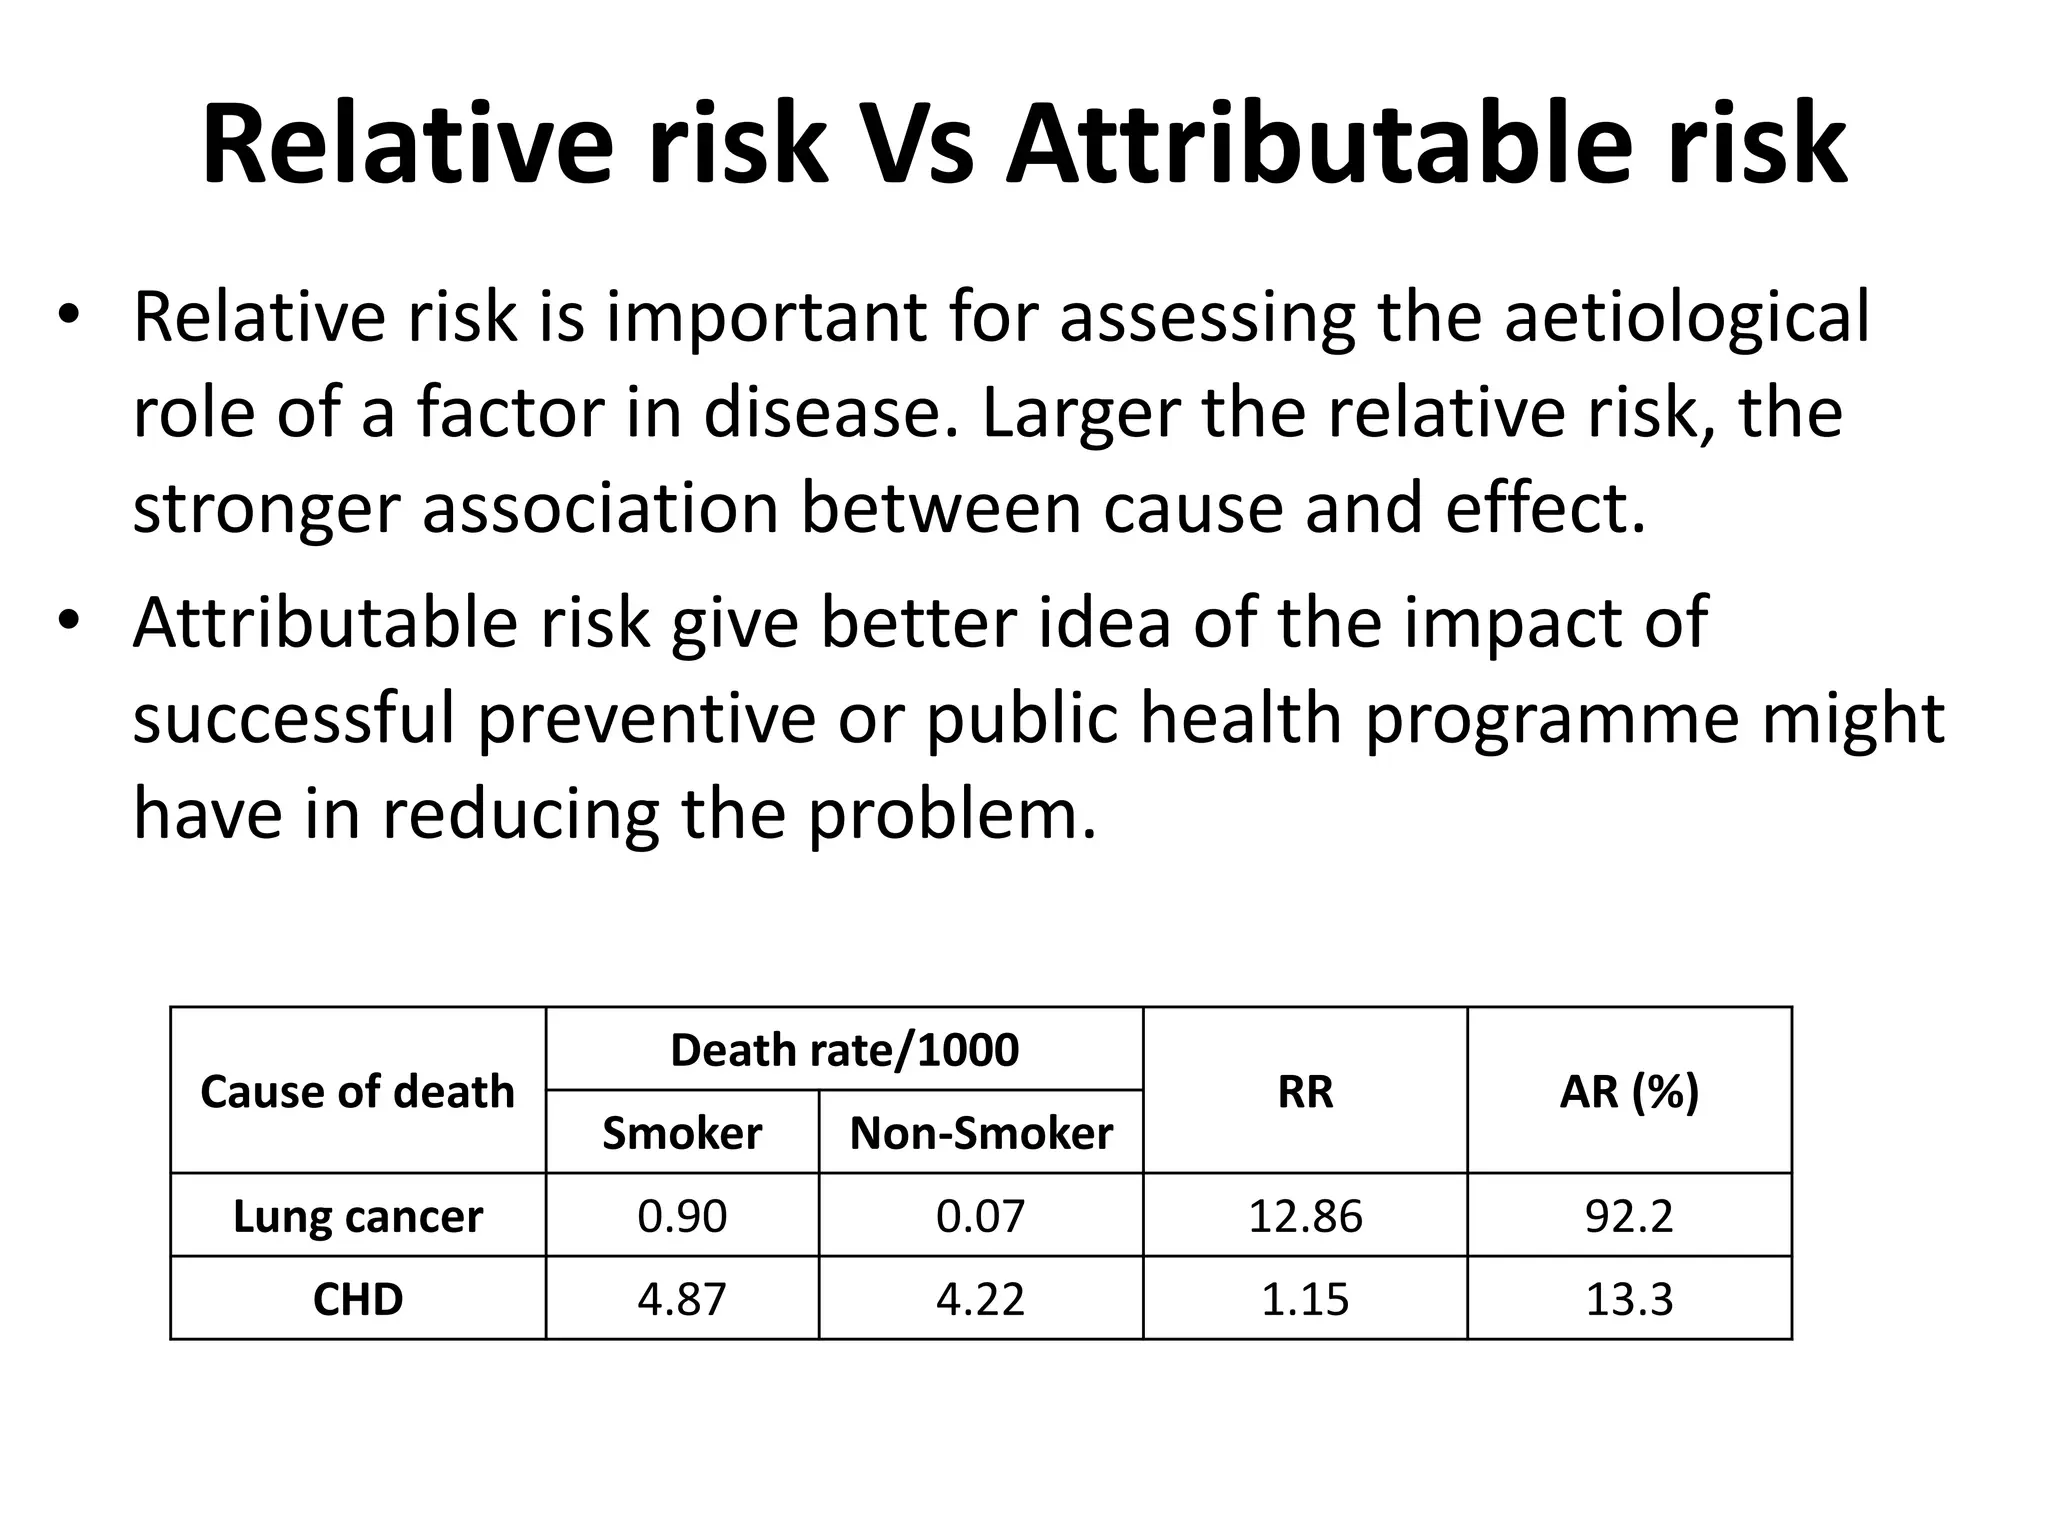
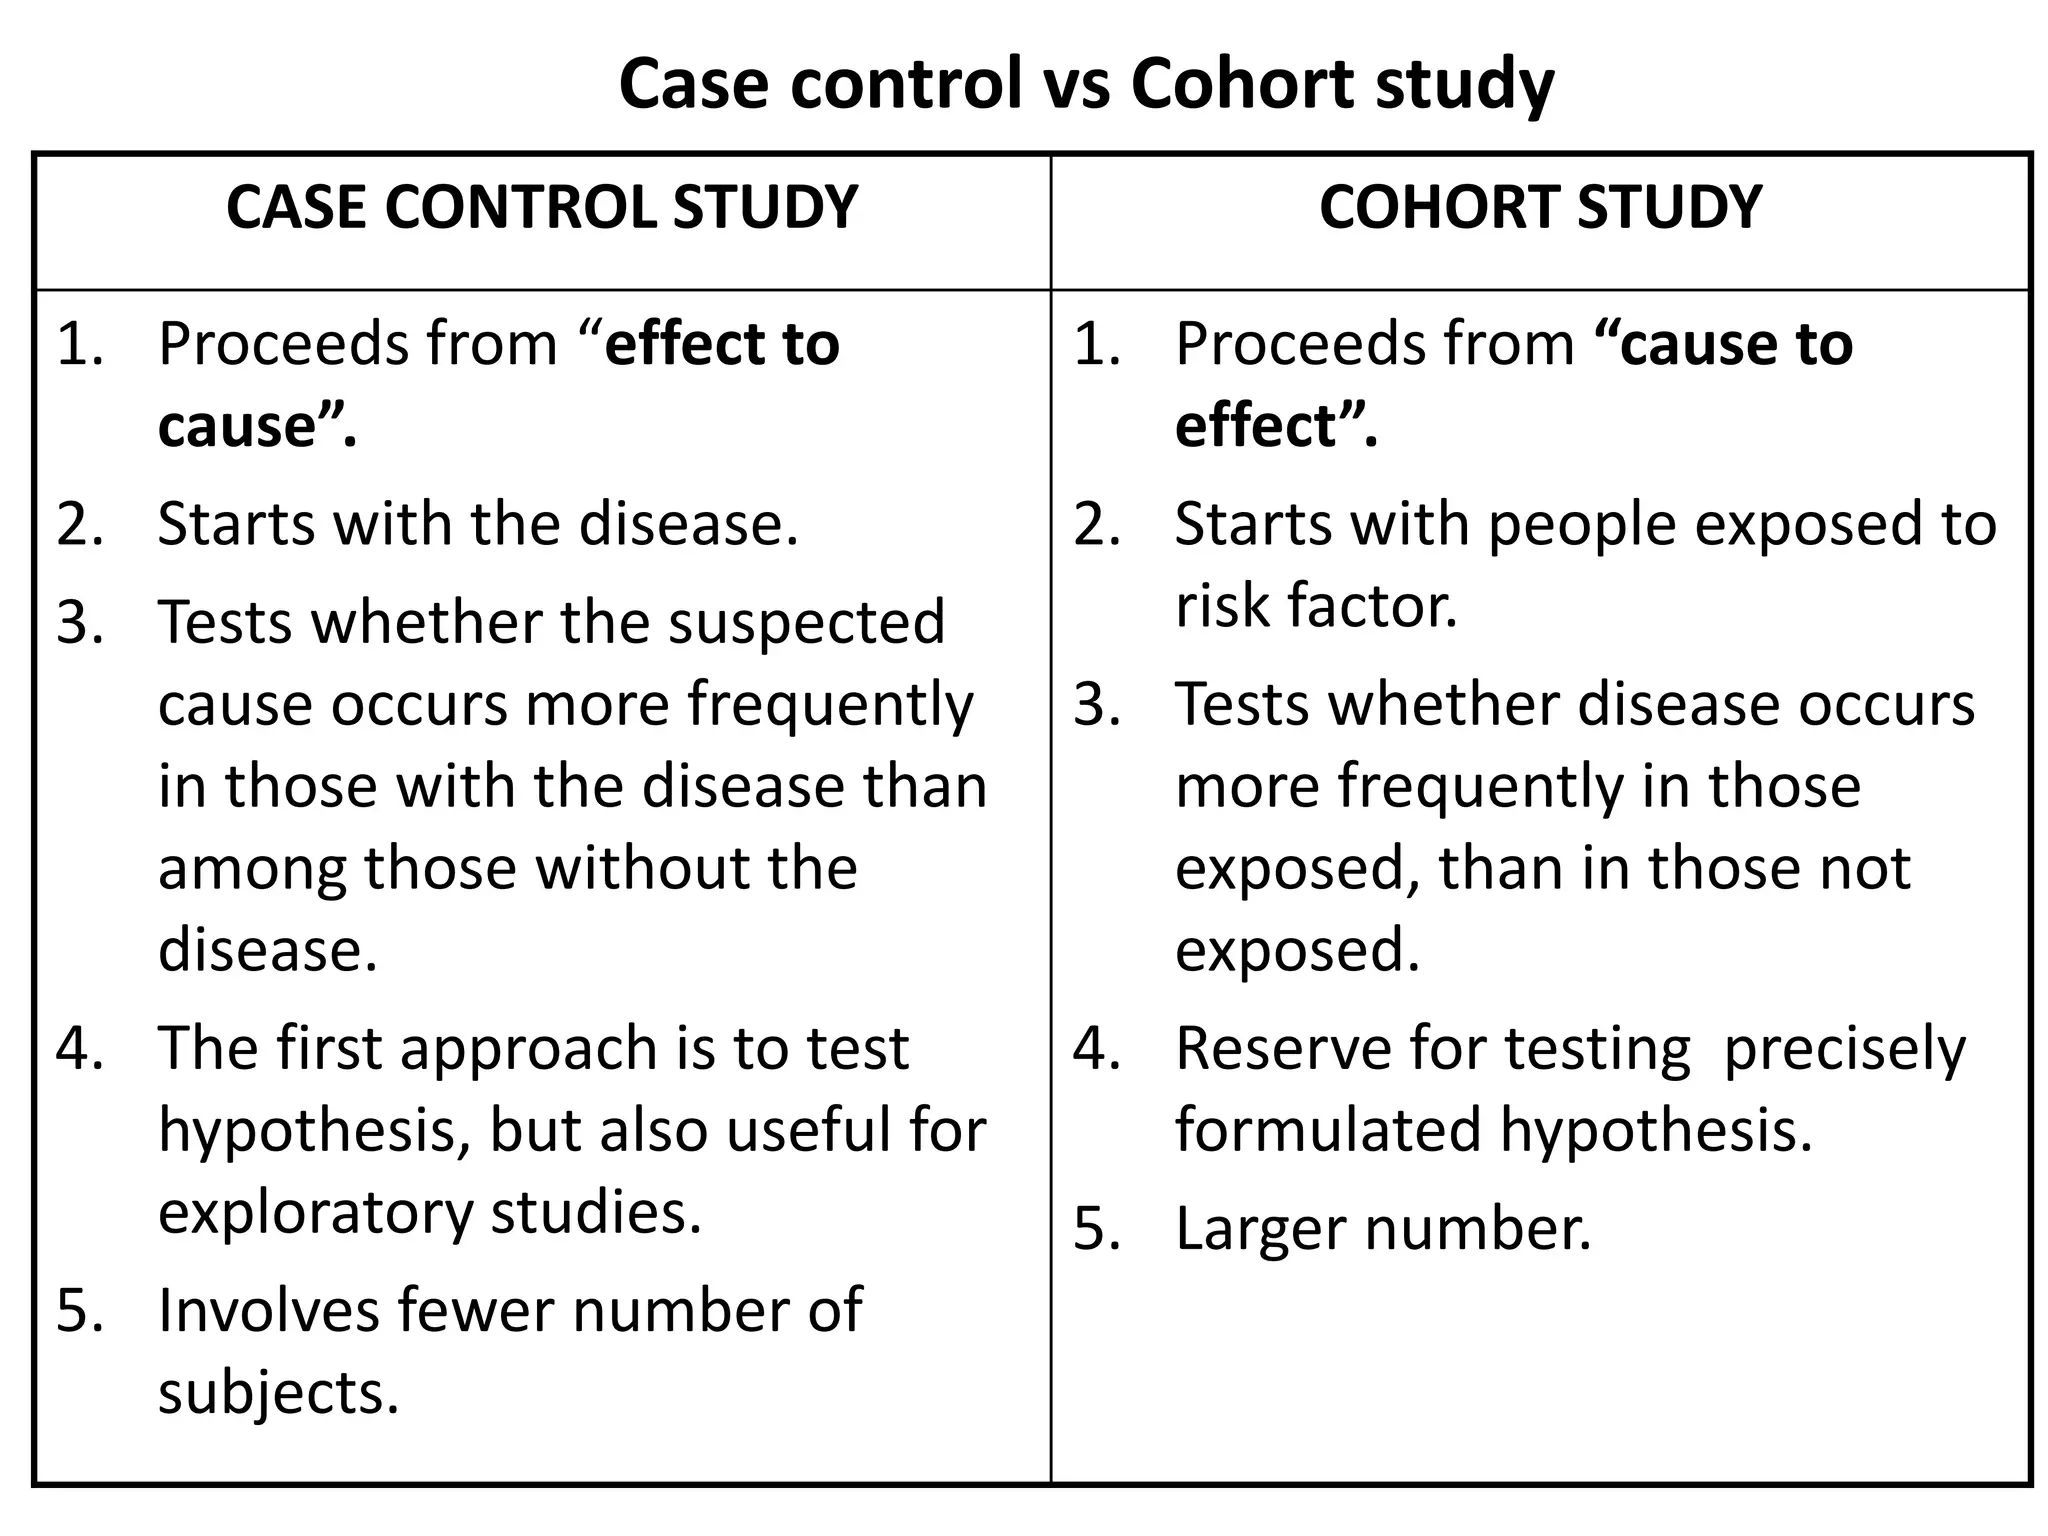
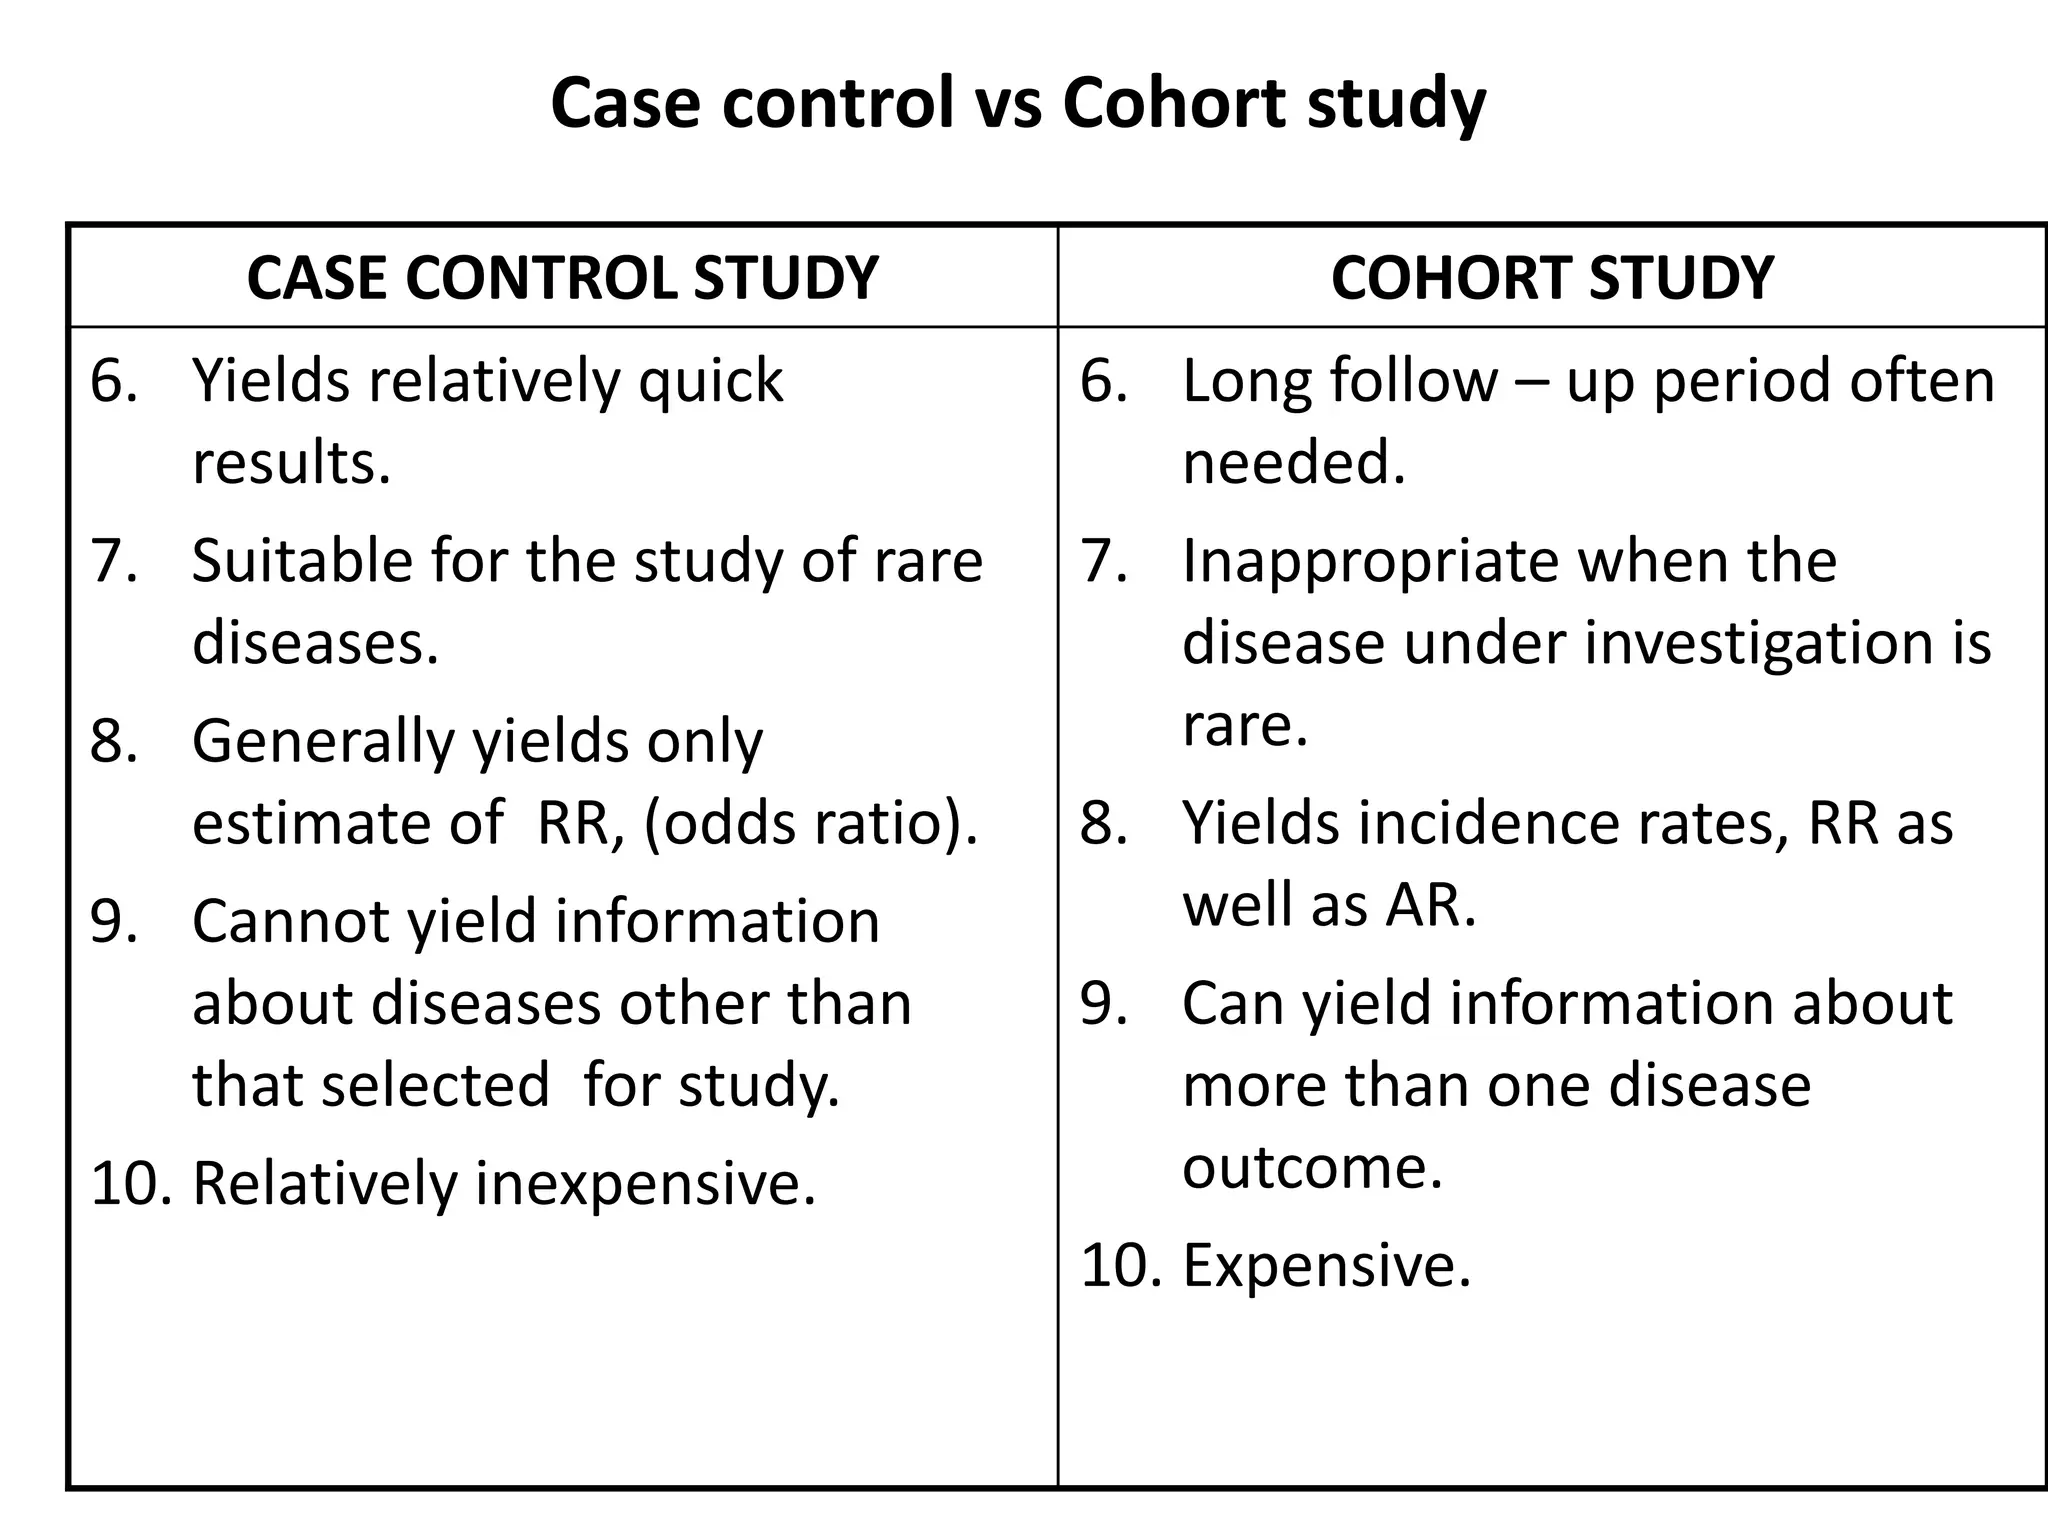
COHORT STUDY
Dr. SHYAM MEHRA
Introduction
• OBJECTIVE : Is to obtain additional evidence to support
the existence of an association between suspected cause
and disease.
• SYNONYMS :
-Prospective study
-Longitudinal study
-Incidence study
-Forward looking study
CONCEPT OF COHORT STUDY
• Cohort is defined as a group of people who share a
common characteristic or experience within a defined
time period. Ex : Exposure cohort, Birth cohort, marriage
cohort
• DISTINGUISHING FEATURES
– The cohorts are identified prior to the appearance of
the disease under investigation.
– The study groups are observed over a period of time
to determine the frequency of disease among them.
– The study proceeds forward from cause to effect
(Exposure to Outcome).
TYPES OF COHORT STUDIES
• Three types of cohort studies have been identified on the
basis of the time of occurrence of disease in relation to the
time at which the investigation is initiated and continued
A. Prospective cohort studies
B. Retrospective cohort studies
C. Combination studies
Population
INDICATIONS FOR COHORT STUDIES :
1. Good Evidence of an association between exposure and
disease.
2. When exposure is rare, but incidence of disease is high
among exposed.
3. When attrition of study population can be minimized.
4. When ample funds are available.
Frame work of Cohort study:
• In cohort study the exposure has occurred, but the
disease has not.
• Begin with the Study Cohort and Control Cohort
• A Control cohort can be general population from which
cohort is drawn (or) can be from another cohort of
persons who had little or no exposure to the risk factor.
General Considerations :
1. The cohorts must be free from the disease under study.
2. Both the groups should be equally susceptible to the
disease under study.
3. Both the groups should be comparable in respect of all
the possible variables, which may influence the
frequency of the disease.
4. The diagnostic and the eligibility criteria of the disease
must be defined before hand.
Cohort
Yes
(diseased)
No Total
Exposed (Study
Cohort)
a b a+b
Not exposed
(Control cohort)
c d c+d
PROCEDURE
ELEMENTS OF COHORT STUDY:
1. Selection of study subjects
2. Obtaining data on exposure
3. Selection of comparison groups
4. Follow up
5. Analysis
a) General population –
– Cohort may be assembled from general population, residing in a
well defined geographical area or appropriate sample may be taken
– The exposed and unexposed segments of the population to be
studied should be representative of the corresponding segments of
the general population. Ex: The Framingham Heart Study.
b) Special groups:
i. Select groups: Professional groups, alumni, govt. employees.
These group are usually homogenous. Also offer advantages of
accessibility and easy follow-up for a protracted period. Ex: Doll
and Hill Prospective Cohort Study.
ii. Exposure groups: Cohorts are selected based on special exposure
to physical, chemical and other disease agents. In this, the
exposure may be rare but the incidence of disease is high among
the exposed. Ex: Radiologists exposed to X-rays.
1. Selection of Study Subject
a) Review of records: Certain kind of Information can be
obtained only from records (medical).
b) Cohort members: Information about individual cohort
members may be obtained Through personal interview
or questionnaire.
c) Medical examination or special test: Information that
can be obtained by medical examination or special
testing of the cohort members. Ex: blood pressure,
serum cholesterol.
d) Environment survey: Information that requires testing
or evaluation of environment within which the study
members have lived or worked. (exposure & its level)
2. Obtaining Data on Exposure
A. INTERNAL COMPARISONS:
• No outside comparison group is required. Comparison groups are in-
built.
• Members Classified into several comparison groups based on levels
of exposure before development of the disease and compared in
term of their subsequent morbidity and mortality.
• Above comparison shows that mortality from lung cancer increased
with increase in number of cigarettes smoked
3. Selection of Comparison Group
Classification of
exposure
No. of deaths Death rate/
1 lakh men
½ Pack 24 95.2
1-2 Packs 90 229.2
2 Packs + 97 264.2
B. EXTERNAL COMPARISONS:
• When information on degree of exposure is not available, an external control
is selected to evaluate the experience of exposed group (smoker and non-
smoker).
• Both cohort should be similar in demographic and other important variables
other than those under study.
C. COMPARISON WITH GENERAL POPULATION RATES
• If none is available, the mortality experience of the exposed group is
compared with the mortality experience of the general population in the same
geographic area as the exposed group. Ex: Comparison of frequency of lung
cancer among uranium mine workers with lung cancer mortality in the general
population where the miners resided.
• LIMITING FACTORS:
– Non-availability of population rates for the outcome required.
– Difficulties in selecting the study and comparison groups which are
representative of the exposed and non-exposed of the general population
3. Selection of Comparison Group
• Method of follow should be devised at the start of the study
depending upon the outcome to be determined (morbidity
or mortality). It comprise of:
A. Periodic medical examination of each member of the
cohort.
B. Reviewing physician and hospital records
C. Routine surveillance of death-records
D. Mailed questionnaires, telephone calls, periodic home-visits
on annual basis.
• Certain percentage of losses to follow up are inevitable due
to death, migration, change of residence, withdrawal of
occupation.
• Safest course is to achieve 95% follow up as possible.
4. Follow Up
FRAME WORK OF COHORT STUDY
COHORT YES NO TOTAL
EXPOSED a b a+b
NOT
EXPOSED
c d c+d
DISEASE
• The data are analyzed in terms of :
a. Incidence rates.
b. Estimation of risk (RR, AR, PAR)
a. INCIDENCE RATES :
• Incidence rate is defined as “ the number of NEW cases occurring in a defined
population during a specified period of time”.
Incidence rate =
No.of new cases in a year
Population at risk during that period
x 1000
• Among smokers = a/(a + b) = 70/7000*1000= 10 per 1000
• Among non-smokers= c/ (c + d) = 3/3000*1000= 1 per 1000
• Statistical significant: p<0.001
5. Analysis
Cigarette
Smoking
Developed
lung cancer
Did not develop
lung cancer
Total
Yes 70 (a) 6930 (b) 7000 (a+b)
No 3 (c) 2997 (d) 3000 (c+d)
b. ESTIMATION OF RISK:
I. Relative risk (Risk ratio)
II. Attributable risk
III. Population attributable risk
I. RELATIVE RISK:
• Relative risk is the ratio of the incidence of the disease among exposed
and the incidence among non-exposed.
RR=
Incidence of disease among expos𝑒𝑑
Incidence of disease among non−exposed
= 10/1 = 10
• It implies smoker are 10 times at greater risk of developing lung cancer
than non-smokers
• A relative risk of one indicates no association, relative risk greater than
one suggests “positive” association between exposure and the disease
under study.
• The larger the RR, the greater the “strength” of the association between
the suspected factor and disease.
5. Analysis
II. Attributable Risk (Risk difference):
• It is expressed in percent
Attributable risk=
𝑰𝒏𝒄𝒊𝒅𝒆𝒏𝒄𝒆 𝒐𝒇 𝒅𝒊𝒔𝒆𝒂𝒔𝒆 𝒂𝒎𝒐𝒏𝒈 𝒆𝒙𝒑𝒐𝒔𝒆𝒅 −
𝑰𝒏𝒄𝒊𝒅𝒆𝒏𝒄𝒆 𝒐𝒇 𝒅𝒊𝒔𝒆𝒂𝒔𝒆 𝒂𝒎𝒐𝒏𝒈 𝒏𝒐𝒏−𝒆𝒙𝒑𝒐𝒔𝒆𝒅
𝑰𝒏𝒄𝒊𝒅𝒆𝒏𝒄𝒆 𝒐𝒇 𝒅𝒊𝒔𝒆𝒂𝒔𝒆 𝒂𝒎𝒐𝒏𝒈 𝒆𝒙𝒑𝒐𝒔𝒆𝒅
×100
• Attributable risk in the example : 10-1/10×100 =90 %
• It indicates, to what extent the disease under study can be
attributed to the exposure.
• In above example, 90% of lung cancer in smoker was due to their
smoking. It suggest the amount of lung cancer that might be
eliminated if smoking could be controlled or eliminated.
5. Analysis
III. Population-Attributable Risk
• It is the incidence of the disease in the total population minus the
incidence of the disease among those who were not exposed to
the suspected causal factor.
Population Attributable risk=
𝑰𝒏𝒄𝒊𝒅𝒆𝒏𝒄𝒆 𝒐𝒇 𝒅𝒊𝒔𝒆𝒂𝒔𝒆 𝒊𝒏 𝒕𝒐𝒕𝒂𝒍 𝒑𝒐𝒑𝒖𝒍𝒂𝒕𝒊𝒐𝒏 −
𝑰𝒏𝒄𝒊𝒅𝒆𝒏𝒄𝒆 𝒐𝒇 𝒅𝒊𝒔𝒆𝒂𝒔𝒆 𝒂𝒎𝒐𝒏𝒈 𝒏𝒐𝒏−𝒆𝒙𝒑𝒐𝒔𝒆𝒅
𝑰𝒏𝒄𝒊𝒅𝒆𝒏𝒄𝒆 𝒐𝒇 𝒅𝒊𝒔𝒆𝒂𝒔𝒆 𝒂𝒎𝒐𝒏𝒈 𝒕𝒐𝒕𝒂𝒍 𝒑𝒐𝒑𝒖𝒍𝒂𝒕𝒊𝒐𝒏
×100
• The concept of population attributable risk is useful in that it
provides an estimate of the amount by which the disease could be
reduced in that population if the suspected factor was eliminated
or modified.
5. Analysis
Relative risk Vs Attributable risk
• Relative risk is important for assessing the aetiological
role of a factor in disease. Larger the relative risk, the
stronger association between cause and effect.
• Attributable risk give better idea of the impact of
successful preventive or public health programme might
have in reducing the problem.
Cause of death
Death rate/1000
RR AR (%)
Smoker Non-Smoker
Lung cancer 0.90 0.07 12.86 92.2
CHD 4.87 4.22 1.15 13.3
ADVANTAGES OF COHORT STUDY :
1. Incidence can be calculated.
2. Several possible outcomes related to exposure can be
studied simultaneously.
3. Cohort studies provide a direct estimate to relative risk.
4. Dose-response relation can also be calculated.
5. Certain forms of bias can be minimized like selection
bias.
Advantage and Disadvantage
DISADVANTAGES OF COHORT STUDIES :
1. It involves large number of people. Unsuitable for investigating rare disease
with low incidence.
2. Takes long time to complete the study and obtain results.
3. Administrative problems such as loss of experienced staff, loss of funding,
and extensive record keeping are inevitable.
4. It is usual to lose a substantial proportion of the original cohort. (Attrition <
5%)
5. Selection of comparison group
6. There may be changes in the standard methods or diagnostic criteria.
7. Cohort studies are expensive.
8. The study itself may alter the people’s behavior.
9. Ethical problems are present.
10. we concentrate on a limited number of factors possibly related to disease
outcome.
Advantage and Disadvantage
CASE CONTROL STUDY COHORT STUDY
1. Proceeds from “effect to
cause”.
2. Starts with the disease.
3. Tests whether the suspected
cause occurs more frequently
in those with the disease than
among those without the
disease.
4. The first approach is to test
hypothesis, but also useful for
exploratory studies.
5. Involves fewer number of
subjects.
1. Proceeds from “cause to
effect”.
2. Starts with people exposed to
risk factor.
3. Tests whether disease occurs
more frequently in those
exposed, than in those not
exposed.
4. Reserve for testing precisely
formulated hypothesis.
5. Larger number.
Case control vs Cohort study
CASE CONTROL STUDY COHORT STUDY
6. Yields relatively quick
results.
7. Suitable for the study of rare
diseases.
8. Generally yields only
estimate of RR, (odds ratio).
9. Cannot yield information
about diseases other than
that selected for study.
10. Relatively inexpensive.
6. Long follow – up period often
needed.
7. Inappropriate when the
disease under investigation is
rare.
8. Yields incidence rates, RR as
well as AR.
9. Can yield information about
more than one disease
outcome.
10. Expensive.
Case control vs Cohort study
1. In a cohort study, we found that 100 out of 1000 smokers and 10 out of 1000 non-smokers develops lung
cancer. You need to find out:
a. Relative risk of lung cancer among smokers (2)
b. Attributable risk of smoking on lung cancer. (2)
c. Interpret the above finings. (1)
Diseased Non-diseased
Smoker 100 900 1000
Non smoker 10 990 1000
Thanks!!!

Cohort Study Design- Research Methodology

  • 1.
  • 2.
    Introduction • OBJECTIVE :Is to obtain additional evidence to support the existence of an association between suspected cause and disease. • SYNONYMS : -Prospective study -Longitudinal study -Incidence study -Forward looking study
  • 3.
    CONCEPT OF COHORTSTUDY • Cohort is defined as a group of people who share a common characteristic or experience within a defined time period. Ex : Exposure cohort, Birth cohort, marriage cohort • DISTINGUISHING FEATURES – The cohorts are identified prior to the appearance of the disease under investigation. – The study groups are observed over a period of time to determine the frequency of disease among them. – The study proceeds forward from cause to effect (Exposure to Outcome).
  • 4.
    TYPES OF COHORTSTUDIES • Three types of cohort studies have been identified on the basis of the time of occurrence of disease in relation to the time at which the investigation is initiated and continued A. Prospective cohort studies B. Retrospective cohort studies C. Combination studies Population
  • 5.
    INDICATIONS FOR COHORTSTUDIES : 1. Good Evidence of an association between exposure and disease. 2. When exposure is rare, but incidence of disease is high among exposed. 3. When attrition of study population can be minimized. 4. When ample funds are available. Frame work of Cohort study: • In cohort study the exposure has occurred, but the disease has not. • Begin with the Study Cohort and Control Cohort • A Control cohort can be general population from which cohort is drawn (or) can be from another cohort of persons who had little or no exposure to the risk factor.
  • 6.
    General Considerations : 1.The cohorts must be free from the disease under study. 2. Both the groups should be equally susceptible to the disease under study. 3. Both the groups should be comparable in respect of all the possible variables, which may influence the frequency of the disease. 4. The diagnostic and the eligibility criteria of the disease must be defined before hand. Cohort Yes (diseased) No Total Exposed (Study Cohort) a b a+b Not exposed (Control cohort) c d c+d
  • 7.
    PROCEDURE ELEMENTS OF COHORTSTUDY: 1. Selection of study subjects 2. Obtaining data on exposure 3. Selection of comparison groups 4. Follow up 5. Analysis
  • 9.
    a) General population– – Cohort may be assembled from general population, residing in a well defined geographical area or appropriate sample may be taken – The exposed and unexposed segments of the population to be studied should be representative of the corresponding segments of the general population. Ex: The Framingham Heart Study. b) Special groups: i. Select groups: Professional groups, alumni, govt. employees. These group are usually homogenous. Also offer advantages of accessibility and easy follow-up for a protracted period. Ex: Doll and Hill Prospective Cohort Study. ii. Exposure groups: Cohorts are selected based on special exposure to physical, chemical and other disease agents. In this, the exposure may be rare but the incidence of disease is high among the exposed. Ex: Radiologists exposed to X-rays. 1. Selection of Study Subject
  • 10.
    a) Review ofrecords: Certain kind of Information can be obtained only from records (medical). b) Cohort members: Information about individual cohort members may be obtained Through personal interview or questionnaire. c) Medical examination or special test: Information that can be obtained by medical examination or special testing of the cohort members. Ex: blood pressure, serum cholesterol. d) Environment survey: Information that requires testing or evaluation of environment within which the study members have lived or worked. (exposure & its level) 2. Obtaining Data on Exposure
  • 11.
    A. INTERNAL COMPARISONS: •No outside comparison group is required. Comparison groups are in- built. • Members Classified into several comparison groups based on levels of exposure before development of the disease and compared in term of their subsequent morbidity and mortality. • Above comparison shows that mortality from lung cancer increased with increase in number of cigarettes smoked 3. Selection of Comparison Group Classification of exposure No. of deaths Death rate/ 1 lakh men ½ Pack 24 95.2 1-2 Packs 90 229.2 2 Packs + 97 264.2
  • 12.
    B. EXTERNAL COMPARISONS: •When information on degree of exposure is not available, an external control is selected to evaluate the experience of exposed group (smoker and non- smoker). • Both cohort should be similar in demographic and other important variables other than those under study. C. COMPARISON WITH GENERAL POPULATION RATES • If none is available, the mortality experience of the exposed group is compared with the mortality experience of the general population in the same geographic area as the exposed group. Ex: Comparison of frequency of lung cancer among uranium mine workers with lung cancer mortality in the general population where the miners resided. • LIMITING FACTORS: – Non-availability of population rates for the outcome required. – Difficulties in selecting the study and comparison groups which are representative of the exposed and non-exposed of the general population 3. Selection of Comparison Group
  • 13.
    • Method offollow should be devised at the start of the study depending upon the outcome to be determined (morbidity or mortality). It comprise of: A. Periodic medical examination of each member of the cohort. B. Reviewing physician and hospital records C. Routine surveillance of death-records D. Mailed questionnaires, telephone calls, periodic home-visits on annual basis. • Certain percentage of losses to follow up are inevitable due to death, migration, change of residence, withdrawal of occupation. • Safest course is to achieve 95% follow up as possible. 4. Follow Up
  • 14.
    FRAME WORK OFCOHORT STUDY COHORT YES NO TOTAL EXPOSED a b a+b NOT EXPOSED c d c+d DISEASE
  • 15.
    • The dataare analyzed in terms of : a. Incidence rates. b. Estimation of risk (RR, AR, PAR) a. INCIDENCE RATES : • Incidence rate is defined as “ the number of NEW cases occurring in a defined population during a specified period of time”. Incidence rate = No.of new cases in a year Population at risk during that period x 1000 • Among smokers = a/(a + b) = 70/7000*1000= 10 per 1000 • Among non-smokers= c/ (c + d) = 3/3000*1000= 1 per 1000 • Statistical significant: p<0.001 5. Analysis Cigarette Smoking Developed lung cancer Did not develop lung cancer Total Yes 70 (a) 6930 (b) 7000 (a+b) No 3 (c) 2997 (d) 3000 (c+d)
  • 16.
    b. ESTIMATION OFRISK: I. Relative risk (Risk ratio) II. Attributable risk III. Population attributable risk I. RELATIVE RISK: • Relative risk is the ratio of the incidence of the disease among exposed and the incidence among non-exposed. RR= Incidence of disease among expos𝑒𝑑 Incidence of disease among non−exposed = 10/1 = 10 • It implies smoker are 10 times at greater risk of developing lung cancer than non-smokers • A relative risk of one indicates no association, relative risk greater than one suggests “positive” association between exposure and the disease under study. • The larger the RR, the greater the “strength” of the association between the suspected factor and disease. 5. Analysis
  • 17.
    II. Attributable Risk(Risk difference): • It is expressed in percent Attributable risk= 𝑰𝒏𝒄𝒊𝒅𝒆𝒏𝒄𝒆 𝒐𝒇 𝒅𝒊𝒔𝒆𝒂𝒔𝒆 𝒂𝒎𝒐𝒏𝒈 𝒆𝒙𝒑𝒐𝒔𝒆𝒅 − 𝑰𝒏𝒄𝒊𝒅𝒆𝒏𝒄𝒆 𝒐𝒇 𝒅𝒊𝒔𝒆𝒂𝒔𝒆 𝒂𝒎𝒐𝒏𝒈 𝒏𝒐𝒏−𝒆𝒙𝒑𝒐𝒔𝒆𝒅 𝑰𝒏𝒄𝒊𝒅𝒆𝒏𝒄𝒆 𝒐𝒇 𝒅𝒊𝒔𝒆𝒂𝒔𝒆 𝒂𝒎𝒐𝒏𝒈 𝒆𝒙𝒑𝒐𝒔𝒆𝒅 ×100 • Attributable risk in the example : 10-1/10×100 =90 % • It indicates, to what extent the disease under study can be attributed to the exposure. • In above example, 90% of lung cancer in smoker was due to their smoking. It suggest the amount of lung cancer that might be eliminated if smoking could be controlled or eliminated. 5. Analysis
  • 18.
    III. Population-Attributable Risk •It is the incidence of the disease in the total population minus the incidence of the disease among those who were not exposed to the suspected causal factor. Population Attributable risk= 𝑰𝒏𝒄𝒊𝒅𝒆𝒏𝒄𝒆 𝒐𝒇 𝒅𝒊𝒔𝒆𝒂𝒔𝒆 𝒊𝒏 𝒕𝒐𝒕𝒂𝒍 𝒑𝒐𝒑𝒖𝒍𝒂𝒕𝒊𝒐𝒏 − 𝑰𝒏𝒄𝒊𝒅𝒆𝒏𝒄𝒆 𝒐𝒇 𝒅𝒊𝒔𝒆𝒂𝒔𝒆 𝒂𝒎𝒐𝒏𝒈 𝒏𝒐𝒏−𝒆𝒙𝒑𝒐𝒔𝒆𝒅 𝑰𝒏𝒄𝒊𝒅𝒆𝒏𝒄𝒆 𝒐𝒇 𝒅𝒊𝒔𝒆𝒂𝒔𝒆 𝒂𝒎𝒐𝒏𝒈 𝒕𝒐𝒕𝒂𝒍 𝒑𝒐𝒑𝒖𝒍𝒂𝒕𝒊𝒐𝒏 ×100 • The concept of population attributable risk is useful in that it provides an estimate of the amount by which the disease could be reduced in that population if the suspected factor was eliminated or modified. 5. Analysis
  • 19.
    Relative risk VsAttributable risk • Relative risk is important for assessing the aetiological role of a factor in disease. Larger the relative risk, the stronger association between cause and effect. • Attributable risk give better idea of the impact of successful preventive or public health programme might have in reducing the problem. Cause of death Death rate/1000 RR AR (%) Smoker Non-Smoker Lung cancer 0.90 0.07 12.86 92.2 CHD 4.87 4.22 1.15 13.3
  • 20.
    ADVANTAGES OF COHORTSTUDY : 1. Incidence can be calculated. 2. Several possible outcomes related to exposure can be studied simultaneously. 3. Cohort studies provide a direct estimate to relative risk. 4. Dose-response relation can also be calculated. 5. Certain forms of bias can be minimized like selection bias. Advantage and Disadvantage
  • 21.
    DISADVANTAGES OF COHORTSTUDIES : 1. It involves large number of people. Unsuitable for investigating rare disease with low incidence. 2. Takes long time to complete the study and obtain results. 3. Administrative problems such as loss of experienced staff, loss of funding, and extensive record keeping are inevitable. 4. It is usual to lose a substantial proportion of the original cohort. (Attrition < 5%) 5. Selection of comparison group 6. There may be changes in the standard methods or diagnostic criteria. 7. Cohort studies are expensive. 8. The study itself may alter the people’s behavior. 9. Ethical problems are present. 10. we concentrate on a limited number of factors possibly related to disease outcome. Advantage and Disadvantage
  • 22.
    CASE CONTROL STUDYCOHORT STUDY 1. Proceeds from “effect to cause”. 2. Starts with the disease. 3. Tests whether the suspected cause occurs more frequently in those with the disease than among those without the disease. 4. The first approach is to test hypothesis, but also useful for exploratory studies. 5. Involves fewer number of subjects. 1. Proceeds from “cause to effect”. 2. Starts with people exposed to risk factor. 3. Tests whether disease occurs more frequently in those exposed, than in those not exposed. 4. Reserve for testing precisely formulated hypothesis. 5. Larger number. Case control vs Cohort study
  • 23.
    CASE CONTROL STUDYCOHORT STUDY 6. Yields relatively quick results. 7. Suitable for the study of rare diseases. 8. Generally yields only estimate of RR, (odds ratio). 9. Cannot yield information about diseases other than that selected for study. 10. Relatively inexpensive. 6. Long follow – up period often needed. 7. Inappropriate when the disease under investigation is rare. 8. Yields incidence rates, RR as well as AR. 9. Can yield information about more than one disease outcome. 10. Expensive. Case control vs Cohort study
  • 24.
    1. In acohort study, we found that 100 out of 1000 smokers and 10 out of 1000 non-smokers develops lung cancer. You need to find out: a. Relative risk of lung cancer among smokers (2) b. Attributable risk of smoking on lung cancer. (2) c. Interpret the above finings. (1) Diseased Non-diseased Smoker 100 900 1000 Non smoker 10 990 1000
  • 25.