Download as PDF, PPTX


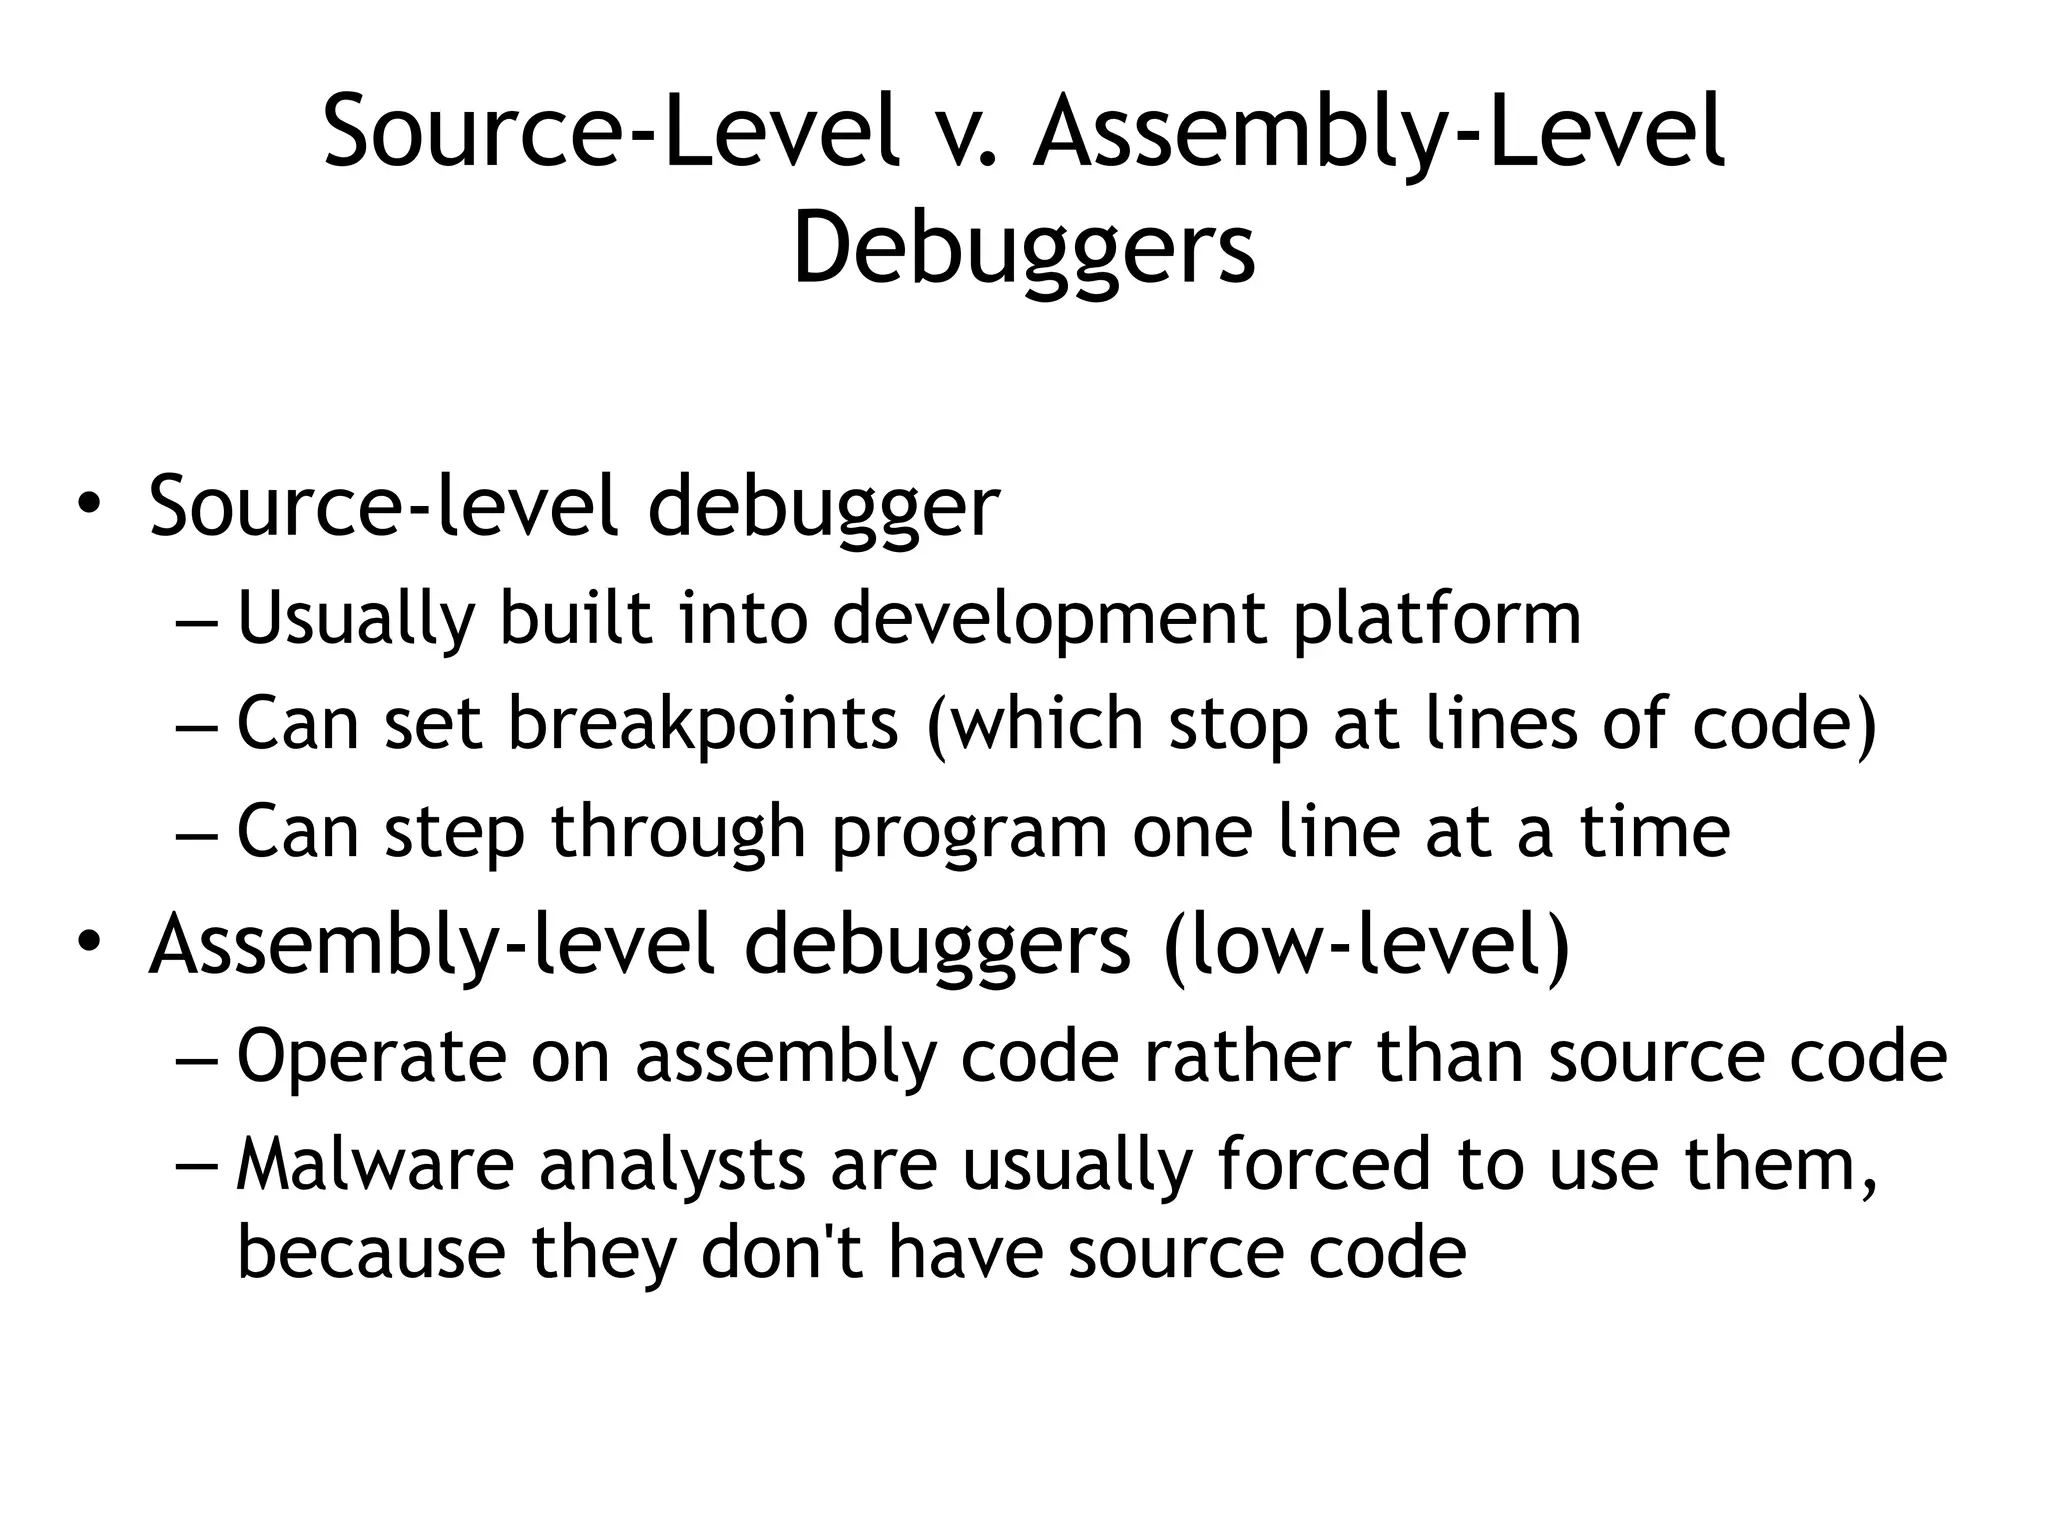


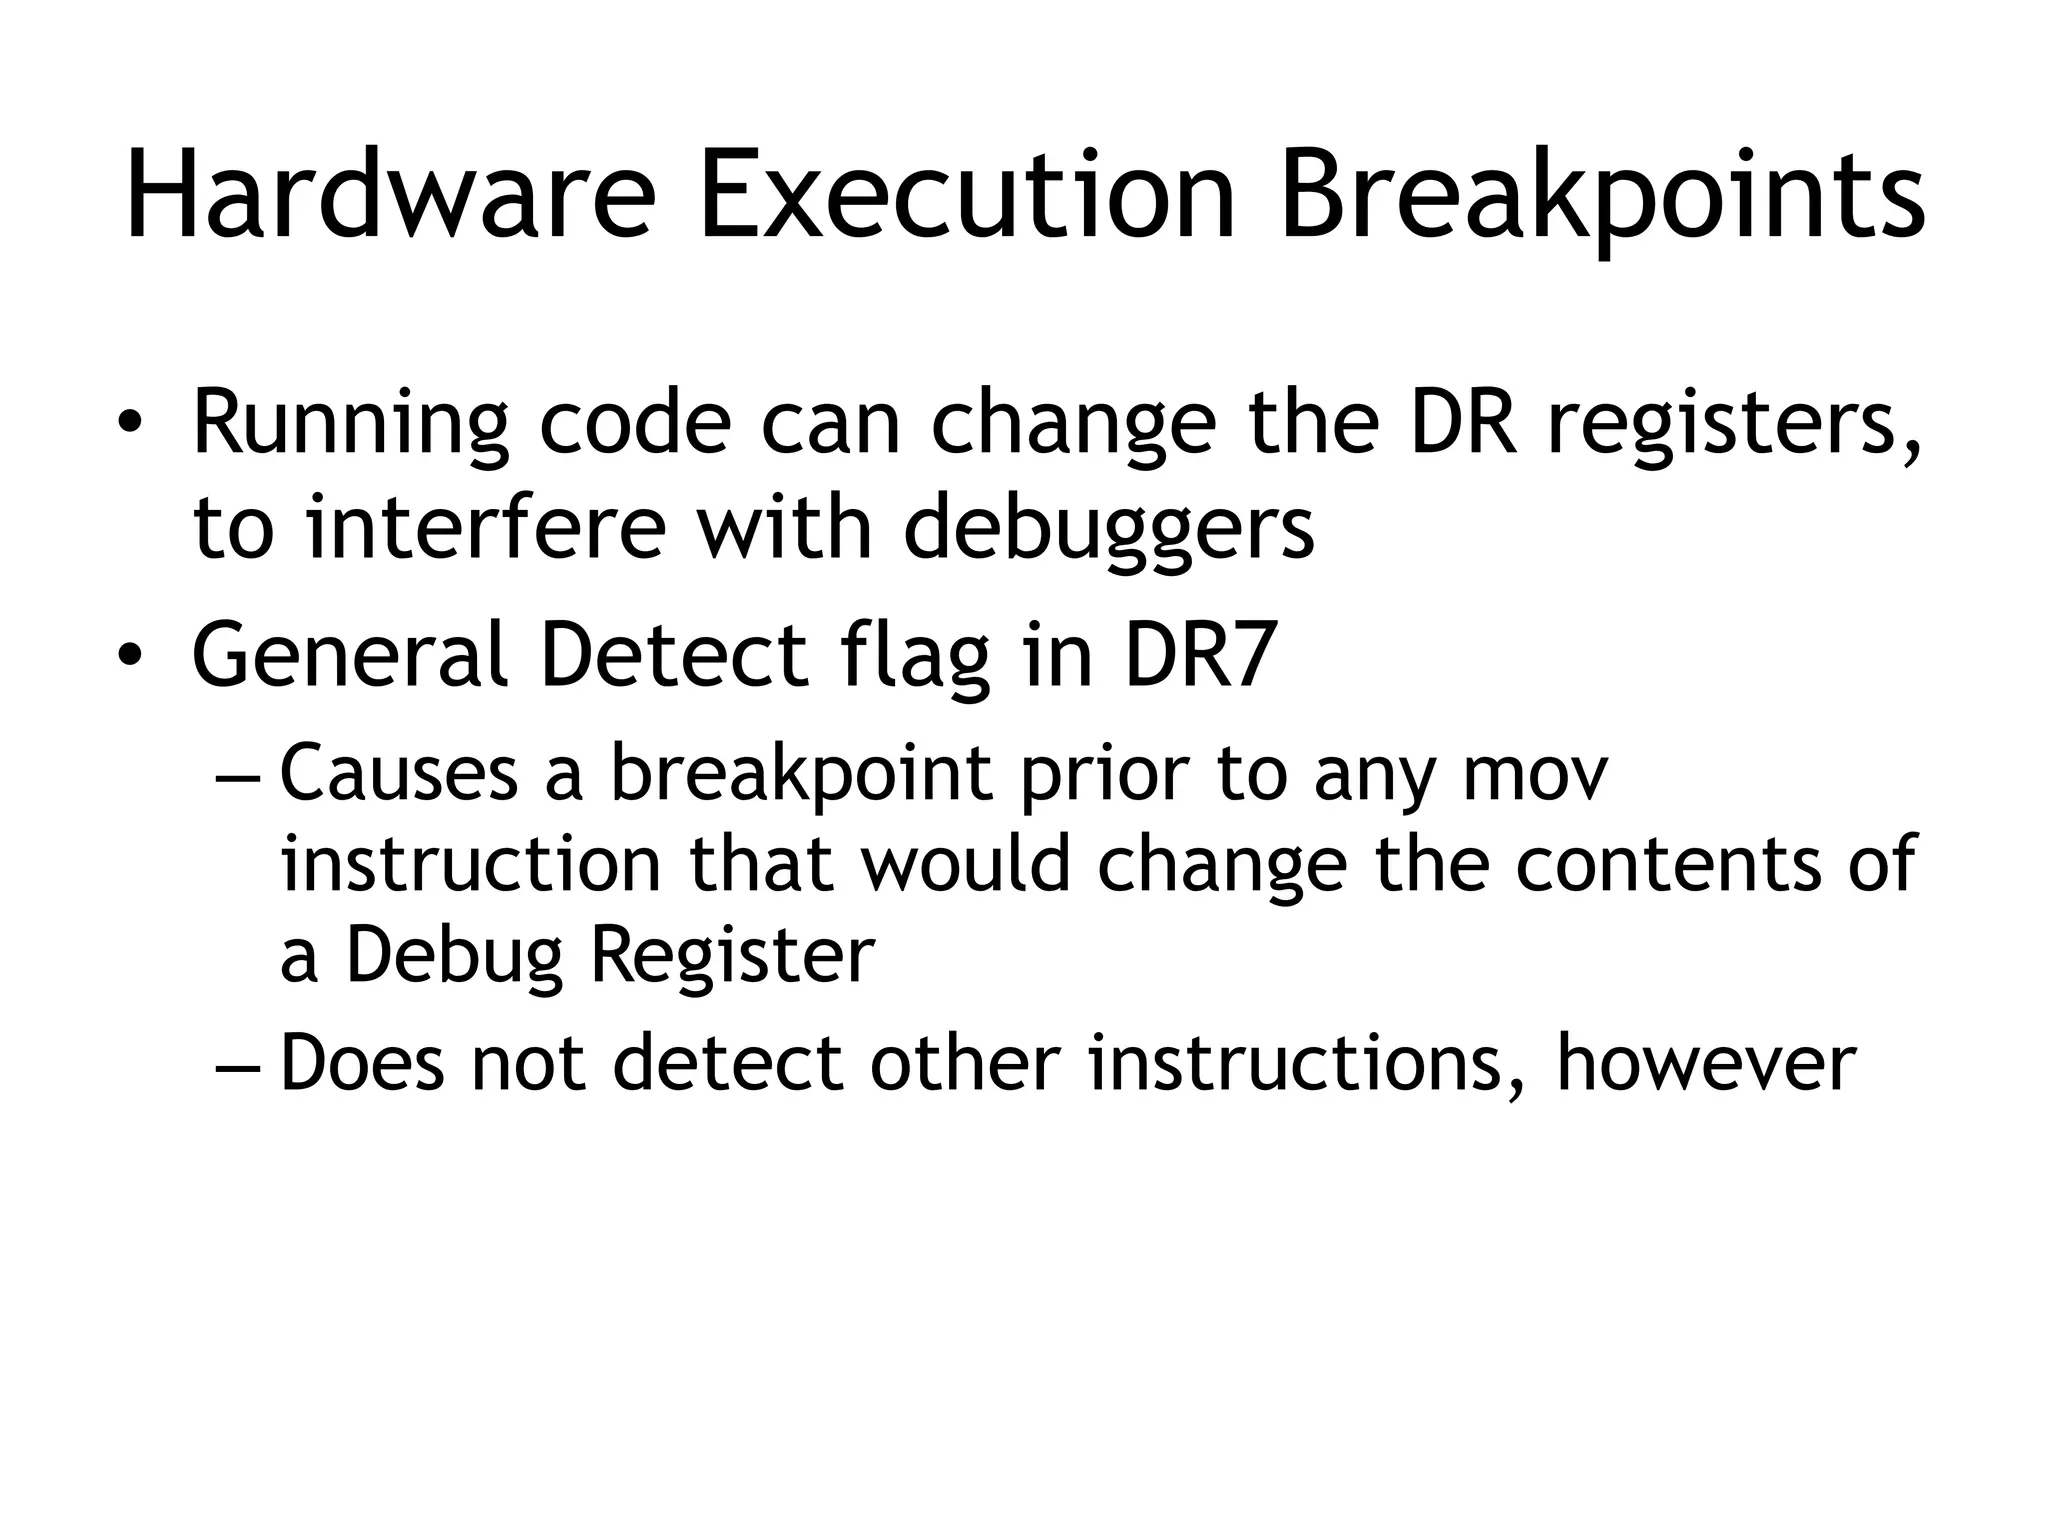

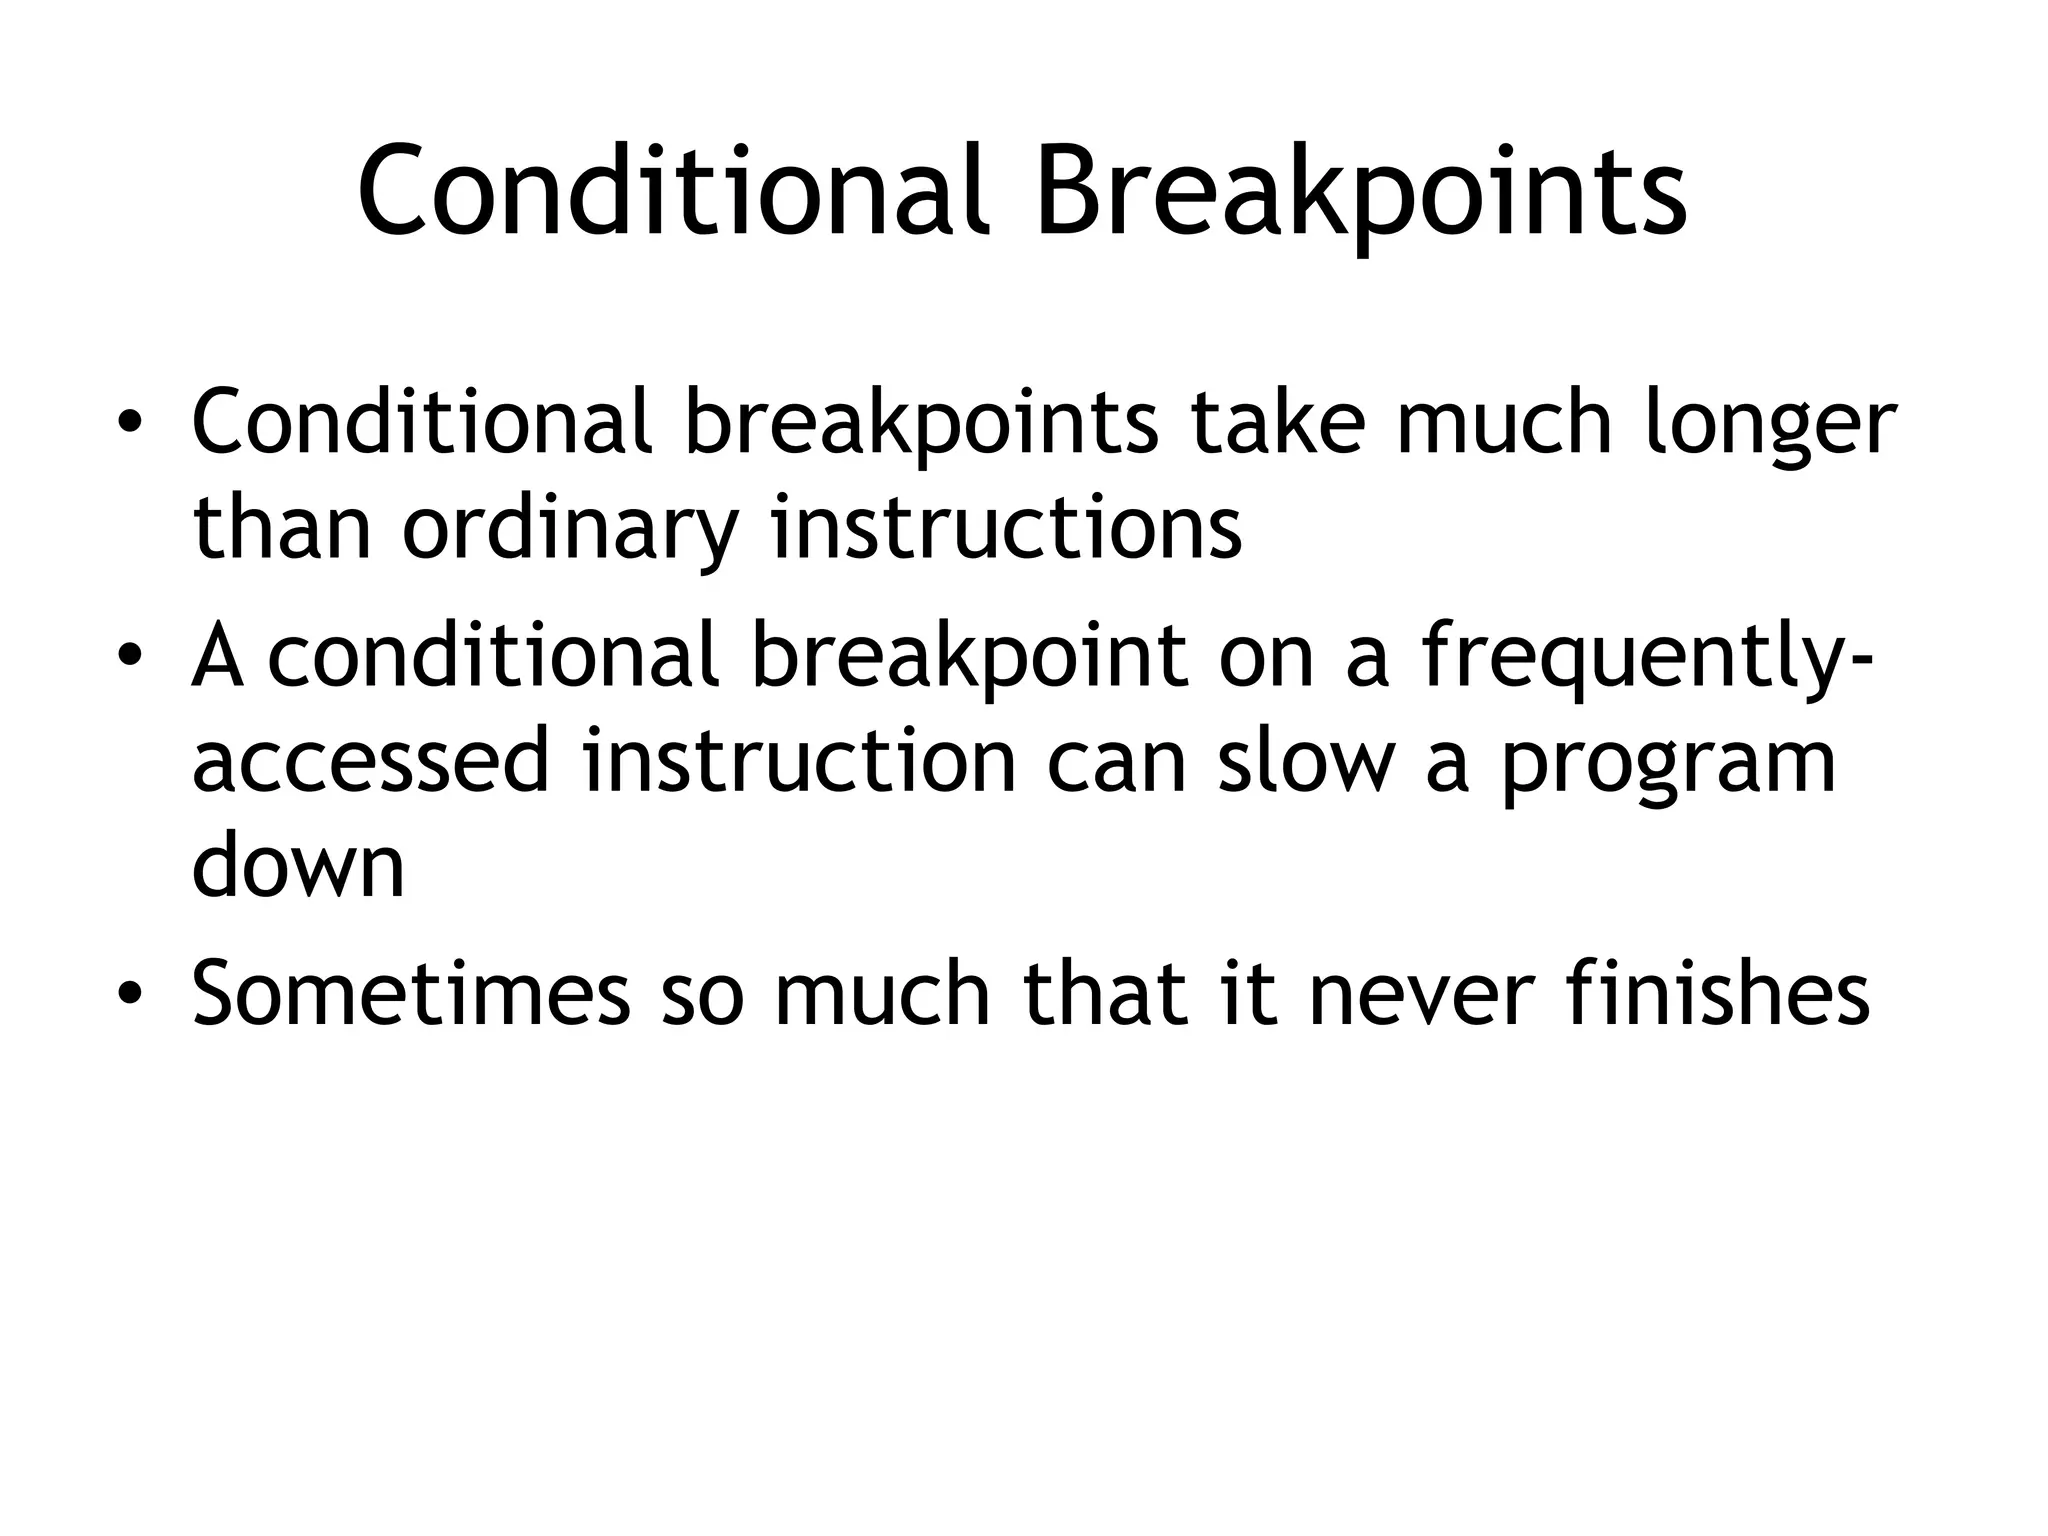


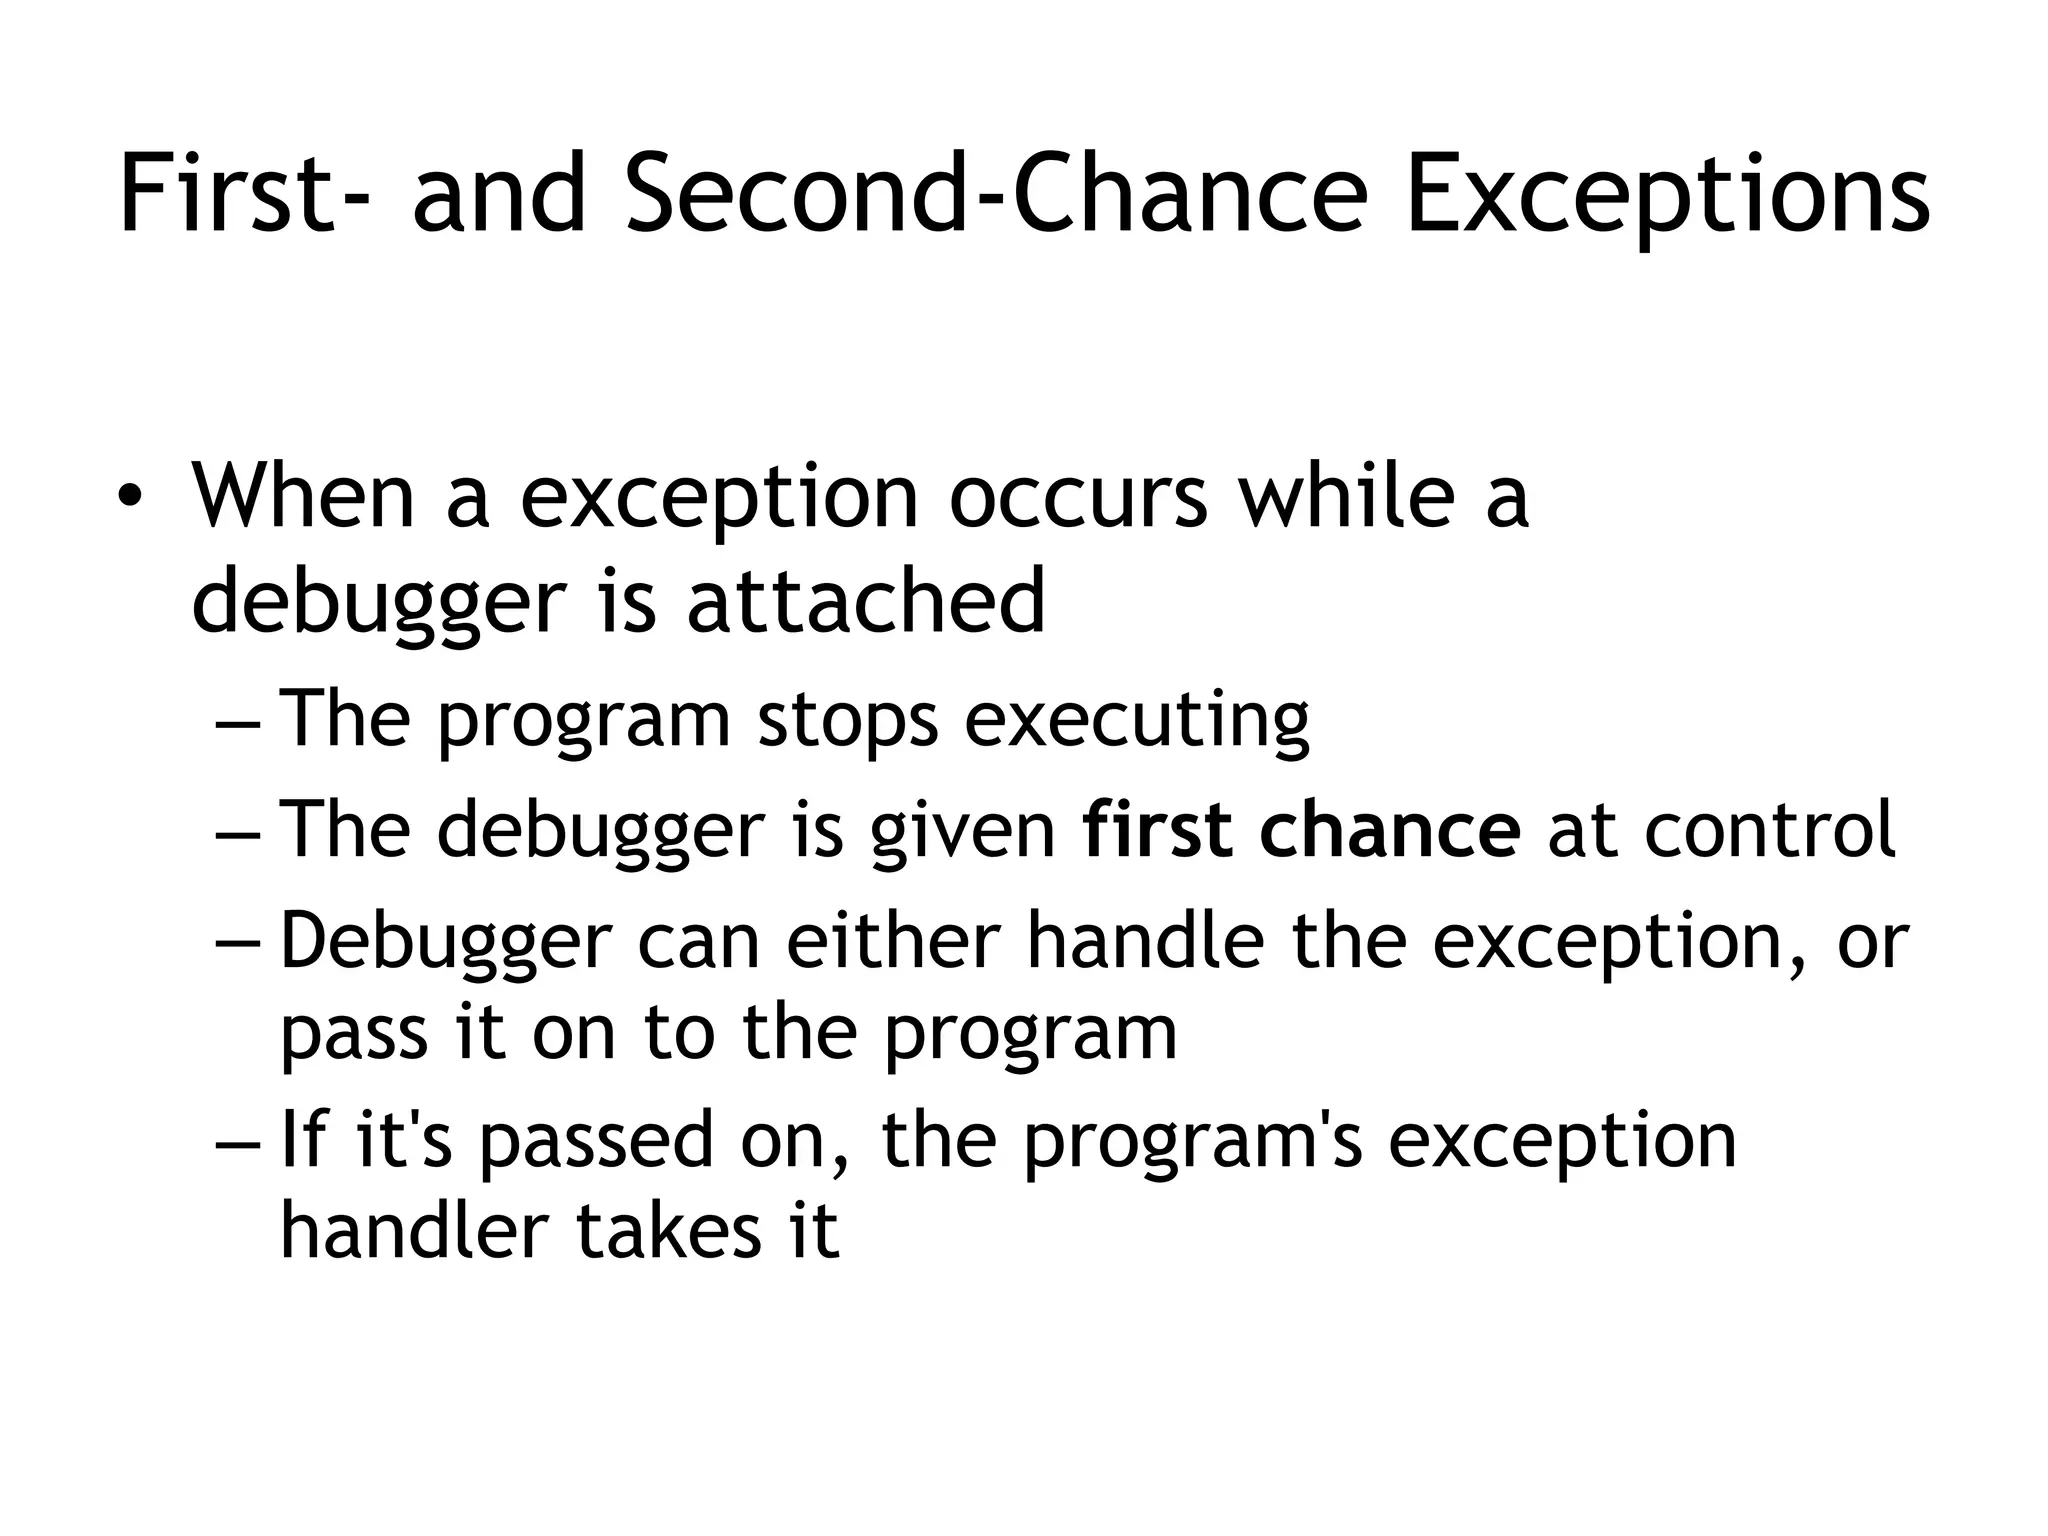
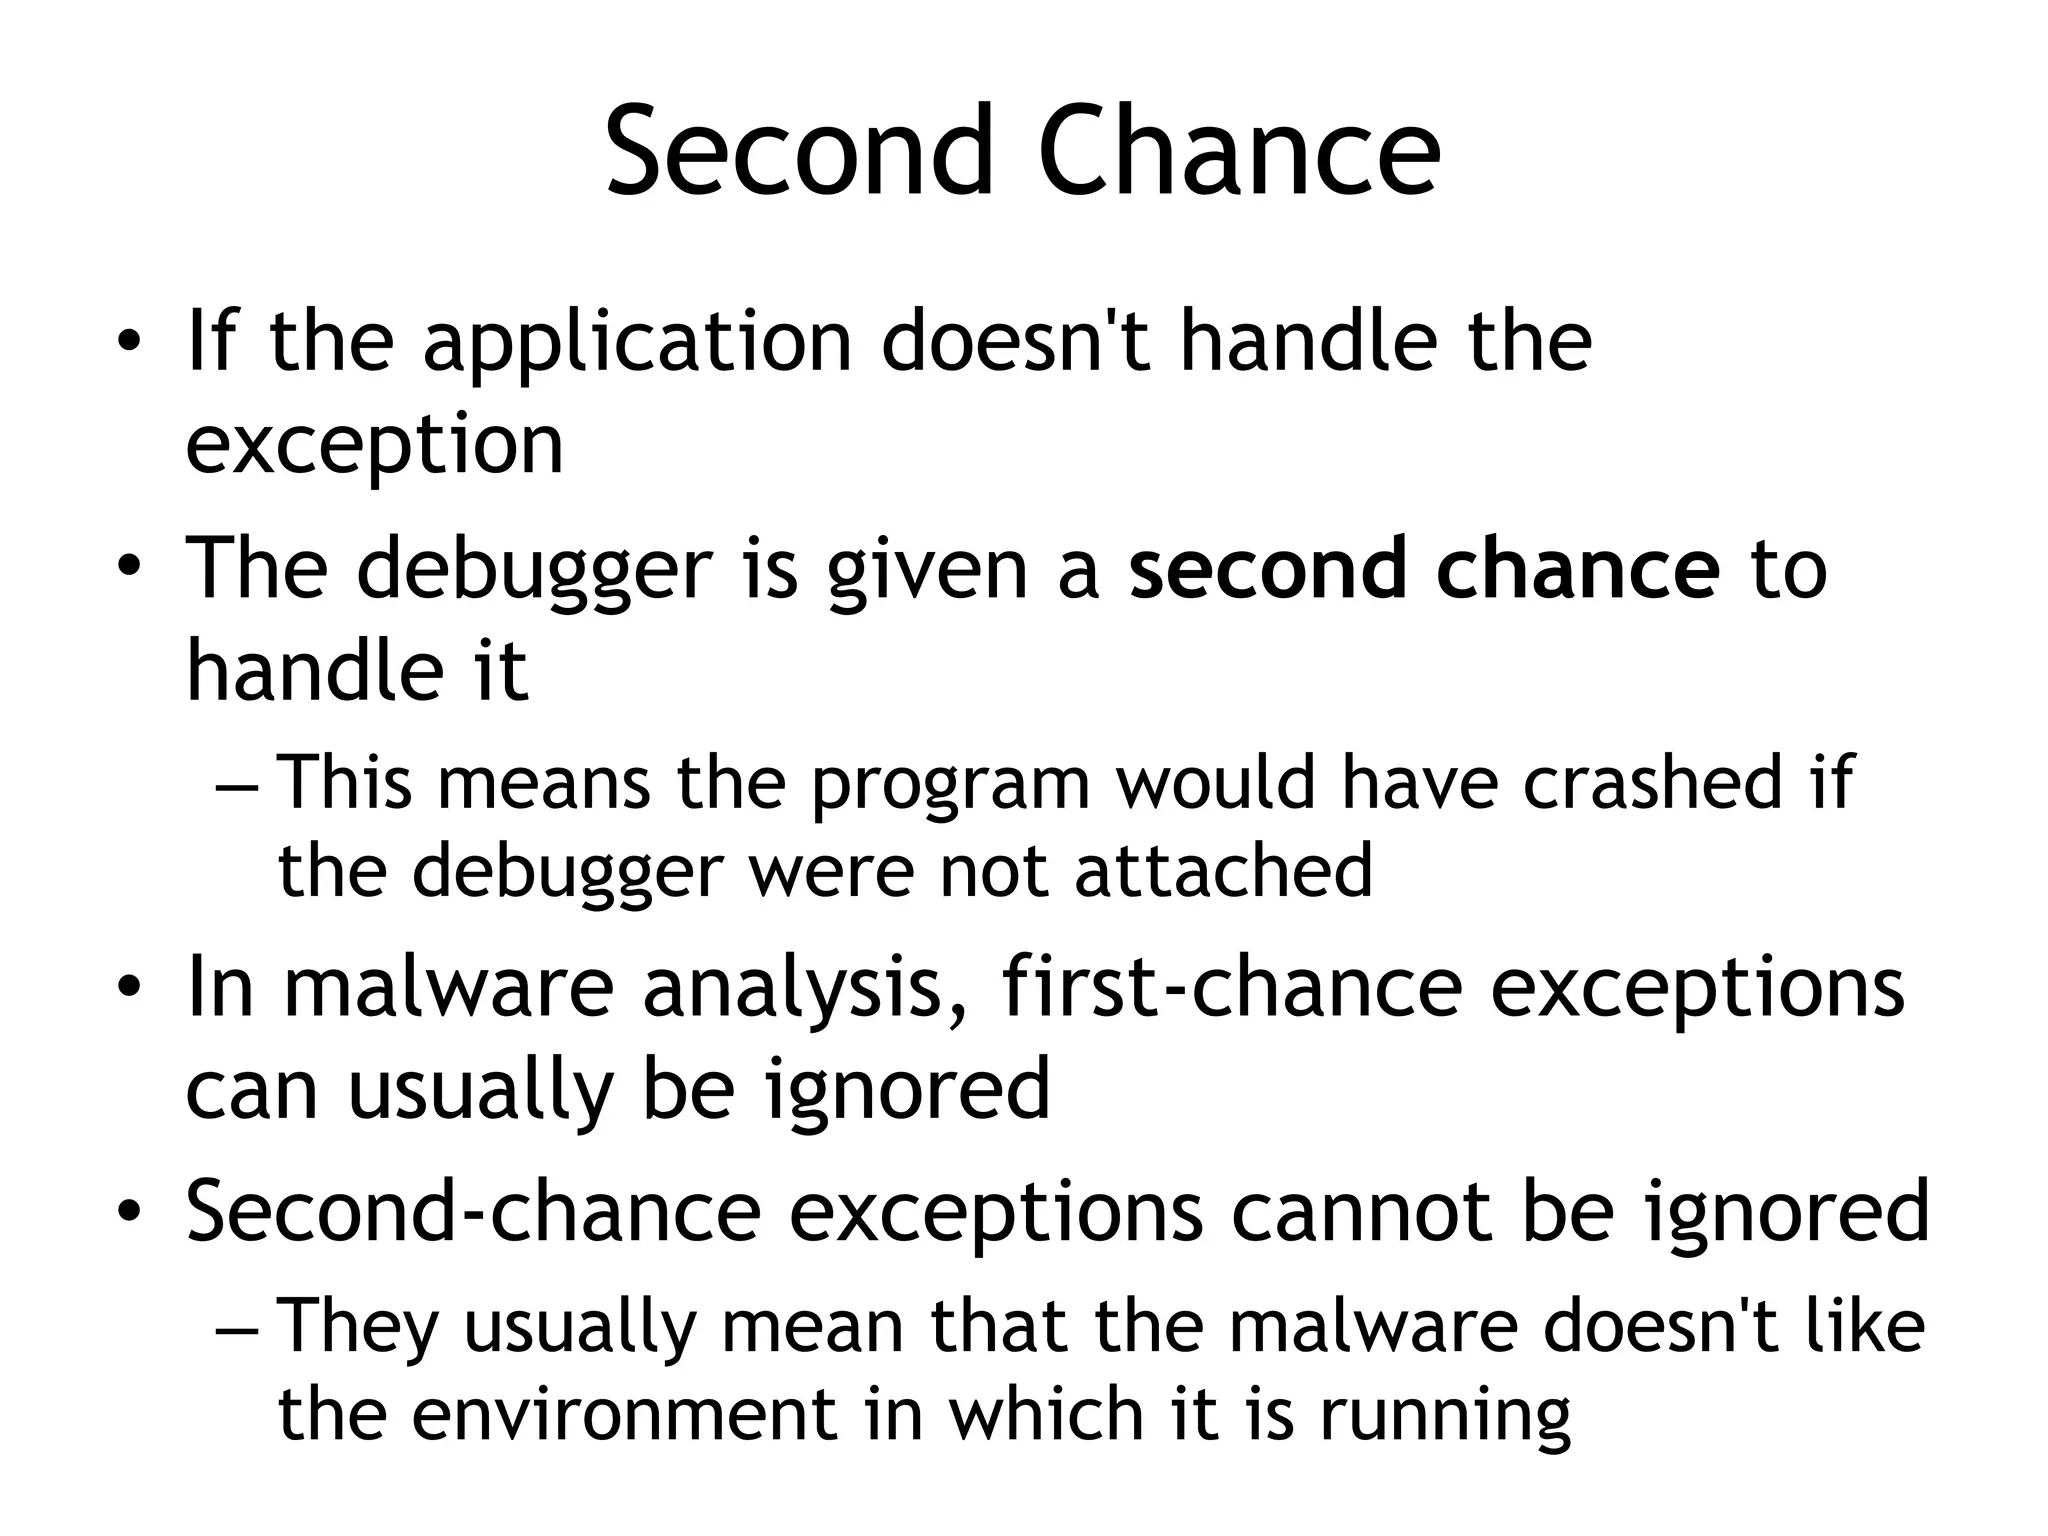


Chapter 8 of 'Practical Malware Analysis' covers the differences between disassemblers and debuggers, highlighting tools like OllyDbg for user-mode debugging and Windbg for kernel-mode debugging. It explains single-stepping, breakpoints, and exceptions, detailing how debuggers manage program execution and the various types of breakpoints that can be set. The chapter emphasizes practical applications of debugging in malware analysis, including modifying execution and handling exceptions.


![ky-thuat-phan-tich-ma-doc__ch9-ollydbg - [cuuduongthancong.com].pdf](https://cdn.slidesharecdn.com/ss_thumbnails/ky-thuat-phan-tich-ma-docch9-ollydbg-cuuduongthancong-251025041339-5128759d-thumbnail.jpg?width=640&height=640&fit=bounds)