How to drive a malware
analyst crazy
MICHAEL BOMAN, MALWARE RESEARCH INSTITUTE
About me
4th year speaking at 44CON
- 2012: Malware as a hobby [P]
- 2013: Controlling a PC using Arduino [WS]
- 2014: Malware analysis as a big data problem [P]
- 2015: Malware anti-reversing [P], Indicators of Compromise [WS]
Malware Researcher, Founder Malware Research Institute
6 kids, one more on the way…
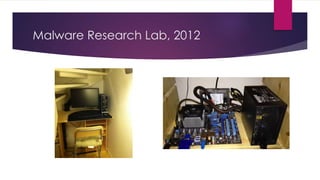
Malware Research Lab, 2012
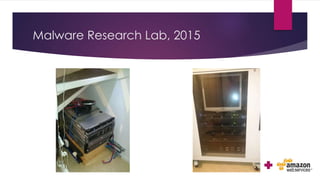
Malware Research Lab, 2015
Disclaimer
 These are the techniques I’ve come across trying to keep malware
researchers out of the game
 Or just waste a heck of a lot time doing quite silly things…
 Not a complete list of techniques
 The techniques discussed are aimed towards a x86/win32 environment
Technique #1: Breakpoints
 INT 3h
 Memory Breakpoints
 Hardware Breakpoints
How INT3 breakpoints work
mov eax, fs:[0x30]
mov eax, [eax + 0x0c] // <- Break here
mov eax, [eax + 0x0c]
mov dword ptr [eax + 0x20], NewSize
How INT3 breakpoints work
mov eax, fs:[0x30]
int 3h [garbage] // <- EP
mov eax, [eax + 0x0c]
mov dword ptr [eax + 0x20], NewSize
How INT3 breakpoints work
mov eax, fs:[0x30]
mov eax, [eax + 0x0c] // <- restored by debugger
mov eax, [eax + 0x0c]
mov dword ptr [eax + 0x20], NewSize
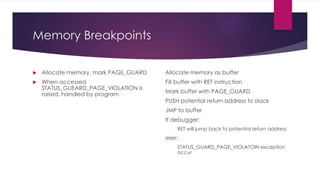
Memory Breakpoints
 Allocate memory, mark PAGE_GUARD
 When accessed
STATUS_GUEARD_PAGE_VIOLATION is
raised, handled by program
Allocate memory as buffer
Fill buffer with RET instruction
Mark buffer with PAGE_GUARD
PUSH potential return address to stack
JMP to buffer
If debugger:
RET will jump back to potential return address
else:
STATUS_GUARD_PAGE_VIOLATOIN exception
occur
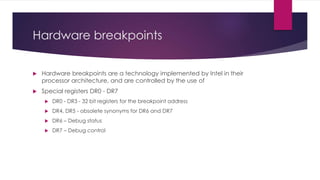
Hardware breakpoints
 Hardware breakpoints are a technology implemented by Intel in their
processor architecture, and are controlled by the use of
 Special registers DR0 - DR7
 DR0 - DR3 - 32 bit registers for the breakpoint address
 DR4, DR5 - obsolete synonyms for DR6 and DR7
 DR6 – Debug status
 DR7 – Debug control
Technique #1: Breakpoints
 INT 3h
 Look for code that scans memory for 0xCC [INT3] and/or 0xCD 0x03 [INT
(immediate) 3]
 Memory Breakpoints
 Look for memory allocations with PAGE_GUARD flag set
 Hardware Breakpoints
 Win32 GetThreadContext and SetThreadContext
 Structured Exception Handling
Technique #2: Timing
 RDTSC (ReaD TimeStampClock)
 Win32 Timing Functions
 GetTickCount
 timeGetTime
 QueryPerformanceCounter
 […]
Technique #2: Timing
 RDTSC (ReaD TimeStampClock)
 Mark RDTSC as a elevated instruction (can then be intercepted and modified)
 Win32 Timing Functions
 Use DLL-injection to overload the function with one that lies nicely in our favour
Please remember to lie consistently to all timing methods.
Technique #3: Windows Internals
 ProcessDebugFlags
 Debug Object Handle
 Thread Hiding
 BlockInput
 OutputDebugString
ProcessDebugFlags
 Pass undocumented class ProcessDebugFlags (0x1f) to the
NtQueryProcessInformation() function.
 When NtQueryProcessInformation is called with the ProcessDebugFlags
class, returns the inverse of EPROCESS -> NoDebugInherit
 FALSE == Debugger present
Debug Object Handle
 Windows XP or later
 When debugged a Debug Object created
 Can be queried using NtQueryInformationProcess
 Originating from kernel -> hard to hide
Thread Hiding
 Windows 2000 and later
 HideThreadFromDebugger class, passed into NtSetInformationThread,
 The class prevents debuggers from receiving events from any thread that
has had NtSetInformationThread with the HideThreadFromDebugger class
called on it.
 These events include breakpoints, and the exiting of the program if it is
called on the main thread of an application.
BlockInput
 BlockInput() blocks mouse and keyboard messages from reaching the
desired application
 Only the thread that called BlockInput can call it to remove the block
 Not really Anti-RE, but can mess with you
OutputDebugString
 Call OutputDebugString()
 GetLastError()
 No error == debugger present
Technique #3: Windows Internals
 ProcessDebugFlags
 Check NtQueryProcessInformation() calls for [undocumented] ProcessDebugFlags (0x1f) object
 Hook NtQueryProcessInformation(), lie about the ProcessDebugFlags value
 Debug Object Handle
 Hook NtQueryInformationProcess(), remove any links to debug objects
 Thread Hiding
 Remove any HideThreadFromDebugger class passed into NtSetInformationThread
 BlockInput
 Hook it to a NO-OP
 OutputDebugString
 Hook it to always return error
Technique #4: Process Exploitation
 Open Process
 Parent Process
 Self-Debugging
 UnhandledExceptionFilter
 NtQueryObject
Open Process
 Debugger not properly resets process privileges
 Open privileged process like csrss.exe
 If succeed we are running under a debugger
Parent Process
 Check if GetParentProcessId() and GetExplorerPIDbyShellWindow()) is the
same
 Or however you are expecting your malware to be executed
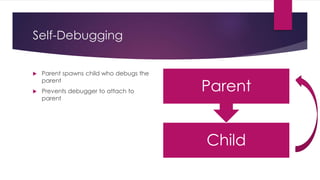
Self-Debugging
 Parent spawns child who debugs the
parent
 Prevents debugger to attach to
parent
Child
Parent
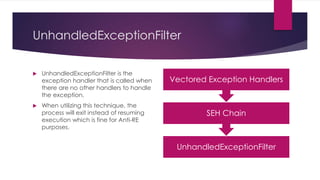
UnhandledExceptionFilter
 UnhandledExceptionFilter is the
exception handler that is called when
there are no other handlers to handle
the exception.
 When utilizing this technique, the
process will exit instead of resuming
execution which is fine for Anti-RE
purposes.
UnhandledExceptionFilter
SEH Chain
Vectored Exception Handlers
NtQueryObject
 NtQueryObject() called with ObjectAllTypesInformation class, returns
information about the host system and the current process including
DebugObjects in the environment.
 ObjectAllTypesInformation can be traversed to locate DebugObjects
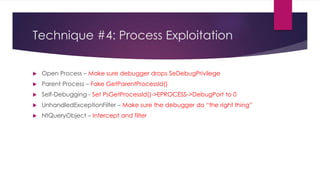
Technique #4: Process Exploitation
 Open Process – Make sure debugger drops SeDebugPrivilege
 Parent Process – Fake GetParentProcessId()
 Self-Debugging - Set PsGetProcessId()->EPROCESS->DebugPort to 0
 UnhandledExceptionFilter – Make sure the debugger do “the right thing”
 NtQueryObject – Intercept and filter
Technique #5: Anti-dumping
 Nanomites
 Stolen Bytes (Stolen Code)
 SizeOfImage
 Virtual Machines
 Guard Pages
 Removing the PE Header
Nanomites
 Replace JUMP (Jxx) instructions with INT 3h breakpoints
 Store original JUMP (Jxx) instruction in an encrypted table
 Use self-debugging, debugger process will substitute the INT 3h code with
the correct JUMP instruction depending on encryption algorithm.
 Put some stray INT 3h in the execution flow and you have made a real
mess
Stolen Bytes (Stolen Code)
 Code or bytes from the original process protected by the packer are
copied and encrypted somewhere inside the packing code
 The original (copied) code is replaced with jumps to a dynamic allocated
buffer for the decrypted bytes and then jumps back to the original flow
SizeOfImage
 Modifying PE -> IMAGE_OPTION_HEADER -> SizeOfImage can cause
problems for tools that weren't developed to handle this problem.
Virtual Machines (think JVM, not VBox)
 Protectors like Themida and VMProtect already use virtual machines in
their protection schemes.
 Themida uses a technology that creates a unique virtual machine for
every protected executable
 Prevents the use of a generic attack against its virtualization protection
 Many protection schemes implement junk code instructions
Guard Pages
 Discussed earlier
 Can be used for an on-demand decryption/decompression system
 Mark all pages that were not immediately needed as guard pages
 When accessed, an EXCEPTION_GUARD_PAGE exception will be raised
 Additional data can be decrypted or decompressed either from file or
memory.
Removing the PE Header
 Removes an executable's portable executable from memory at runtime
 A dumped image would be missing important information such as the RVA
(Relative Virtual Address) of important tables (Reloc, Import, Export etc..),
the entry point, and other information that the Windows loader needs to
utilize when loading an image
Technique #5: Anti-dumping
 Nanomites
 Stolen Bytes (Stolen Code)
 SizeOfImage
 Virtual Machines
 Guard Pages
 Removing the PE Header
Technique #6: Exploiting IA-32 Instructions
 Interrupt 2D
 Stack Segment
 Instruction Prefixes
Interrupt 2D
 INT 2D instruction can be used as a debugger detection method
 When executed
 No Debugger Present -> Exception
 Debugger Present -> No Exception
 Debugger specific
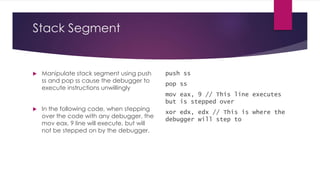
Stack Segment
 Manipulate stack segment using push
ss and pop ss cause the debugger to
execute instructions unwillingly
 In the following code, when stepping
over the code with any debugger, the
mov eax, 9 line will execute, but will
not be stepped on by the debugger.
push ss
pop ss
mov eax, 9 // This line executes
but is stepped over
xor edx, edx // This is where the
debugger will step to
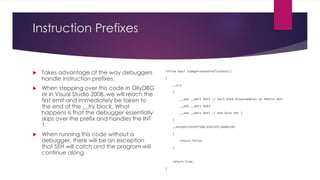
Instruction Prefixes
 Takes advantage of the way debuggers
handle instruction prefixes.
 When stepping over this code in OllyDBG
or in Visual Studio 2008, we will reach the
first emit and immediately be taken to
the end of the __try block. What
happens is that the debugger essentially
skips over the prefix and handles the INT
1.
 When running this code without a
debugger, there will be an exception
that SEH will catch and the program will
continue along.
inline bool IsDbgPresentPrefixCheck()
{
__try
{
__asm __emit 0xF3 // 0xF3 0x64 disassembles as PREFIX REP:
__asm __emit 0x64
__asm __emit 0xF1 // One byte INT 1
}
__except(EXCEPTION_EXECUTE_HANDLER)
{
return false;
}
return true;
}
Technique #6: Exploiting IA-32
Instructions
 Interrupt 2D
 Stack Segment
 Instruction Prefixes
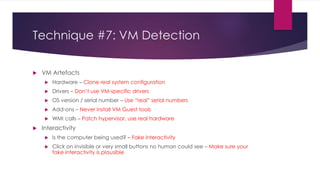
Technique #7: VM Detection
 VM Artefacts
 Hardware
 Drivers
 OS version / serial number
 Add-ons
 WMI calls
 Interactivity
 Is the computer being used?
 Click on invisible or very small buttons no human could see
Technique #7: VM Detection
 VM Artefacts
 Hardware – Clone real system configuration
 Drivers – Don’t use VM-specific drivers
 OS version / serial number – Use ”real” serial numbers
 Add-ons – Never install VM Guest tools
 WMI calls – Patch hypervisor, use real hardware
 Interactivity
 Is the computer being used? – Fake interactivity
 Click on invisible or very small buttons no human could see – Make sure your
fake interactivity is plausible
Debugger specific techniques
 OllyDBG
 FindWindow
 OutputDebugString Exploit
 WinDBG
 FindWindow
 Cuckoo Sandbox
 Check if hooked
Debugger specific techniques
 OllyDBG
 FindWindow – Hijack function call or modify OllyDBG binary
 OutputDebugString Exploit – Run patched version
 WinDBG
 FindWindow – Hijack function call or modify WinDBG binary
 Cuckoo Sandbox
 Check if hooked – Run unhooked, patch the hook-check function
Other Techniques
 Junk Code
 Native Code Permutations
Other Techniques
 Junk Code
 Native Code Permutations
Unfortunately there are no quick-fixes for these techniques
Announcement
Riddle
Announcement
 Public VXCage-server
 Available at vxcage.malwareresearch.institute (http, soon https)
 Feel free to apply for a personal account, free of charge:
 TO: michael@michaelboman.org
 SUBJECT: VXCage Access
 BODY:
 Who you are: name, twitter handle (if any, for cyberstalking), other contact info
 Why you want access
 Proposed username for the system (the password will be generated for you)
 Please contact me at the above address for raw access to the archive
VXCage API: Quick intro
 REST with JSON output
 /malware/add – upload sample
 /malware/get/<sha256> - download sample
 /malware/find – search sample based on hash, date, tag
 /tags/list – list tags
 Docs & Source code at https://github.com/mboman/vxcage
Thank you
 Michael Boman (@mboman)
 michael@michaelboman.org (soon also
michael.boman@malwareresearch.institute)
 Malware repository: vxcage.malwareresearch.institute
 Malware blog: blog.malwareresearch.institute

How to drive a malware analyst crazy

  • 1.
    How to drivea malware analyst crazy MICHAEL BOMAN, MALWARE RESEARCH INSTITUTE
  • 2.
    About me 4th yearspeaking at 44CON - 2012: Malware as a hobby [P] - 2013: Controlling a PC using Arduino [WS] - 2014: Malware analysis as a big data problem [P] - 2015: Malware anti-reversing [P], Indicators of Compromise [WS] Malware Researcher, Founder Malware Research Institute 6 kids, one more on the way…
  • 3.
  • 4.
  • 5.
    Disclaimer  These arethe techniques I’ve come across trying to keep malware researchers out of the game  Or just waste a heck of a lot time doing quite silly things…  Not a complete list of techniques  The techniques discussed are aimed towards a x86/win32 environment
  • 6.
    Technique #1: Breakpoints INT 3h  Memory Breakpoints  Hardware Breakpoints
  • 7.
    How INT3 breakpointswork mov eax, fs:[0x30] mov eax, [eax + 0x0c] // <- Break here mov eax, [eax + 0x0c] mov dword ptr [eax + 0x20], NewSize
  • 8.
    How INT3 breakpointswork mov eax, fs:[0x30] int 3h [garbage] // <- EP mov eax, [eax + 0x0c] mov dword ptr [eax + 0x20], NewSize
  • 9.
    How INT3 breakpointswork mov eax, fs:[0x30] mov eax, [eax + 0x0c] // <- restored by debugger mov eax, [eax + 0x0c] mov dword ptr [eax + 0x20], NewSize
  • 10.
    Memory Breakpoints  Allocatememory, mark PAGE_GUARD  When accessed STATUS_GUEARD_PAGE_VIOLATION is raised, handled by program Allocate memory as buffer Fill buffer with RET instruction Mark buffer with PAGE_GUARD PUSH potential return address to stack JMP to buffer If debugger: RET will jump back to potential return address else: STATUS_GUARD_PAGE_VIOLATOIN exception occur
  • 11.
    Hardware breakpoints  Hardwarebreakpoints are a technology implemented by Intel in their processor architecture, and are controlled by the use of  Special registers DR0 - DR7  DR0 - DR3 - 32 bit registers for the breakpoint address  DR4, DR5 - obsolete synonyms for DR6 and DR7  DR6 – Debug status  DR7 – Debug control
  • 12.
    Technique #1: Breakpoints INT 3h  Look for code that scans memory for 0xCC [INT3] and/or 0xCD 0x03 [INT (immediate) 3]  Memory Breakpoints  Look for memory allocations with PAGE_GUARD flag set  Hardware Breakpoints  Win32 GetThreadContext and SetThreadContext  Structured Exception Handling
  • 13.
    Technique #2: Timing RDTSC (ReaD TimeStampClock)  Win32 Timing Functions  GetTickCount  timeGetTime  QueryPerformanceCounter  […]
  • 14.
    Technique #2: Timing RDTSC (ReaD TimeStampClock)  Mark RDTSC as a elevated instruction (can then be intercepted and modified)  Win32 Timing Functions  Use DLL-injection to overload the function with one that lies nicely in our favour Please remember to lie consistently to all timing methods.
  • 15.
    Technique #3: WindowsInternals  ProcessDebugFlags  Debug Object Handle  Thread Hiding  BlockInput  OutputDebugString
  • 16.
    ProcessDebugFlags  Pass undocumentedclass ProcessDebugFlags (0x1f) to the NtQueryProcessInformation() function.  When NtQueryProcessInformation is called with the ProcessDebugFlags class, returns the inverse of EPROCESS -> NoDebugInherit  FALSE == Debugger present
  • 17.
    Debug Object Handle Windows XP or later  When debugged a Debug Object created  Can be queried using NtQueryInformationProcess  Originating from kernel -> hard to hide
  • 18.
    Thread Hiding  Windows2000 and later  HideThreadFromDebugger class, passed into NtSetInformationThread,  The class prevents debuggers from receiving events from any thread that has had NtSetInformationThread with the HideThreadFromDebugger class called on it.  These events include breakpoints, and the exiting of the program if it is called on the main thread of an application.
  • 19.
    BlockInput  BlockInput() blocksmouse and keyboard messages from reaching the desired application  Only the thread that called BlockInput can call it to remove the block  Not really Anti-RE, but can mess with you
  • 20.
    OutputDebugString  Call OutputDebugString() GetLastError()  No error == debugger present
  • 21.
    Technique #3: WindowsInternals  ProcessDebugFlags  Check NtQueryProcessInformation() calls for [undocumented] ProcessDebugFlags (0x1f) object  Hook NtQueryProcessInformation(), lie about the ProcessDebugFlags value  Debug Object Handle  Hook NtQueryInformationProcess(), remove any links to debug objects  Thread Hiding  Remove any HideThreadFromDebugger class passed into NtSetInformationThread  BlockInput  Hook it to a NO-OP  OutputDebugString  Hook it to always return error
  • 22.
    Technique #4: ProcessExploitation  Open Process  Parent Process  Self-Debugging  UnhandledExceptionFilter  NtQueryObject
  • 23.
    Open Process  Debuggernot properly resets process privileges  Open privileged process like csrss.exe  If succeed we are running under a debugger
  • 24.
    Parent Process  Checkif GetParentProcessId() and GetExplorerPIDbyShellWindow()) is the same  Or however you are expecting your malware to be executed
  • 25.
    Self-Debugging  Parent spawnschild who debugs the parent  Prevents debugger to attach to parent Child Parent
  • 26.
    UnhandledExceptionFilter  UnhandledExceptionFilter isthe exception handler that is called when there are no other handlers to handle the exception.  When utilizing this technique, the process will exit instead of resuming execution which is fine for Anti-RE purposes. UnhandledExceptionFilter SEH Chain Vectored Exception Handlers
  • 27.
    NtQueryObject  NtQueryObject() calledwith ObjectAllTypesInformation class, returns information about the host system and the current process including DebugObjects in the environment.  ObjectAllTypesInformation can be traversed to locate DebugObjects
  • 28.
    Technique #4: ProcessExploitation  Open Process – Make sure debugger drops SeDebugPrivilege  Parent Process – Fake GetParentProcessId()  Self-Debugging - Set PsGetProcessId()->EPROCESS->DebugPort to 0  UnhandledExceptionFilter – Make sure the debugger do “the right thing”  NtQueryObject – Intercept and filter
  • 29.
    Technique #5: Anti-dumping Nanomites  Stolen Bytes (Stolen Code)  SizeOfImage  Virtual Machines  Guard Pages  Removing the PE Header
  • 30.
    Nanomites  Replace JUMP(Jxx) instructions with INT 3h breakpoints  Store original JUMP (Jxx) instruction in an encrypted table  Use self-debugging, debugger process will substitute the INT 3h code with the correct JUMP instruction depending on encryption algorithm.  Put some stray INT 3h in the execution flow and you have made a real mess
  • 31.
    Stolen Bytes (StolenCode)  Code or bytes from the original process protected by the packer are copied and encrypted somewhere inside the packing code  The original (copied) code is replaced with jumps to a dynamic allocated buffer for the decrypted bytes and then jumps back to the original flow
  • 32.
    SizeOfImage  Modifying PE-> IMAGE_OPTION_HEADER -> SizeOfImage can cause problems for tools that weren't developed to handle this problem.
  • 33.
    Virtual Machines (thinkJVM, not VBox)  Protectors like Themida and VMProtect already use virtual machines in their protection schemes.  Themida uses a technology that creates a unique virtual machine for every protected executable  Prevents the use of a generic attack against its virtualization protection  Many protection schemes implement junk code instructions
  • 34.
    Guard Pages  Discussedearlier  Can be used for an on-demand decryption/decompression system  Mark all pages that were not immediately needed as guard pages  When accessed, an EXCEPTION_GUARD_PAGE exception will be raised  Additional data can be decrypted or decompressed either from file or memory.
  • 35.
    Removing the PEHeader  Removes an executable's portable executable from memory at runtime  A dumped image would be missing important information such as the RVA (Relative Virtual Address) of important tables (Reloc, Import, Export etc..), the entry point, and other information that the Windows loader needs to utilize when loading an image
  • 36.
    Technique #5: Anti-dumping Nanomites  Stolen Bytes (Stolen Code)  SizeOfImage  Virtual Machines  Guard Pages  Removing the PE Header
  • 37.
    Technique #6: ExploitingIA-32 Instructions  Interrupt 2D  Stack Segment  Instruction Prefixes
  • 38.
    Interrupt 2D  INT2D instruction can be used as a debugger detection method  When executed  No Debugger Present -> Exception  Debugger Present -> No Exception  Debugger specific
  • 39.
    Stack Segment  Manipulatestack segment using push ss and pop ss cause the debugger to execute instructions unwillingly  In the following code, when stepping over the code with any debugger, the mov eax, 9 line will execute, but will not be stepped on by the debugger. push ss pop ss mov eax, 9 // This line executes but is stepped over xor edx, edx // This is where the debugger will step to
  • 40.
    Instruction Prefixes  Takesadvantage of the way debuggers handle instruction prefixes.  When stepping over this code in OllyDBG or in Visual Studio 2008, we will reach the first emit and immediately be taken to the end of the __try block. What happens is that the debugger essentially skips over the prefix and handles the INT 1.  When running this code without a debugger, there will be an exception that SEH will catch and the program will continue along. inline bool IsDbgPresentPrefixCheck() { __try { __asm __emit 0xF3 // 0xF3 0x64 disassembles as PREFIX REP: __asm __emit 0x64 __asm __emit 0xF1 // One byte INT 1 } __except(EXCEPTION_EXECUTE_HANDLER) { return false; } return true; }
  • 41.
    Technique #6: ExploitingIA-32 Instructions  Interrupt 2D  Stack Segment  Instruction Prefixes
  • 42.
    Technique #7: VMDetection  VM Artefacts  Hardware  Drivers  OS version / serial number  Add-ons  WMI calls  Interactivity  Is the computer being used?  Click on invisible or very small buttons no human could see
  • 43.
    Technique #7: VMDetection  VM Artefacts  Hardware – Clone real system configuration  Drivers – Don’t use VM-specific drivers  OS version / serial number – Use ”real” serial numbers  Add-ons – Never install VM Guest tools  WMI calls – Patch hypervisor, use real hardware  Interactivity  Is the computer being used? – Fake interactivity  Click on invisible or very small buttons no human could see – Make sure your fake interactivity is plausible
  • 44.
    Debugger specific techniques OllyDBG  FindWindow  OutputDebugString Exploit  WinDBG  FindWindow  Cuckoo Sandbox  Check if hooked
  • 45.
    Debugger specific techniques OllyDBG  FindWindow – Hijack function call or modify OllyDBG binary  OutputDebugString Exploit – Run patched version  WinDBG  FindWindow – Hijack function call or modify WinDBG binary  Cuckoo Sandbox  Check if hooked – Run unhooked, patch the hook-check function
  • 46.
    Other Techniques  JunkCode  Native Code Permutations
  • 47.
    Other Techniques  JunkCode  Native Code Permutations Unfortunately there are no quick-fixes for these techniques
  • 48.
  • 49.
    Announcement  Public VXCage-server Available at vxcage.malwareresearch.institute (http, soon https)  Feel free to apply for a personal account, free of charge:  TO: michael@michaelboman.org  SUBJECT: VXCage Access  BODY:  Who you are: name, twitter handle (if any, for cyberstalking), other contact info  Why you want access  Proposed username for the system (the password will be generated for you)  Please contact me at the above address for raw access to the archive
  • 50.
    VXCage API: Quickintro  REST with JSON output  /malware/add – upload sample  /malware/get/<sha256> - download sample  /malware/find – search sample based on hash, date, tag  /tags/list – list tags  Docs & Source code at https://github.com/mboman/vxcage
  • 51.
    Thank you  MichaelBoman (@mboman)  michael@michaelboman.org (soon also michael.boman@malwareresearch.institute)  Malware repository: vxcage.malwareresearch.institute  Malware blog: blog.malwareresearch.institute