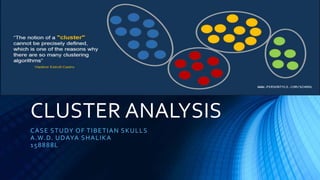
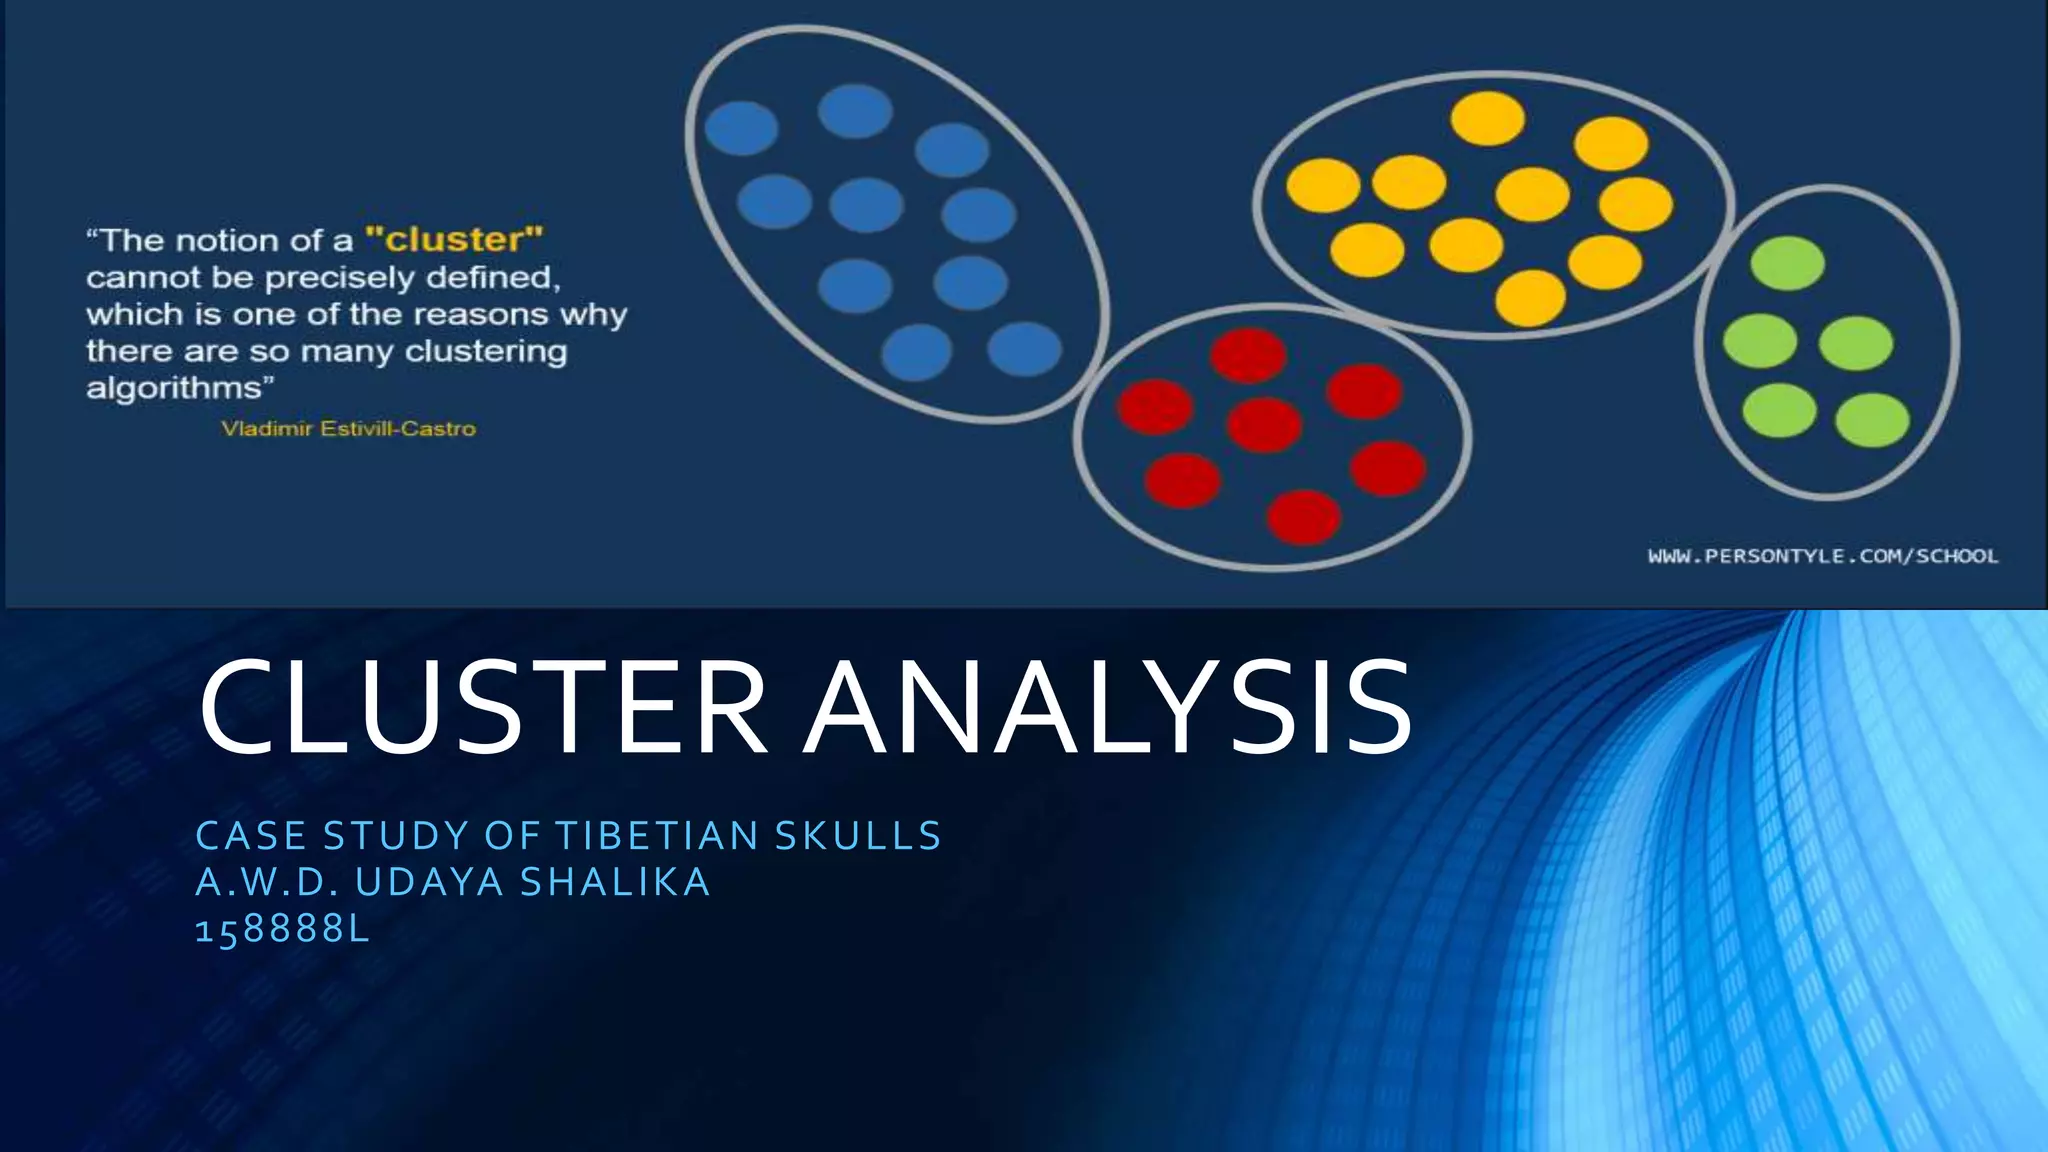
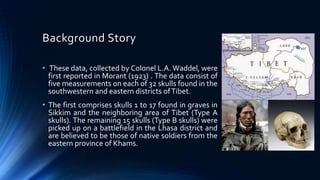
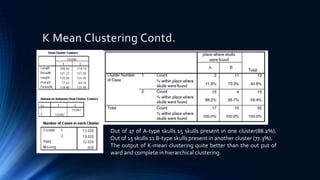
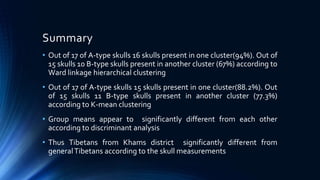
SlideShare a Scribd company logo
CLUSTER ANALYSIS
CASE STUDY OF TIBETIAN SKULLS
A.W.D. UDAYA SHALIKA
158888L
Overview
• What is cluster analysis?
• Why Cluster Analysis
• Clustering Methods
• Analysis
Background of Data
Objectives
Hierarchical Clustering
K mean Clustering
Validation
What is cluster analysis?
• What this means?
When plotted geometrically,
objects within clusters should be
very close together and clusters
will be far apart.
• Clusters should exhibit high
internal homogeneity and high
external heterogeneity
Cluster analysis is a multivariate data mining technique whose goal is to
groups objects based on a set of user selected characteristics
Why Cluster Analysis
Cluster analysis is a major tool in a number of applications in many fields
of Business, Engineering & etc.(The odoridis and Koutroubas, 1999):
• Data reduction.
• Hypothesis generation.
• Hypothesis testing.
• Prediction based on groups.
Cluster Analysis – Classification
Clustering
Hierarchical clustering
Divisive
Agglomerative
Partitional clustering
K-means
Fuzzy K-means
Isodata
Density based
clustering
Denclust
CLUPOT
SVC
Parzen-
Watershed
Grid based clustering
STING
CLIQUE
Background Story
• These data, collected by Colonel L.A. Waddel, were
first reported in Morant (1923) . The data consist of
five measurements on each of 32 skulls found in the
southwestern and eastern districts ofTibet.
• The first comprises skulls 1 to 17 found in graves in
Sikkim and the neighboring area of Tibet (Type A
skulls). The remaining 15 skulls (Type B skulls) were
picked up on a battlefield in the Lhasa district and
are believed to be those of native soldiers from the
eastern province of Khams.
Objective
Hypothesis test:
Tibetans from Khams might be survivors of a particular human type,
unrelated to the Mongolian and Indian types that surrounded them.
• Greatest length of skull (Length)
• Greatest horizontal breadth of skull (Breadth)
• Height of skull (Height)
• Upper face length (Fheight)
• Face breadth between outermost points of cheekbones (Fbreadth)
Matrix Plot
Preliminary graphical display of the data
might be useful and here we will display
them as a scatter plot matrix in which
group membership is indicated. While this
diagram only allows us to asses the group
separation in two dimensions, it seems to
suggest that face breadth between outer-
most points of cheek bones (Fbreadth),
greatest length of skull (Length), and
upper face length (Fheight) provide the
greatest discrimination between the two
skull types
Descriptive / Correlations
Highest mean is 179.94 in Length of skull which
varying in between 200 (max) and 162.5(min).
lowest mean is 72.94 in Fheight which varying in
between 82.5 to 62.
As per the correlation matrix there are high
correlation among Length and
Fheight(0.755,p=0.00). Other than that Fheight
and Fbreadth (0.617,0.00), Length and
Fbreadth(0.567,0.01), Breadth and
Fbreadth(0.549,0.01) are significant
Number of clusters
The correct choice of number of clusters is often ambiguous, with interpretations
depending on the shape and scale of the distribution of points in a data set and the
desired clustering resolution of the user
• The rules of thumb is k=(n/2)^1/2 : where k is the number of clusters
• Plotting % of variance vs number of clusters
• In our case number of clusters is 2
Hierarchical Clustering
• Agglomerative (Bottom-up):
Principle: compute the Distance-Matrix between all objects (initially
one object = one cluster). Find the two clusters with the closest
distance and put those two clusters into one. Compute the new
Distance-Matrix
Hierarchical Clustering contd.
• data were analyzed under different linkage measurements vs squared
Euclidian distance methods
SUMMARYTABLE
Linkage Distance Cluster 1 Cluster 2 Cluster 1 Cluster 2
A B A B
Average Squared Euclidian A-6 A-11, B-15 35% 0% 65% 100%
Centroid Squared Euclidian A-6 A-11, B-15 35% 0% 65% 100%
Complete Squared Euclidian A-14, B-5 A-3, B-10 82% 33% 18% 67%
Single Squared Euclidian A-17, B-14 B-1 100% 93% 0% 7%
Ward Squared Euclidian A-16, B-5 A-1, B-10 94% 33% 6% 67%
Hierarchical Clustering Contd.
Complete Linkage Squared Euclidean Ward Linkage Squared Euclidean
The Dendrogram displays the information in the amalgamation table in the form of a tree
diagram. The first table summarizes each cluster by the number of observations, the within
cluster sum of squares, In general, a cluster with a small sum of squares is more compact than
one with a large sum of squares. The centroid is the vector of variable means for the
observations in that cluster and is used as a cluster midpoint. The second table displays the
centroids for the individual clusters while the third table gives distances between cluster
centroids.
Partitional Clustering
• K-mean
Case Number Type Cluster Case Number Type Cluster
1 A 1 17 A 2
2 A 2 18 B 1
3 A 2 19 B 2
4 A 2 20 B 1
5 A 2 21 B 1
6 A 2 22 B 1
7 A 2 23 B 2
8 A 2 24 B 1
9 A 2 25 B 1
10 A 2 26 B 1
11 A 2 27 B 1
12 A 2 28 B 1
13 A 2 29 B 2
14 A 1 30 B 1
15 A 2 31 B 1
16 A 2 32 B 2
K Mean Contd. Cluster Membership
K Mean Clustering Contd.
Out of 17 of A-type skulls 15 skulls present in one cluster(88.2%).
Out of 15 skulls 11 B-type skulls present in another cluster (77.3%).
The output of K-mean clustering quite better than the out put of
ward and complete in hierarchical clustering.
Cluster Validation
• Fisher’s Linear Discriminant Analysis
• Use discriminant analysis to classify observations into two or more
groups if you have a sample with known groups. Discriminant
analysis can also used to investigate how variables contribute to
group separation.
• For two groups, the null hypothesis is that the means of the two
groups on the discriminant function-the centroids, are equal.
• Centroids are the mean discriminant score for each group. Wilk’s
lambda is used to test for significant differences between groups
Cluster Validation contd.
The canonical relation is a correlation between
the discriminant scores and the levels of the
dependent variable. A high correlation (0.825)
indicates a function that discriminates well.
Wilks’ Lambda is the ratio of within-groups sums
of squares to the total sums of squares. Wilks'
lambda is a measure of how well each function
separates cases into groups. Smaller values of
Wilks' lambda indicate greater discriminatory
ability of the function. The associated
significance value indicate whether the
difference is significant. Here, the Lambda of
0.319 and significant p= 0.00)thus, the group
means appear to significantly different from
each other
Cluster Validation contd.
This table is used to assess how well the
discriminant function works, and if it works equally
well for each group of the dependent variable.
Here cross validated accuracy is about 87.5% and
this is quite good result
Summary
• Out of 17 of A-type skulls 16 skulls present in one cluster(94%). Out of
15 skulls 10 B-type skulls present in another cluster (67%) according to
Ward linkage hierarchical clustering
• Out of 17 of A-type skulls 15 skulls present in one cluster(88.2%). Out
of 15 skulls 11 B-type skulls present in another cluster (77.3%)
according to K-mean clustering
• Group means appear to significantly different from each other
according to discriminant analysis
• Thus Tibetans from Khams district significantly different from
generalTibetans according to the skull measurements
References
• Joseph F. Hair Jr.,Willim C. Black, Barry J. Babin, Rolph E. Anderson –
“Multivariate Data Analysis – a global perspective”
• Brian S. Everitt ,Sabine Landau “Cluster Analysis” 5th edition
• Mo'oamin M. R. El-Hanjouri , Bashar S. Hamad “Using Cluster Analysis
and Discriminant Analysis Methods in Classification with Application on
Standard of Living Family in Palestinian Areas” International Journal of
Statistics and Applications,2015
Appendix
THANKYOU
19/3/2017
A.W.D Udaya Shalika
158888L

More Related Content

What's hot

Machine Learning with Decision trees
Machine Learning with Decision treesMachine Learning with Decision trees
Machine Learning with Decision trees
Knoldus Inc.
 
Types of clustering and different types of clustering algorithms
Types of clustering and different types of clustering algorithmsTypes of clustering and different types of clustering algorithms
Types of clustering and different types of clustering algorithms
Prashanth Guntal
 
3.5 model based clustering
3.5 model based clustering3.5 model based clustering
3.5 model based clustering
Krish_ver2
 
K MEANS CLUSTERING
K MEANS CLUSTERINGK MEANS CLUSTERING
K MEANS CLUSTERING
singh7599
 
Linear models for classification
Linear models for classificationLinear models for classification
Linear models for classification
Sung Yub Kim
 
K mean-clustering
K mean-clusteringK mean-clustering
K mean-clustering
Afzaal Subhani
 
2.3 bayesian classification
2.3 bayesian classification2.3 bayesian classification
2.3 bayesian classification
Krish_ver2
 
Classification Based Machine Learning Algorithms
Classification Based Machine Learning AlgorithmsClassification Based Machine Learning Algorithms
Classification Based Machine Learning Algorithms
Md. Main Uddin Rony
 
Hierarchical clustering.pptx
Hierarchical clustering.pptxHierarchical clustering.pptx
Hierarchical clustering.pptx
NTUConcepts1
 
2.4 rule based classification
2.4 rule based classification2.4 rule based classification
2.4 rule based classification
Krish_ver2
 
Clustering in Data Mining
Clustering in Data MiningClustering in Data Mining
Clustering in Data Mining
Archana Swaminathan
 
Birch Algorithm With Solved Example
Birch Algorithm With Solved ExampleBirch Algorithm With Solved Example
Birch Algorithm With Solved Example
kailash shaw
 
Density Based Clustering
Density Based ClusteringDensity Based Clustering
Density Based Clustering
SSA KPI
 
Data Mining: Association Rules Basics
Data Mining: Association Rules BasicsData Mining: Association Rules Basics
Data Mining: Association Rules Basics
Benazir Income Support Program (BISP)
 
Data preprocessing
Data preprocessingData preprocessing
Data preprocessing
Jason Rodrigues
 
Mean shift and Hierarchical clustering
Mean shift and Hierarchical clustering Mean shift and Hierarchical clustering
Mean shift and Hierarchical clustering
Yan Xu
 
3.3 hierarchical methods
3.3 hierarchical methods3.3 hierarchical methods
3.3 hierarchical methods
Krish_ver2
 
K mean-clustering algorithm
K mean-clustering algorithmK mean-clustering algorithm
K mean-clustering algorithm
parry prabhu
 

What's hot (20)

Machine Learning with Decision trees
Machine Learning with Decision treesMachine Learning with Decision trees
Machine Learning with Decision trees
 
Types of clustering and different types of clustering algorithms
Types of clustering and different types of clustering algorithmsTypes of clustering and different types of clustering algorithms
Types of clustering and different types of clustering algorithms
 
3.5 model based clustering
3.5 model based clustering3.5 model based clustering
3.5 model based clustering
 
K MEANS CLUSTERING
K MEANS CLUSTERINGK MEANS CLUSTERING
K MEANS CLUSTERING
 
Linear models for classification
Linear models for classificationLinear models for classification
Linear models for classification
 
K mean-clustering
K mean-clusteringK mean-clustering
K mean-clustering
 
2.3 bayesian classification
2.3 bayesian classification2.3 bayesian classification
2.3 bayesian classification
 
3. mining frequent patterns
3. mining frequent patterns3. mining frequent patterns
3. mining frequent patterns
 
Presentation on K-Means Clustering
Presentation on K-Means ClusteringPresentation on K-Means Clustering
Presentation on K-Means Clustering
 
Classification Based Machine Learning Algorithms
Classification Based Machine Learning AlgorithmsClassification Based Machine Learning Algorithms
Classification Based Machine Learning Algorithms
 
Hierarchical clustering.pptx
Hierarchical clustering.pptxHierarchical clustering.pptx
Hierarchical clustering.pptx
 
2.4 rule based classification
2.4 rule based classification2.4 rule based classification
2.4 rule based classification
 
Clustering in Data Mining
Clustering in Data MiningClustering in Data Mining
Clustering in Data Mining
 
Birch Algorithm With Solved Example
Birch Algorithm With Solved ExampleBirch Algorithm With Solved Example
Birch Algorithm With Solved Example
 
Density Based Clustering
Density Based ClusteringDensity Based Clustering
Density Based Clustering
 
Data Mining: Association Rules Basics
Data Mining: Association Rules BasicsData Mining: Association Rules Basics
Data Mining: Association Rules Basics
 
Data preprocessing
Data preprocessingData preprocessing
Data preprocessing
 
Mean shift and Hierarchical clustering
Mean shift and Hierarchical clustering Mean shift and Hierarchical clustering
Mean shift and Hierarchical clustering
 
3.3 hierarchical methods
3.3 hierarchical methods3.3 hierarchical methods
3.3 hierarchical methods
 
K mean-clustering algorithm
K mean-clustering algorithmK mean-clustering algorithm
K mean-clustering algorithm
 

Similar to Cluster Validation

Pm m23 & pmnm06 week 3 lectures 2015
Pm m23 & pmnm06 week 3 lectures 2015Pm m23 & pmnm06 week 3 lectures 2015
Pm m23 & pmnm06 week 3 lectures 2015pdiddyboy2
 
Datamining
DataminingDatamining
Cluster Analysis
Cluster Analysis Cluster Analysis
Cluster Analysis
Baivab Nag
 
Microarray and its application
Microarray and its applicationMicroarray and its application
Microarray and its application
prateek kumar
 
Cluster analysis
Cluster analysisCluster analysis
Cluster analysis
Avijit Famous
 
Read first few slides cluster analysis
Read first few slides cluster analysisRead first few slides cluster analysis
Read first few slides cluster analysis
Kritika Jain
 
Clusteranalysis 121206234137-phpapp01
Clusteranalysis 121206234137-phpapp01Clusteranalysis 121206234137-phpapp01
Clusteranalysis 121206234137-phpapp01deepti gupta
 
Clusteranalysis
Clusteranalysis Clusteranalysis
Clusteranalysis
deepti gupta
 
Ch 4 Cluster Analysis.pdf
Ch 4 Cluster Analysis.pdfCh 4 Cluster Analysis.pdf
Ch 4 Cluster Analysis.pdf
YaseenRashid4
 
MODULE 4_ CLUSTERING.pptx
MODULE 4_ CLUSTERING.pptxMODULE 4_ CLUSTERING.pptx
MODULE 4_ CLUSTERING.pptx
nikshaikh786
 
Data Mining Lecture_8(a).pptx
Data Mining Lecture_8(a).pptxData Mining Lecture_8(a).pptx
Data Mining Lecture_8(a).pptx
Subrata Kumer Paul
 
TYPES OF CLUSTERING.pptx
TYPES OF CLUSTERING.pptxTYPES OF CLUSTERING.pptx
TYPES OF CLUSTERING.pptx
Incrediblev Vishnu
 
Statistics.pdf
Statistics.pdfStatistics.pdf
Statistics.pdf
Shruti Nigam (CWM, AFP)
 
Unsupervised Learning-Clustering Algorithms.pptx
Unsupervised Learning-Clustering Algorithms.pptxUnsupervised Learning-Clustering Algorithms.pptx
Unsupervised Learning-Clustering Algorithms.pptx
jasontseng19
 
Cluster analysis
Cluster analysisCluster analysis
Cluster analysis
緯鈞 沈
 
ClustIII.ppt
ClustIII.pptClustIII.ppt
ClustIII.ppt
SueMiu
 
Automatic Visualization
Automatic VisualizationAutomatic Visualization
Automatic Visualization
Sri Ambati
 
Measures of Variation.pdf
Measures of Variation.pdfMeasures of Variation.pdf
Measures of Variation.pdf
MuhammadFaizan389
 

Similar to Cluster Validation (20)

Cluster analysis
Cluster analysisCluster analysis
Cluster analysis
 
Pm m23 & pmnm06 week 3 lectures 2015
Pm m23 & pmnm06 week 3 lectures 2015Pm m23 & pmnm06 week 3 lectures 2015
Pm m23 & pmnm06 week 3 lectures 2015
 
Datamining
DataminingDatamining
Datamining
 
Cluster Analysis
Cluster Analysis Cluster Analysis
Cluster Analysis
 
Microarray and its application
Microarray and its applicationMicroarray and its application
Microarray and its application
 
Cluster analysis
Cluster analysisCluster analysis
Cluster analysis
 
Read first few slides cluster analysis
Read first few slides cluster analysisRead first few slides cluster analysis
Read first few slides cluster analysis
 
Clusteranalysis 121206234137-phpapp01
Clusteranalysis 121206234137-phpapp01Clusteranalysis 121206234137-phpapp01
Clusteranalysis 121206234137-phpapp01
 
Clusteranalysis
Clusteranalysis Clusteranalysis
Clusteranalysis
 
Ch 4 Cluster Analysis.pdf
Ch 4 Cluster Analysis.pdfCh 4 Cluster Analysis.pdf
Ch 4 Cluster Analysis.pdf
 
MODULE 4_ CLUSTERING.pptx
MODULE 4_ CLUSTERING.pptxMODULE 4_ CLUSTERING.pptx
MODULE 4_ CLUSTERING.pptx
 
Data Mining Lecture_8(a).pptx
Data Mining Lecture_8(a).pptxData Mining Lecture_8(a).pptx
Data Mining Lecture_8(a).pptx
 
TYPES OF CLUSTERING.pptx
TYPES OF CLUSTERING.pptxTYPES OF CLUSTERING.pptx
TYPES OF CLUSTERING.pptx
 
Statistics.pdf
Statistics.pdfStatistics.pdf
Statistics.pdf
 
Unsupervised Learning-Clustering Algorithms.pptx
Unsupervised Learning-Clustering Algorithms.pptxUnsupervised Learning-Clustering Algorithms.pptx
Unsupervised Learning-Clustering Algorithms.pptx
 
Hierachical clustering
Hierachical clusteringHierachical clustering
Hierachical clustering
 
Cluster analysis
Cluster analysisCluster analysis
Cluster analysis
 
ClustIII.ppt
ClustIII.pptClustIII.ppt
ClustIII.ppt
 
Automatic Visualization
Automatic VisualizationAutomatic Visualization
Automatic Visualization
 
Measures of Variation.pdf
Measures of Variation.pdfMeasures of Variation.pdf
Measures of Variation.pdf
 

Recently uploaded

Best best suvichar in gujarati english meaning of this sentence as Silk road ...
Best best suvichar in gujarati english meaning of this sentence as Silk road ...Best best suvichar in gujarati english meaning of this sentence as Silk road ...
Best best suvichar in gujarati english meaning of this sentence as Silk road ...
AbhimanyuSinha9
 
Jpolillo Amazon PPC - Bid Optimization Sample
Jpolillo Amazon PPC - Bid Optimization SampleJpolillo Amazon PPC - Bid Optimization Sample
Jpolillo Amazon PPC - Bid Optimization Sample
James Polillo
 
一比一原版(UVic毕业证)维多利亚大学毕业证成绩单
一比一原版(UVic毕业证)维多利亚大学毕业证成绩单一比一原版(UVic毕业证)维多利亚大学毕业证成绩单
一比一原版(UVic毕业证)维多利亚大学毕业证成绩单
ukgaet
 
做(mqu毕业证书)麦考瑞大学毕业证硕士文凭证书学费发票原版一模一样
做(mqu毕业证书)麦考瑞大学毕业证硕士文凭证书学费发票原版一模一样做(mqu毕业证书)麦考瑞大学毕业证硕士文凭证书学费发票原版一模一样
做(mqu毕业证书)麦考瑞大学毕业证硕士文凭证书学费发票原版一模一样
axoqas
 
Empowering Data Analytics Ecosystem.pptx
Empowering Data Analytics Ecosystem.pptxEmpowering Data Analytics Ecosystem.pptx
Empowering Data Analytics Ecosystem.pptx
benishzehra469
 
【社内勉強会資料_Octo: An Open-Source Generalist Robot Policy】
【社内勉強会資料_Octo: An Open-Source Generalist Robot Policy】【社内勉強会資料_Octo: An Open-Source Generalist Robot Policy】
【社内勉強会資料_Octo: An Open-Source Generalist Robot Policy】
NABLAS株式会社
 
一比一原版(UofM毕业证)明尼苏达大学毕业证成绩单
一比一原版(UofM毕业证)明尼苏达大学毕业证成绩单一比一原版(UofM毕业证)明尼苏达大学毕业证成绩单
一比一原版(UofM毕业证)明尼苏达大学毕业证成绩单
ewymefz
 
Criminal IP - Threat Hunting Webinar.pdf
Criminal IP - Threat Hunting Webinar.pdfCriminal IP - Threat Hunting Webinar.pdf
Criminal IP - Threat Hunting Webinar.pdf
Criminal IP
 
SOCRadar Germany 2024 Threat Landscape Report
SOCRadar Germany 2024 Threat Landscape ReportSOCRadar Germany 2024 Threat Landscape Report
SOCRadar Germany 2024 Threat Landscape Report
SOCRadar
 
一比一原版(CU毕业证)卡尔顿大学毕业证成绩单
一比一原版(CU毕业证)卡尔顿大学毕业证成绩单一比一原版(CU毕业证)卡尔顿大学毕业证成绩单
一比一原版(CU毕业证)卡尔顿大学毕业证成绩单
yhkoc
 
Chatty Kathy - UNC Bootcamp Final Project Presentation - Final Version - 5.23...
Chatty Kathy - UNC Bootcamp Final Project Presentation - Final Version - 5.23...Chatty Kathy - UNC Bootcamp Final Project Presentation - Final Version - 5.23...
Chatty Kathy - UNC Bootcamp Final Project Presentation - Final Version - 5.23...
John Andrews
 
社内勉強会資料_LLM Agents                              .
社内勉強会資料_LLM Agents                              .社内勉強会資料_LLM Agents                              .
社内勉強会資料_LLM Agents                              .
NABLAS株式会社
 
Adjusting primitives for graph : SHORT REPORT / NOTES
Adjusting primitives for graph : SHORT REPORT / NOTESAdjusting primitives for graph : SHORT REPORT / NOTES
Adjusting primitives for graph : SHORT REPORT / NOTES
Subhajit Sahu
 
一比一原版(ArtEZ毕业证)ArtEZ艺术学院毕业证成绩单
一比一原版(ArtEZ毕业证)ArtEZ艺术学院毕业证成绩单一比一原版(ArtEZ毕业证)ArtEZ艺术学院毕业证成绩单
一比一原版(ArtEZ毕业证)ArtEZ艺术学院毕业证成绩单
vcaxypu
 
哪里卖(usq毕业证书)南昆士兰大学毕业证研究生文凭证书托福证书原版一模一样
哪里卖(usq毕业证书)南昆士兰大学毕业证研究生文凭证书托福证书原版一模一样哪里卖(usq毕业证书)南昆士兰大学毕业证研究生文凭证书托福证书原版一模一样
哪里卖(usq毕业证书)南昆士兰大学毕业证研究生文凭证书托福证书原版一模一样
axoqas
 
Levelwise PageRank with Loop-Based Dead End Handling Strategy : SHORT REPORT ...
Levelwise PageRank with Loop-Based Dead End Handling Strategy : SHORT REPORT ...Levelwise PageRank with Loop-Based Dead End Handling Strategy : SHORT REPORT ...
Levelwise PageRank with Loop-Based Dead End Handling Strategy : SHORT REPORT ...
Subhajit Sahu
 
tapal brand analysis PPT slide for comptetive data
tapal brand analysis PPT slide for comptetive datatapal brand analysis PPT slide for comptetive data
tapal brand analysis PPT slide for comptetive data
theahmadsaood
 
Opendatabay - Open Data Marketplace.pptx
Opendatabay - Open Data Marketplace.pptxOpendatabay - Open Data Marketplace.pptx
Opendatabay - Open Data Marketplace.pptx
Opendatabay
 
Ch03-Managing the Object-Oriented Information Systems Project a.pdf
Ch03-Managing the Object-Oriented Information Systems Project a.pdfCh03-Managing the Object-Oriented Information Systems Project a.pdf
Ch03-Managing the Object-Oriented Information Systems Project a.pdf
haila53
 
一比一原版(BU毕业证)波士顿大学毕业证成绩单
一比一原版(BU毕业证)波士顿大学毕业证成绩单一比一原版(BU毕业证)波士顿大学毕业证成绩单
一比一原版(BU毕业证)波士顿大学毕业证成绩单
ewymefz
 

Recently uploaded (20)

Best best suvichar in gujarati english meaning of this sentence as Silk road ...
Best best suvichar in gujarati english meaning of this sentence as Silk road ...Best best suvichar in gujarati english meaning of this sentence as Silk road ...
Best best suvichar in gujarati english meaning of this sentence as Silk road ...
 
Jpolillo Amazon PPC - Bid Optimization Sample
Jpolillo Amazon PPC - Bid Optimization SampleJpolillo Amazon PPC - Bid Optimization Sample
Jpolillo Amazon PPC - Bid Optimization Sample
 
一比一原版(UVic毕业证)维多利亚大学毕业证成绩单
一比一原版(UVic毕业证)维多利亚大学毕业证成绩单一比一原版(UVic毕业证)维多利亚大学毕业证成绩单
一比一原版(UVic毕业证)维多利亚大学毕业证成绩单
 
做(mqu毕业证书)麦考瑞大学毕业证硕士文凭证书学费发票原版一模一样
做(mqu毕业证书)麦考瑞大学毕业证硕士文凭证书学费发票原版一模一样做(mqu毕业证书)麦考瑞大学毕业证硕士文凭证书学费发票原版一模一样
做(mqu毕业证书)麦考瑞大学毕业证硕士文凭证书学费发票原版一模一样
 
Empowering Data Analytics Ecosystem.pptx
Empowering Data Analytics Ecosystem.pptxEmpowering Data Analytics Ecosystem.pptx
Empowering Data Analytics Ecosystem.pptx
 
【社内勉強会資料_Octo: An Open-Source Generalist Robot Policy】
【社内勉強会資料_Octo: An Open-Source Generalist Robot Policy】【社内勉強会資料_Octo: An Open-Source Generalist Robot Policy】
【社内勉強会資料_Octo: An Open-Source Generalist Robot Policy】
 
一比一原版(UofM毕业证)明尼苏达大学毕业证成绩单
一比一原版(UofM毕业证)明尼苏达大学毕业证成绩单一比一原版(UofM毕业证)明尼苏达大学毕业证成绩单
一比一原版(UofM毕业证)明尼苏达大学毕业证成绩单
 
Criminal IP - Threat Hunting Webinar.pdf
Criminal IP - Threat Hunting Webinar.pdfCriminal IP - Threat Hunting Webinar.pdf
Criminal IP - Threat Hunting Webinar.pdf
 
SOCRadar Germany 2024 Threat Landscape Report
SOCRadar Germany 2024 Threat Landscape ReportSOCRadar Germany 2024 Threat Landscape Report
SOCRadar Germany 2024 Threat Landscape Report
 
一比一原版(CU毕业证)卡尔顿大学毕业证成绩单
一比一原版(CU毕业证)卡尔顿大学毕业证成绩单一比一原版(CU毕业证)卡尔顿大学毕业证成绩单
一比一原版(CU毕业证)卡尔顿大学毕业证成绩单
 
Chatty Kathy - UNC Bootcamp Final Project Presentation - Final Version - 5.23...
Chatty Kathy - UNC Bootcamp Final Project Presentation - Final Version - 5.23...Chatty Kathy - UNC Bootcamp Final Project Presentation - Final Version - 5.23...
Chatty Kathy - UNC Bootcamp Final Project Presentation - Final Version - 5.23...
 
社内勉強会資料_LLM Agents                              .
社内勉強会資料_LLM Agents                              .社内勉強会資料_LLM Agents                              .
社内勉強会資料_LLM Agents                              .
 
Adjusting primitives for graph : SHORT REPORT / NOTES
Adjusting primitives for graph : SHORT REPORT / NOTESAdjusting primitives for graph : SHORT REPORT / NOTES
Adjusting primitives for graph : SHORT REPORT / NOTES
 
一比一原版(ArtEZ毕业证)ArtEZ艺术学院毕业证成绩单
一比一原版(ArtEZ毕业证)ArtEZ艺术学院毕业证成绩单一比一原版(ArtEZ毕业证)ArtEZ艺术学院毕业证成绩单
一比一原版(ArtEZ毕业证)ArtEZ艺术学院毕业证成绩单
 
哪里卖(usq毕业证书)南昆士兰大学毕业证研究生文凭证书托福证书原版一模一样
哪里卖(usq毕业证书)南昆士兰大学毕业证研究生文凭证书托福证书原版一模一样哪里卖(usq毕业证书)南昆士兰大学毕业证研究生文凭证书托福证书原版一模一样
哪里卖(usq毕业证书)南昆士兰大学毕业证研究生文凭证书托福证书原版一模一样
 
Levelwise PageRank with Loop-Based Dead End Handling Strategy : SHORT REPORT ...
Levelwise PageRank with Loop-Based Dead End Handling Strategy : SHORT REPORT ...Levelwise PageRank with Loop-Based Dead End Handling Strategy : SHORT REPORT ...
Levelwise PageRank with Loop-Based Dead End Handling Strategy : SHORT REPORT ...
 
tapal brand analysis PPT slide for comptetive data
tapal brand analysis PPT slide for comptetive datatapal brand analysis PPT slide for comptetive data
tapal brand analysis PPT slide for comptetive data
 
Opendatabay - Open Data Marketplace.pptx
Opendatabay - Open Data Marketplace.pptxOpendatabay - Open Data Marketplace.pptx
Opendatabay - Open Data Marketplace.pptx
 
Ch03-Managing the Object-Oriented Information Systems Project a.pdf
Ch03-Managing the Object-Oriented Information Systems Project a.pdfCh03-Managing the Object-Oriented Information Systems Project a.pdf
Ch03-Managing the Object-Oriented Information Systems Project a.pdf
 
一比一原版(BU毕业证)波士顿大学毕业证成绩单
一比一原版(BU毕业证)波士顿大学毕业证成绩单一比一原版(BU毕业证)波士顿大学毕业证成绩单
一比一原版(BU毕业证)波士顿大学毕业证成绩单
 

Cluster Validation

  • 1. CLUSTER ANALYSIS CASE STUDY OF TIBETIAN SKULLS A.W.D. UDAYA SHALIKA 158888L
  • 2. Overview • What is cluster analysis? • Why Cluster Analysis • Clustering Methods • Analysis Background of Data Objectives Hierarchical Clustering K mean Clustering Validation
  • 3. What is cluster analysis? • What this means? When plotted geometrically, objects within clusters should be very close together and clusters will be far apart. • Clusters should exhibit high internal homogeneity and high external heterogeneity Cluster analysis is a multivariate data mining technique whose goal is to groups objects based on a set of user selected characteristics
  • 4. Why Cluster Analysis Cluster analysis is a major tool in a number of applications in many fields of Business, Engineering & etc.(The odoridis and Koutroubas, 1999): • Data reduction. • Hypothesis generation. • Hypothesis testing. • Prediction based on groups.
  • 5. Cluster Analysis – Classification Clustering Hierarchical clustering Divisive Agglomerative Partitional clustering K-means Fuzzy K-means Isodata Density based clustering Denclust CLUPOT SVC Parzen- Watershed Grid based clustering STING CLIQUE
  • 6. Background Story • These data, collected by Colonel L.A. Waddel, were first reported in Morant (1923) . The data consist of five measurements on each of 32 skulls found in the southwestern and eastern districts ofTibet. • The first comprises skulls 1 to 17 found in graves in Sikkim and the neighboring area of Tibet (Type A skulls). The remaining 15 skulls (Type B skulls) were picked up on a battlefield in the Lhasa district and are believed to be those of native soldiers from the eastern province of Khams.
  • 7. Objective Hypothesis test: Tibetans from Khams might be survivors of a particular human type, unrelated to the Mongolian and Indian types that surrounded them. • Greatest length of skull (Length) • Greatest horizontal breadth of skull (Breadth) • Height of skull (Height) • Upper face length (Fheight) • Face breadth between outermost points of cheekbones (Fbreadth)
  • 8. Matrix Plot Preliminary graphical display of the data might be useful and here we will display them as a scatter plot matrix in which group membership is indicated. While this diagram only allows us to asses the group separation in two dimensions, it seems to suggest that face breadth between outer- most points of cheek bones (Fbreadth), greatest length of skull (Length), and upper face length (Fheight) provide the greatest discrimination between the two skull types
  • 9. Descriptive / Correlations Highest mean is 179.94 in Length of skull which varying in between 200 (max) and 162.5(min). lowest mean is 72.94 in Fheight which varying in between 82.5 to 62. As per the correlation matrix there are high correlation among Length and Fheight(0.755,p=0.00). Other than that Fheight and Fbreadth (0.617,0.00), Length and Fbreadth(0.567,0.01), Breadth and Fbreadth(0.549,0.01) are significant
  • 10. Number of clusters The correct choice of number of clusters is often ambiguous, with interpretations depending on the shape and scale of the distribution of points in a data set and the desired clustering resolution of the user • The rules of thumb is k=(n/2)^1/2 : where k is the number of clusters • Plotting % of variance vs number of clusters • In our case number of clusters is 2
  • 11. Hierarchical Clustering • Agglomerative (Bottom-up): Principle: compute the Distance-Matrix between all objects (initially one object = one cluster). Find the two clusters with the closest distance and put those two clusters into one. Compute the new Distance-Matrix
  • 12. Hierarchical Clustering contd. • data were analyzed under different linkage measurements vs squared Euclidian distance methods SUMMARYTABLE Linkage Distance Cluster 1 Cluster 2 Cluster 1 Cluster 2 A B A B Average Squared Euclidian A-6 A-11, B-15 35% 0% 65% 100% Centroid Squared Euclidian A-6 A-11, B-15 35% 0% 65% 100% Complete Squared Euclidian A-14, B-5 A-3, B-10 82% 33% 18% 67% Single Squared Euclidian A-17, B-14 B-1 100% 93% 0% 7% Ward Squared Euclidian A-16, B-5 A-1, B-10 94% 33% 6% 67%
  • 13. Hierarchical Clustering Contd. Complete Linkage Squared Euclidean Ward Linkage Squared Euclidean
  • 14. Complete Linkage Squared Euclidean Ward Linkage Squared Euclidean The Dendrogram displays the information in the amalgamation table in the form of a tree diagram. The first table summarizes each cluster by the number of observations, the within cluster sum of squares, In general, a cluster with a small sum of squares is more compact than one with a large sum of squares. The centroid is the vector of variable means for the observations in that cluster and is used as a cluster midpoint. The second table displays the centroids for the individual clusters while the third table gives distances between cluster centroids.
  • 16. Case Number Type Cluster Case Number Type Cluster 1 A 1 17 A 2 2 A 2 18 B 1 3 A 2 19 B 2 4 A 2 20 B 1 5 A 2 21 B 1 6 A 2 22 B 1 7 A 2 23 B 2 8 A 2 24 B 1 9 A 2 25 B 1 10 A 2 26 B 1 11 A 2 27 B 1 12 A 2 28 B 1 13 A 2 29 B 2 14 A 1 30 B 1 15 A 2 31 B 1 16 A 2 32 B 2 K Mean Contd. Cluster Membership
  • 17. K Mean Clustering Contd. Out of 17 of A-type skulls 15 skulls present in one cluster(88.2%). Out of 15 skulls 11 B-type skulls present in another cluster (77.3%). The output of K-mean clustering quite better than the out put of ward and complete in hierarchical clustering.
  • 18. Cluster Validation • Fisher’s Linear Discriminant Analysis • Use discriminant analysis to classify observations into two or more groups if you have a sample with known groups. Discriminant analysis can also used to investigate how variables contribute to group separation. • For two groups, the null hypothesis is that the means of the two groups on the discriminant function-the centroids, are equal. • Centroids are the mean discriminant score for each group. Wilk’s lambda is used to test for significant differences between groups
  • 19. Cluster Validation contd. The canonical relation is a correlation between the discriminant scores and the levels of the dependent variable. A high correlation (0.825) indicates a function that discriminates well. Wilks’ Lambda is the ratio of within-groups sums of squares to the total sums of squares. Wilks' lambda is a measure of how well each function separates cases into groups. Smaller values of Wilks' lambda indicate greater discriminatory ability of the function. The associated significance value indicate whether the difference is significant. Here, the Lambda of 0.319 and significant p= 0.00)thus, the group means appear to significantly different from each other
  • 20. Cluster Validation contd. This table is used to assess how well the discriminant function works, and if it works equally well for each group of the dependent variable. Here cross validated accuracy is about 87.5% and this is quite good result
  • 21. Summary • Out of 17 of A-type skulls 16 skulls present in one cluster(94%). Out of 15 skulls 10 B-type skulls present in another cluster (67%) according to Ward linkage hierarchical clustering • Out of 17 of A-type skulls 15 skulls present in one cluster(88.2%). Out of 15 skulls 11 B-type skulls present in another cluster (77.3%) according to K-mean clustering • Group means appear to significantly different from each other according to discriminant analysis • Thus Tibetans from Khams district significantly different from generalTibetans according to the skull measurements
  • 22. References • Joseph F. Hair Jr.,Willim C. Black, Barry J. Babin, Rolph E. Anderson – “Multivariate Data Analysis – a global perspective” • Brian S. Everitt ,Sabine Landau “Cluster Analysis” 5th edition • Mo'oamin M. R. El-Hanjouri , Bashar S. Hamad “Using Cluster Analysis and Discriminant Analysis Methods in Classification with Application on Standard of Living Family in Palestinian Areas” International Journal of Statistics and Applications,2015

Editor's Notes

  1. Hypothesis generation. Cluster analysis is used here in order to infer some hypotheses concerning the data. For instance we may find in a retail database that there are two significant groups of customers based on their age and the time of purchases. Then, we may infer some hypotheses for the data, that it, “young people go shopping in the evening”, “old people go shopping in the morning”. Hypothesis testing. In this case, the cluster analysis is used for the verification of the validity of a specific hypothesis. For example, we consider the following hypothesis: “Young people go shopping in the evening”. One way to verify whether this is true is to apply cluster analysis to a representative set of stores. Suppose that each store is represented by its customer’s details (age, job etc) and the time of transactions. If, after applying cluster analysis, a cluster that corresponds to “young people buy in the evening” is formed, then the hypothesis is supported by cluster analysis.