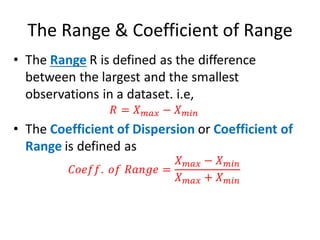
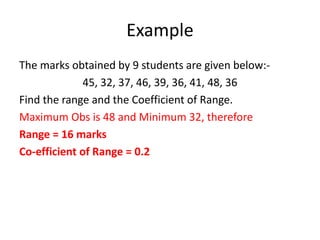
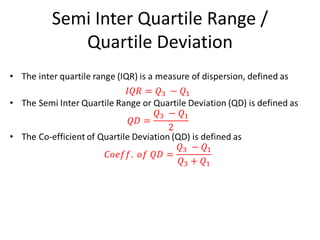
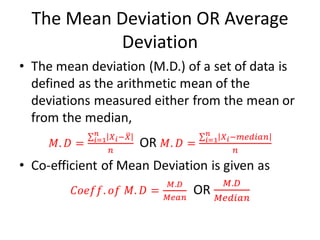
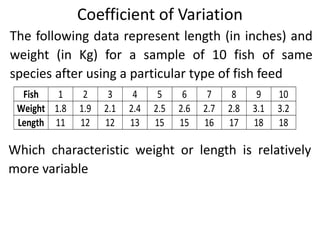
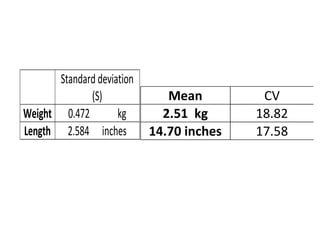
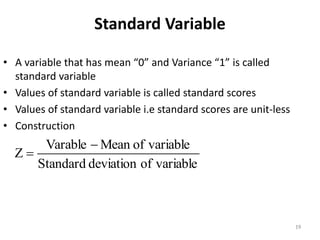
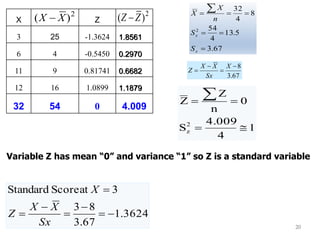
Measures of Variation / Dispersion/ Spread
• Although arithmetic mean is a concise method of
presentation of a statistical data yet it is
inadequate for several reasons, for example, it
gives no indication of its reliability.
• A measure of dispersion express quantitatively the
degree of variation or dispersion of value of a
variable about any average.
Measures of variation / dispersion/ spread
• Measures of variation measure the variation
present among the values in a data set with a
single number so measures of variation are
summary measures of spread of values in the
data.
• A measure of central tendency along with a
measure of dispersion gives an adequate
description of statistical data.
Types of dispersion
• Absolute dispersion
The measure of dispersion which expressed in
terms of original units of data are termed as
absolute measures
• Relative measures of dispersion
This term also known as coefficients of
dispersion, are obtained as ratios or
percentages.
Methods of measures of dispersion
The Range & Coefficient of Range
Example
The marks obtained by 9 students are given below:-
45, 32, 37, 46, 39, 36, 41, 48, 36
Find the range and the Coefficient of Range.
Maximum Obs is 48 and Minimum 32, therefore
Range = 16 marks
Co-efficient of Range = 0.2
Semi Inter Quartile Range /
Quartile Deviation
The Mean Deviation OR Average
Deviation
Example
X
3 2 0 1.5
4 1 1 0.5
7 2 4 2.5
7 2 4 2.5
8 3 5 3.5
3 2 0 1.5
5 0 2 0.5
3 2 0 1.5
Mean=5
Mode=3
Median=4.5
Solution:
11
Idea:- Select single value as reference value (ideal reference value is
mean of the data) take deviations of values from mean and take sum
of these deviations
Example:- Following data represent the yield per plot of three wheat
verities A,B and C. Compare the yield performance of three verities
XA XB XC
40 30 10
50 50 50
60 70 90
Center Base Measures
12
Solution: Squared the deviations and then sum the squared
deviations to get rid of cancelling sign problem 2
( )
X X
−

XA XB XC
40 30 10
50 50 50
60 70 90
Dev Dev Dev
-10 -20 -40
0 0 0
10 20 40
Dev2 Dev2 Dev2
100 400 1600
0 0 0
100 400 1600
( )
( )
( ) 2
2
2
2
2
2
2
2
2
67
.
1066
3
3200
67
.
266
3
800
67
.
6
3
200
Kg
n
X
X
S
Kg
n
X
X
S
Kg
n
X
X
S
C
C
C
B
B
B
A
A
A
=
=
−
=
=
=
−
=
=
=
−
=



Variance: Average of the Squared deviations from mean
Variance
• The variance is a measure of variability that
utilizes all the data.
• It is based on the squared difference between
the value of each observation (xi) and the
mean of the data
• The variance is denoted by s2.
Problem With Variance
14
Variance measures the variation in the data as the
square of the units of measurements of the data so it
is difficult to interpret it precisely
Solution:- Take positive square root of the variance
known as standard deviation denoted by S.
It has the same units as the measurements
themselves
Standard Deviation
• The standard deviation of a data set is the positive
square root of the variance.
• It is measured in the same units as the data,
making it more easily comparable, than the
variance, to the mean.
• The standard deviation is denoted S.
Kg
S
Kg
S
Kg
S
C
B
A
66
.
32
67
.
1066
33
.
16
67
.
266
58
.
2
67
.
6
=
=
=
=
=
=
Coefficient of Variation (CV)
• Shows relative variability, that is, variability
relative to the magnitude of the data i.e variation
relative to mean
• Always in percentage (%)
• Unitfree measure of variation
• Can be used to compare two or more sets of data
– measured in different units
– same units but different average size
CV= ×100
S
X
Coefficient of Variation
The following data represent length (in inches) and
weight (in Kg) for a sample of 10 fish of same
species after using a particular type of fish feed
Fish 1 2 3 4 5 6 7 8 9 10
Weight 1.8 1.9 2.1 2.4 2.5 2.6 2.7 2.8 3.1 3.2
Length 11 12 12 13 15 15 16 17 18 18
Which characteristic weight or length is relatively
more variable
Standard deviation
(S)
Weight 0.472 kg
Length 2.584 inches
Mean CV
2.51 kg 18.82
14.70 inches 17.58
Standard Variable
• A variable that has mean “0” and Variance “1” is called
standard variable
• Values of standard variable is called standard scores
• Values of standard variable i.e standard scores are unit-less
• Construction
variable
of
deviation
Standard
variable
of
Mean
Varable
Z
−
=
19
X Z
3 25 -1.3624 1.8561
6 4 -0.5450 0.2970
11 9 0.81741 0.6682
12 16 1.0899 1.1879
32 54 0 4.009
67
.
3
5
.
13
4
54
8
4
32
2
=
=
=
=
=
=

x
x
S
S
n
X
X
2
)
( X
X −
67
.
3
8
−
=
−
=
X
Sx
X
X
Z
20
1
4
4.009
S
0
n
Z
Z
2
z 
=
=
=

2
)
( Z
Z −
Variable Z has mean “0” and variance “1” so Z is a standard variable
3624
.
1
67
.
3
8
3
3
at
Score
Standard
−
=
−
=
−
=
=
Sx
X
X
Z
X

Measures of Variation.pdf

  • 1.
    Measures of Variation/ Dispersion/ Spread • Although arithmetic mean is a concise method of presentation of a statistical data yet it is inadequate for several reasons, for example, it gives no indication of its reliability. • A measure of dispersion express quantitatively the degree of variation or dispersion of value of a variable about any average.
  • 2.
    Measures of variation/ dispersion/ spread • Measures of variation measure the variation present among the values in a data set with a single number so measures of variation are summary measures of spread of values in the data. • A measure of central tendency along with a measure of dispersion gives an adequate description of statistical data.
  • 3.
    Types of dispersion •Absolute dispersion The measure of dispersion which expressed in terms of original units of data are termed as absolute measures • Relative measures of dispersion This term also known as coefficients of dispersion, are obtained as ratios or percentages.
  • 4.
    Methods of measuresof dispersion
  • 5.
    The Range &Coefficient of Range
  • 6.
    Example The marks obtainedby 9 students are given below:- 45, 32, 37, 46, 39, 36, 41, 48, 36 Find the range and the Coefficient of Range. Maximum Obs is 48 and Minimum 32, therefore Range = 16 marks Co-efficient of Range = 0.2
  • 7.
    Semi Inter QuartileRange / Quartile Deviation
  • 8.
    The Mean DeviationOR Average Deviation
  • 9.
    Example X 3 2 01.5 4 1 1 0.5 7 2 4 2.5 7 2 4 2.5 8 3 5 3.5 3 2 0 1.5 5 0 2 0.5 3 2 0 1.5 Mean=5 Mode=3 Median=4.5
  • 10.
  • 11.
    11 Idea:- Select singlevalue as reference value (ideal reference value is mean of the data) take deviations of values from mean and take sum of these deviations Example:- Following data represent the yield per plot of three wheat verities A,B and C. Compare the yield performance of three verities XA XB XC 40 30 10 50 50 50 60 70 90 Center Base Measures
  • 12.
    12 Solution: Squared thedeviations and then sum the squared deviations to get rid of cancelling sign problem 2 ( ) X X −  XA XB XC 40 30 10 50 50 50 60 70 90 Dev Dev Dev -10 -20 -40 0 0 0 10 20 40 Dev2 Dev2 Dev2 100 400 1600 0 0 0 100 400 1600 ( ) ( ) ( ) 2 2 2 2 2 2 2 2 2 67 . 1066 3 3200 67 . 266 3 800 67 . 6 3 200 Kg n X X S Kg n X X S Kg n X X S C C C B B B A A A = = − = = = − = = = − =    Variance: Average of the Squared deviations from mean
  • 13.
    Variance • The varianceis a measure of variability that utilizes all the data. • It is based on the squared difference between the value of each observation (xi) and the mean of the data • The variance is denoted by s2.
  • 14.
    Problem With Variance 14 Variancemeasures the variation in the data as the square of the units of measurements of the data so it is difficult to interpret it precisely Solution:- Take positive square root of the variance known as standard deviation denoted by S. It has the same units as the measurements themselves
  • 15.
    Standard Deviation • Thestandard deviation of a data set is the positive square root of the variance. • It is measured in the same units as the data, making it more easily comparable, than the variance, to the mean. • The standard deviation is denoted S. Kg S Kg S Kg S C B A 66 . 32 67 . 1066 33 . 16 67 . 266 58 . 2 67 . 6 = = = = = =
  • 16.
    Coefficient of Variation(CV) • Shows relative variability, that is, variability relative to the magnitude of the data i.e variation relative to mean • Always in percentage (%) • Unitfree measure of variation • Can be used to compare two or more sets of data – measured in different units – same units but different average size CV= ×100 S X
  • 17.
    Coefficient of Variation Thefollowing data represent length (in inches) and weight (in Kg) for a sample of 10 fish of same species after using a particular type of fish feed Fish 1 2 3 4 5 6 7 8 9 10 Weight 1.8 1.9 2.1 2.4 2.5 2.6 2.7 2.8 3.1 3.2 Length 11 12 12 13 15 15 16 17 18 18 Which characteristic weight or length is relatively more variable
  • 18.
    Standard deviation (S) Weight 0.472kg Length 2.584 inches Mean CV 2.51 kg 18.82 14.70 inches 17.58
  • 19.
    Standard Variable • Avariable that has mean “0” and Variance “1” is called standard variable • Values of standard variable is called standard scores • Values of standard variable i.e standard scores are unit-less • Construction variable of deviation Standard variable of Mean Varable Z − = 19
  • 20.
    X Z 3 25-1.3624 1.8561 6 4 -0.5450 0.2970 11 9 0.81741 0.6682 12 16 1.0899 1.1879 32 54 0 4.009 67 . 3 5 . 13 4 54 8 4 32 2 = = = = = =  x x S S n X X 2 ) ( X X − 67 . 3 8 − = − = X Sx X X Z 20 1 4 4.009 S 0 n Z Z 2 z  = = =  2 ) ( Z Z − Variable Z has mean “0” and variance “1” so Z is a standard variable 3624 . 1 67 . 3 8 3 3 at Score Standard − = − = − = = Sx X X Z X