Download to read offline


![1. Climate change increases a host of water and related
impacts: wetter wet seasons and drier dry seasons;
increased crop water demand; increased reliance on storage
2. Climate smart practices can increase or reduce adverse
water [energy] impacts (neg: biofuel development; pos:
manure management)
3. Water-based [storage/drip]; water-related [nitrogen-use
efficiency, no till, DT/HT, reforestation, WUAs, water
markets]; non-water measures [trade, pop/econ growth, ag
input and output support policies, PHL] are all important
pieces in addressing growing water variability, shortages and
degradation
Concluding thoughts](https://image.slidesharecdn.com/ringlerucdavis-151229193457/85/Claudia-Ringler-IFPRI-22-320.jpg)

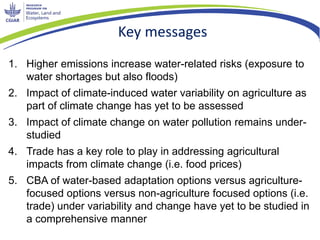
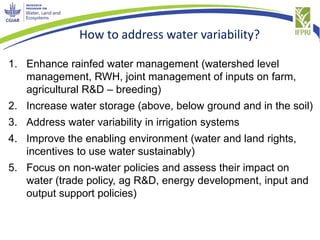
1. Climate change is projected to increase water-related risks like water shortages and floods through changes in water quantity and quality. This poses challenges for the agriculture sector. 2. Adaptation options like improving water storage, irrigation systems, and rainfed agriculture as well as policies around trade, population growth, and pollution management need to be comprehensively assessed to address impacts on water availability, agricultural production, and food security under climate change. 3. Both water-based technical solutions and non-water policy options will be important to manage the growing problems of water variability, scarcity, and degradation exacerbated by climate change and socioeconomic development.


