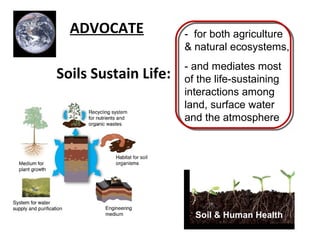
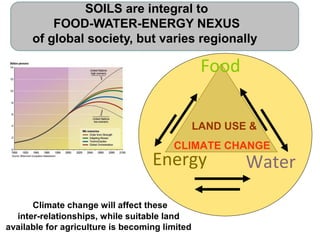
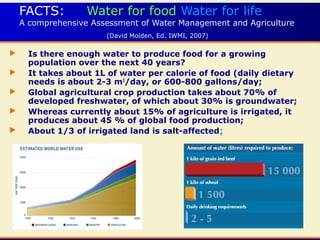
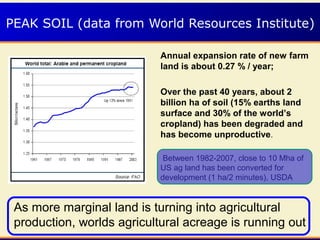
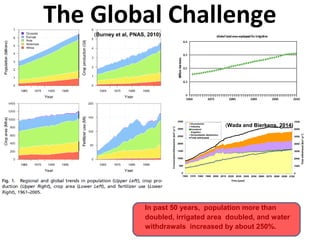
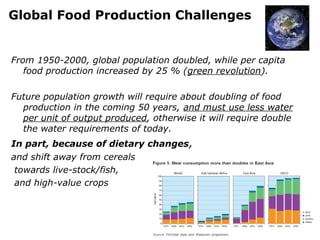
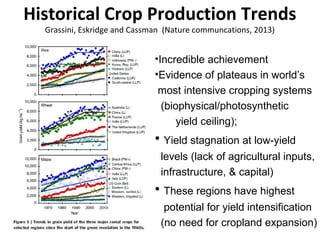
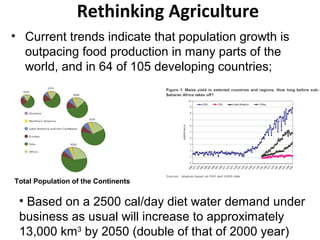
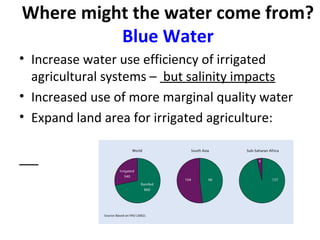
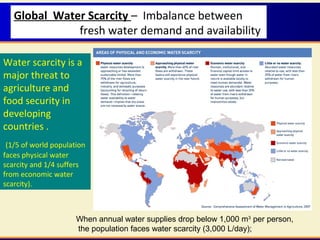
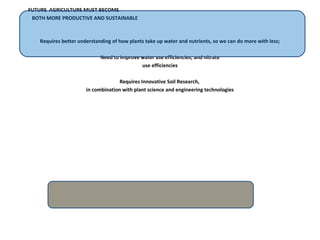
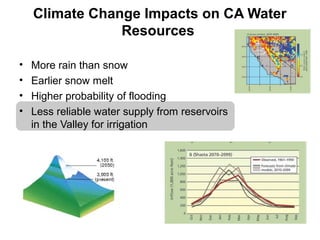
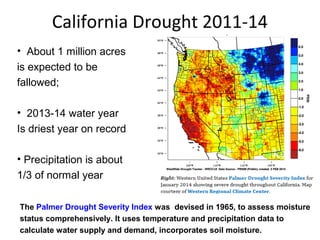
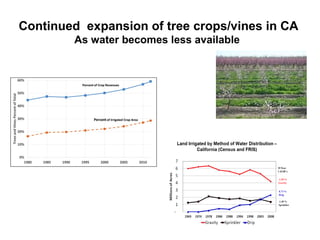
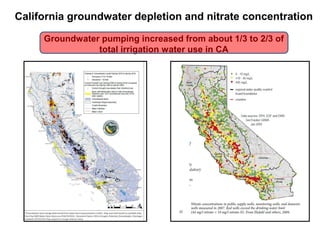
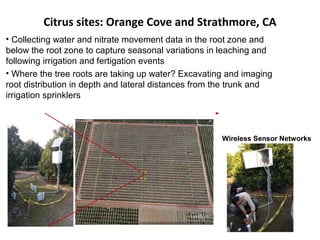
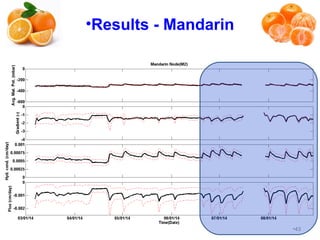
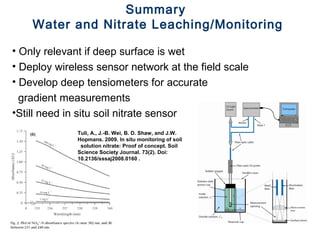
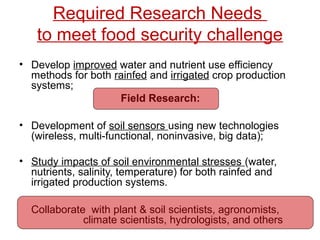
SIAGRO 2014 
Sao Carlos, Brazil 
November 20-22, 2014 
What Soil Science can Offer, for a Society 
Demanding more Food with less Water 
and Energy, Reducing Environmental 
Impacts, while our Climate is Changing ? 
Jan W Hopmans
What will be covered ? 
• Nexus of Soil & Water Science in Society 
- Food – Water – Land – Energy - Climate 
• Opportunities for Soil Science 
- Irrigation Water Management 
- Root/Soil Interactions 
- Nitrogen Management in Irrigated Soils 
• Research Challenges
- for both agriculture 
& natural ecosystems, 
- and mediates most 
of the life-sustaining 
interactions among 
land, surface water 
and the atmosphere 
Soil & Human Health 
ADVOCATE 
Soils Sustain Life:
SOILS are integral to 
FOOD-WATER-ENERGY NEXUS 
of global society, but varies regionally 
Food 
LAND USE & 
CLIMATE CHANGE 
Energy Water 
Climate change will affect these 
inter-relationships, while suitable land 
available for agriculture is becoming limited
FACTS: Water for food Water for life 
A comprehensive Assessment of Water Management and Agriculture 
(David Molden, Ed. IWMI, 2007) 
 Is there enough water to produce food for a growing 
population over the next 40 years? 
 It takes about 1L of water per calorie of food (daily dietary 
needs is about 2-3 m3/day, or 600-800 gallons/day; 
 Global agricultural crop production takes about 70% of 
developed freshwater, of which about 30% is groundwater; 
 Whereas currently about 15% of agriculture is irrigated, it 
produces about 45 % of global food production; 
 About 1/3 of irrigated land is salt-affected;
PEAK SOIL (data from World Resources Institute) 
Annual expansion rate of new farm 
land is about 0.27 % / year; 
Over the past 40 years, about 2 
billion ha of soil (15% earths land 
surface and 30% of the world’s 
cropland) has been degraded and 
has become unproductive. 
Between 1982-2007, close to 10 Mha of 
US ag land has been converted for 
development (1 ha/2 minutes), USDA 
As more marginal land is turning into agricultural 
production, worlds agricultural acreage is running out
The Global Challenge 
(Wada and Bierkens, 2014) 
(Burney et al, PNAS, 2010) 
In past 50 years, population more than 
doubled, irrigated area doubled, and water 
withdrawals increased by about 250%.
Global Food Production Challenges 
From 1950-2000, global population doubled, while per capita 
food production increased by 25 % (green revolution). 
Future population growth will require about doubling of food 
production in the coming 50 years, and must use less water 
per unit of output produced, otherwise it will require double 
the water requirements of today. 
In part, because of dietary changes, 
and shift away from cereals 
towards live-stock/fish, 
and high-value crops
Historical Crop Production Trends 
Grassini, Eskridge and Cassman (Nature communcations, 2013) 
•Incredible achievement 
•Evidence of plateaus in world’s 
most intensive cropping systems 
(biophysical/photosynthetic 
yield ceiling); 
• Yield stagnation at low-yield 
levels (lack of agricultural inputs, 
infrastructure, & capital) 
• These regions have highest 
potential for yield intensification 
(no need for cropland expansion)
Rethinking Agriculture 
• Current trends indicate that population growth is 
outpacing food production in many parts of the 
world, and in 64 of 105 developing countries; 
Total Population of the Continents 
• Based on a 2500 cal/day diet water demand under 
business as usual will increase to approximately 
13,000 km3 by 2050 (double of that of 2000 year)
Where might the water come from? 
Blue Water 
• Increase water use efficiency of irrigated 
agricultural systems – but salinity impacts 
• Increased use of more marginal quality water 
• Expand land area for irrigated agriculture:
Global Water Scarcity – Imbalance between 
fresh water demand and availability 
Water scarcity is a 
major threat to 
agriculture and 
food security in 
developing 
countries . 
(1/5 of world population 
faces physical water 
scarcity and 1/4 suffers 
from economic water 
scarcity). 
When annual water supplies drop below 1,000 m3 per person, 
the population faces water scarcity (3,000 L/day);
Food for Thought Green Water 
• Rainfed agriculture occupies about 85% cropland, yet irrigation 
provides 46% of the gross value of world’s agricultural production. 
Green water: ~65% 
• Increase of land & water productivity of rain-fed agricultural 
systems will be critical, producing more food per unit water (e.g. 
crop genetics)
A Bigger Rice Bowl 
(Economist, May 2014) 
• Demand for rice is rising in Asia and Africa 
• Rule of thumb: every additional 1 billion of people requires 100 million 
ton of rice; Yet, rice yields are stabilizing/falling 
• Rice is among the largest water users in agriculture – 
• Now requires yield boosting for rainfed rice (drought and flood 
resistant varieties)
Water Productivity 
Unbelievably low, for yields < 3 t/ha for cereal crops 
(essential all in developing countries) 
Evaporation losses 
Significant water 
savings can be 
gained 
Increase T/ET ratio 
Relationship between water productivity and yield for cereal crops in 
tropical/temperate farming systems (Rockstrom et al., PNAS, 2007)
Impacts of Limited Water Supply for Crop 
Production can be partly mitigated using 
Technological Solutions . . . . 
• Agricultural Biotechnology (plant breeding & molecular 
genetics) – improved drought & salinity tolerance 
• Water Resources Engineering (water transfers?) 
• Irrigation Technologies and Improved Irrigation Scheduling 
• Fresh water Generation (e.g. ,reverse osmosis) 
• Improved soil, water management, and agronomic practices, 
including improved water use efficiency and conservation
FUTURE AGRICULTURE MUST BECOME 
BOTH MORE PRODUCTIVE AND SUSTAINABLE 
Requires better understanding of how plants take up water and nutrients, so we can do more with less; 
Need to improve water use efficiencies, and nitrate 
use efficiencies 
Requires Innovative Soil Research, 
in combination with plant science and engineering technologies
Conservation Tillage 
Central Valley, CA 
No-till cotton and tomatoes 
Reduced till & Direct Seeding 
Reduces Energy Footprint 
CASI, Jeff Mitchell , UC CE Specialist
Thermal Neutron 
Non-invasive Neutron Tomography 
CT - MNRC 
Nuclear Research Reactor 
Gadolinium control rods 
•Neutron beam
Plant’s Response to Differential Soil Water Content 
( Moradi, Oswald, Menon, Carminati, Lehmann & Hopmans, 
Special Publication, SSSA) 
Moradi et al. 2012, New Phytologist
Climate – Water – Food Nexus 
Food 
Climate Water 
Increasing atmospheric CO2 causes increasing earth surface 
temperatures, affecting food production and water availability
Climate Trends and Global Crop Production Since 1980 
(Lobell et all., 2011, Science) 
Estimated net impact of climate trends for 1980-2008 
on crop yields by country, divided by the overall yield 
trend per year for the same period. 
Temperature trends 
Precipitation trends 
Maps of 1980-2008 linear trends in 
temperature (A) and precipitation (B) 
For the growing season of the 
Predominant crops (maize, wheat, rice, 
and soybean). 
Yield Trends largely Determined by Temperature 
rather than Precipitation Trends
Climate change Brazil 
Climate Change and extreme events in Brazil (FBDS, 2012 – H. Silveira Pinto) 
• Longer dry spells in eastern Amazon; 
• Reduction in precipitation; 
• Increase in frequency of daily and seasonal extremes of 
temperature and rainfall; 
Impacts: 
• Hydropower generation 
• Agricultural economy is 
expected to by most 
vulnerable to climate change 
(30% of Gross Domestic Product)
Agricultural impacts of climate 
change in Brazil 
• If predicted temperature increases for 2050 would 
happen today, all main crops (soybeans, rice, corn, 
beans, cassava, sunflower, cotton, coffee) would lose 
around 15% of their production areas. 
• Only sugar cane would 
increase its potential 
area for cultivation. 
• Longer drought periods 
can be partly compensated 
for by supplemental irrigation
CALIFORNIA 
• Largely (semi) arid climate 
• 12th largest economy in the world 
• Grows 50% fruits and vegetables and is 
number 1 dairy state in the US 
• ~25 million acres agricultural lands (10 million ha) 
• 52% is pasture/rangeland and 37% is irrigated crop 
land (10 million acres or 4 million ha) 
• Irrigated agriculture requires about 27 MAF (27 BCM) of 
developed water (surface plus groundwater) 
• State with most endangered ecological communities in the US 
• Significant climate warming is forecasted, which will negatively 
impact available water supplies and mandate change/regulate 
state-wide water management practices/policies.
Climate Change Impacts on CA Water 
Resources 
• More rain than snow 
• Earlier snow melt 
• Higher probability of flooding 
• Less reliable water supply from reservoirs 
in the Valley for irrigation
California Drought 2011-14 
• About 1 million acres 
is expected to be 
fallowed; 
• 2013-14 water year 
Is driest year on record 
• Precipitation is about 
1/3 of normal year 
The Palmer Drought Severity Index was devised in 1965, to assess moisture 
status comprehensively. It uses temperature and precipitation data to 
calculate water supply and demand, incorporates soil moisture.
Continued expansion of tree crops/vines in CA 
As water becomes less available
California groundwater depletion and nitrate concentration 
Groundwater pumping increased from about 1/3 to 2/3 of 
total irrigation water use in CA
Gg N /yr 
Sources and Sinks of Nitrate
Agriculture and Energy 
About 10 calories of energy is required 
to produce 1 calorie of edible food 
(35 calories for beef production); 
• Roughly about 50% of this required energy goes towards 
production of synthetic fertilizers and pesticides; 
• Fertilizer manufacturing uses about 3-5 % of the world’s 
annual natural gas production, and is equivalent to 1-2 % 
of the world’s annual energy supply; 
• Specifically, it takes nearly 1,000 m3 of natural gas to 
produce one ton of ammonia, 
with annual fertilizer production 
of 178 million tons)
Nitrate use efficiency by crops 
• Typically, half or more of the applied 
nitrate fertilizer is not taken up by the crop; 
• The rest ends up in the natural 
environment: soil – surface/groundwater – 
atmosphere 
CHALLENGE: How would one monitor 
nitrate leaching???
Efficient irrigation and fertigation practices 
Across California 
Objectives: 
•Develop water & nitrate measurement techniques 
•Recommend guidelines for improved irrigation 
and nitrate management practices 
Wireless Sensor Networks
Instruments list and functions: 
1. Tensiometers: measures soil matric 
potential, range: 850 - 0 mbar, individually-calibrated 
pressure transducers 
2. Decagon 5TE sensors: measures soil water 
content, electrical conductivity, temperature 
3. Decagon MPS-2 sensors: measures soil 
matric potentials, range -4000 mbar – 0 
4. Neutron Probe: measures soil water content, 
large representative soil volume 
5. Suction lysimeters : is used to collect soil 
solution for nitrate analysis 
6. Equilibrium-Tension Lysimeters: measures 
drainage below the root zone and collect soil 
solution samples for nitrate analysis 
Multiple sensors at various depths and locations for 
each treatment plot
Leaching measurement: Tensiometers below 
40cm 
140cm 
200cm 
A B 
root zone – Darcy Flow 
q 
q = - K q H - 
H 
( ) 
B A 
A B 
A B z 
- 
- D 
Improved Deep 
Tensiometer
Enormous depth variation in soil texture/layering, 
soil water retention,with corresponding 
unsaturated hydraulic conductivity functions
Darcy Flow approach 
Soil hydraulic properties 
Laboratory methods 
e.g. multi-step outflow experiments 
Modelling based on measured parameters 
e.g. soil moisture monitoring
Russell 
Ranch 
Sustainable 
Agriculture 
Facility 
Photo: R. Ford Denison 
Summer Winter 
Fallow 
Bell Bean 
Triticale 
Tomato/ 
Corn 
Two soil types: 
Rincon silty clay loam 
Yolo silt loam 
•3 replicates of each treatment
Russell Ranch – 
Tomatoes 
Treatments: 
Winter fallow 
Triticale 
Bell beans
Daily leaching rates of water and nitrate in Bell Bean treatment 
1st graph: Average water potential in soil profile (0 is soil saturation, the more negative the dryer the soil) 
2nd graph: Soil water gradients (driving force for water movement) across a soil layer at 90-150 cm deep 
3rd graph: Soil nitrate concentrations measured in soil solution in the 90-150 cm soil layer 
4th graph: Daily vertical downward /upward fluxes of water (blue line on left Y axes) and nitrate (green line 
on the right axes). Negative fluxes are downward and positive fluxes are upward. Most of the leaching of 
water and nitrate seem to happen in the fall and early corn season. 
Tomato Cover Crop Corn Cover Crop
Cumulative nitrate leaching in all three treatments 
Vertical downward leaching of nitrate (negative values) throughout the crop rotations. Triticale showed to 
be the most efficient in reducing the nitrate leaching below the root zone (150 cm deep). Note the 
difference in nitrate leaching rate during different seasons in different treatments. While nitrate 
continuously leached below the root zone of winter fallow in fall through corn season, it slowed down in 
the two cover crop treatments. 
Tomato Cover Crop Corn Cover Crop
Citrus sites: Orange Cove and Strathmore, CA 
• Collecting water and nitrate movement data in the root zone and 
below the root zone to capture seasonal variations in leaching and 
following irrigation and fertigation events 
• Where the tree roots are taking up water? Excavating and imaging 
root distribution in depth and lateral distances from the trunk and 
irrigation sprinklers 
Wireless Sensor Networks
•Results - Mandarin 
•43
Summary 
Water and Nitrate Leaching/Monitoring 
• Only relevant if deep surface is wet 
• Deploy wireless sensor network at the field scale 
• Develop deep tensiometers for accurate 
gradient measurements 
•Still need in situ soil nitrate sensor 
Tuli, A., J.-B. Wei, B. D. Shaw, and J.W. 
Hopmans. 2009. In situ monitoring of soil 
solution nitrate: Proof of concept. Soil 
Science Society Journal. 73(2). Doi: 
10.2136/sssaj2008.0160 .
Required Research Needs 
to meet food security challenge 
• Develop improved water and nutrient use efficiency 
methods for both rainfed and irrigated crop production 
systems; 
Field Research: 
• Development of soil sensors using new technologies 
(wireless, multi-functional, noninvasive, big data); 
• Study impacts of soil environmental stresses (water, 
nutrients, salinity, temperature) for both rainfed and 
irrigated production systems. 
Collaborate with plant & soil scientists, agronomists, 
climate scientists, hydrologists, and others
Changes in CA Water Use, Irrigated Area (by crop type), 
and Agricultural Income 
1,400 
1,200 
1,000 
800 
600 
400 
200 
0 
CA population 
30-40% is 
groundwater 
1960 1972 1980 1985 1992 2000 2005 
Year -205 inflation adjusted dolars per acre fot aplied water 
1 acrefoot ~ 1ML 
1 MAF ~ 1 BCM~1 km3 
CA agriculture has shown to be innovative and 
flexible, and seek ways to increase income (yield) with 
less water : 
 Sustaining CA agriculture in an uncertain future, 
Pacific Institute, 2009; 
 Managing CA’s water - From conflict to reconciliation 
Public Policy Institute of CA, 2011 
 Agricultural issues Center, DANR, 2012 
Total Developed Water Use in CA 
Irrigated Area in CA 
Adjusted Income/AF applied water

What Soil Science can Offer, for a Society Demanding more Food with less Water and Energy, Reducing Environmental Impacts, while our Climate is Changing? SIAGRO 2014 Embrapa Instrumentação - Jan Hopmans

  • 1.
    SIAGRO 2014 SaoCarlos, Brazil November 20-22, 2014 What Soil Science can Offer, for a Society Demanding more Food with less Water and Energy, Reducing Environmental Impacts, while our Climate is Changing ? Jan W Hopmans
  • 2.
    What will becovered ? • Nexus of Soil & Water Science in Society - Food – Water – Land – Energy - Climate • Opportunities for Soil Science - Irrigation Water Management - Root/Soil Interactions - Nitrogen Management in Irrigated Soils • Research Challenges
  • 3.
    - for bothagriculture & natural ecosystems, - and mediates most of the life-sustaining interactions among land, surface water and the atmosphere Soil & Human Health ADVOCATE Soils Sustain Life:
  • 4.
    SOILS are integralto FOOD-WATER-ENERGY NEXUS of global society, but varies regionally Food LAND USE & CLIMATE CHANGE Energy Water Climate change will affect these inter-relationships, while suitable land available for agriculture is becoming limited
  • 5.
    FACTS: Water forfood Water for life A comprehensive Assessment of Water Management and Agriculture (David Molden, Ed. IWMI, 2007)  Is there enough water to produce food for a growing population over the next 40 years?  It takes about 1L of water per calorie of food (daily dietary needs is about 2-3 m3/day, or 600-800 gallons/day;  Global agricultural crop production takes about 70% of developed freshwater, of which about 30% is groundwater;  Whereas currently about 15% of agriculture is irrigated, it produces about 45 % of global food production;  About 1/3 of irrigated land is salt-affected;
  • 6.
    PEAK SOIL (datafrom World Resources Institute) Annual expansion rate of new farm land is about 0.27 % / year; Over the past 40 years, about 2 billion ha of soil (15% earths land surface and 30% of the world’s cropland) has been degraded and has become unproductive. Between 1982-2007, close to 10 Mha of US ag land has been converted for development (1 ha/2 minutes), USDA As more marginal land is turning into agricultural production, worlds agricultural acreage is running out
  • 7.
    The Global Challenge (Wada and Bierkens, 2014) (Burney et al, PNAS, 2010) In past 50 years, population more than doubled, irrigated area doubled, and water withdrawals increased by about 250%.
  • 8.
    Global Food ProductionChallenges From 1950-2000, global population doubled, while per capita food production increased by 25 % (green revolution). Future population growth will require about doubling of food production in the coming 50 years, and must use less water per unit of output produced, otherwise it will require double the water requirements of today. In part, because of dietary changes, and shift away from cereals towards live-stock/fish, and high-value crops
  • 9.
    Historical Crop ProductionTrends Grassini, Eskridge and Cassman (Nature communcations, 2013) •Incredible achievement •Evidence of plateaus in world’s most intensive cropping systems (biophysical/photosynthetic yield ceiling); • Yield stagnation at low-yield levels (lack of agricultural inputs, infrastructure, & capital) • These regions have highest potential for yield intensification (no need for cropland expansion)
  • 10.
    Rethinking Agriculture •Current trends indicate that population growth is outpacing food production in many parts of the world, and in 64 of 105 developing countries; Total Population of the Continents • Based on a 2500 cal/day diet water demand under business as usual will increase to approximately 13,000 km3 by 2050 (double of that of 2000 year)
  • 11.
    Where might thewater come from? Blue Water • Increase water use efficiency of irrigated agricultural systems – but salinity impacts • Increased use of more marginal quality water • Expand land area for irrigated agriculture:
  • 12.
    Global Water Scarcity– Imbalance between fresh water demand and availability Water scarcity is a major threat to agriculture and food security in developing countries . (1/5 of world population faces physical water scarcity and 1/4 suffers from economic water scarcity). When annual water supplies drop below 1,000 m3 per person, the population faces water scarcity (3,000 L/day);
  • 13.
    Food for ThoughtGreen Water • Rainfed agriculture occupies about 85% cropland, yet irrigation provides 46% of the gross value of world’s agricultural production. Green water: ~65% • Increase of land & water productivity of rain-fed agricultural systems will be critical, producing more food per unit water (e.g. crop genetics)
  • 14.
    A Bigger RiceBowl (Economist, May 2014) • Demand for rice is rising in Asia and Africa • Rule of thumb: every additional 1 billion of people requires 100 million ton of rice; Yet, rice yields are stabilizing/falling • Rice is among the largest water users in agriculture – • Now requires yield boosting for rainfed rice (drought and flood resistant varieties)
  • 15.
    Water Productivity Unbelievablylow, for yields < 3 t/ha for cereal crops (essential all in developing countries) Evaporation losses Significant water savings can be gained Increase T/ET ratio Relationship between water productivity and yield for cereal crops in tropical/temperate farming systems (Rockstrom et al., PNAS, 2007)
  • 16.
    Impacts of LimitedWater Supply for Crop Production can be partly mitigated using Technological Solutions . . . . • Agricultural Biotechnology (plant breeding & molecular genetics) – improved drought & salinity tolerance • Water Resources Engineering (water transfers?) • Irrigation Technologies and Improved Irrigation Scheduling • Fresh water Generation (e.g. ,reverse osmosis) • Improved soil, water management, and agronomic practices, including improved water use efficiency and conservation
  • 17.
    FUTURE AGRICULTURE MUSTBECOME BOTH MORE PRODUCTIVE AND SUSTAINABLE Requires better understanding of how plants take up water and nutrients, so we can do more with less; Need to improve water use efficiencies, and nitrate use efficiencies Requires Innovative Soil Research, in combination with plant science and engineering technologies
  • 18.
    Conservation Tillage CentralValley, CA No-till cotton and tomatoes Reduced till & Direct Seeding Reduces Energy Footprint CASI, Jeff Mitchell , UC CE Specialist
  • 19.
    Thermal Neutron Non-invasiveNeutron Tomography CT - MNRC Nuclear Research Reactor Gadolinium control rods •Neutron beam
  • 20.
    Plant’s Response toDifferential Soil Water Content ( Moradi, Oswald, Menon, Carminati, Lehmann & Hopmans, Special Publication, SSSA) Moradi et al. 2012, New Phytologist
  • 21.
    Climate – Water– Food Nexus Food Climate Water Increasing atmospheric CO2 causes increasing earth surface temperatures, affecting food production and water availability
  • 22.
    Climate Trends andGlobal Crop Production Since 1980 (Lobell et all., 2011, Science) Estimated net impact of climate trends for 1980-2008 on crop yields by country, divided by the overall yield trend per year for the same period. Temperature trends Precipitation trends Maps of 1980-2008 linear trends in temperature (A) and precipitation (B) For the growing season of the Predominant crops (maize, wheat, rice, and soybean). Yield Trends largely Determined by Temperature rather than Precipitation Trends
  • 23.
    Climate change Brazil Climate Change and extreme events in Brazil (FBDS, 2012 – H. Silveira Pinto) • Longer dry spells in eastern Amazon; • Reduction in precipitation; • Increase in frequency of daily and seasonal extremes of temperature and rainfall; Impacts: • Hydropower generation • Agricultural economy is expected to by most vulnerable to climate change (30% of Gross Domestic Product)
  • 24.
    Agricultural impacts ofclimate change in Brazil • If predicted temperature increases for 2050 would happen today, all main crops (soybeans, rice, corn, beans, cassava, sunflower, cotton, coffee) would lose around 15% of their production areas. • Only sugar cane would increase its potential area for cultivation. • Longer drought periods can be partly compensated for by supplemental irrigation
  • 25.
    CALIFORNIA • Largely(semi) arid climate • 12th largest economy in the world • Grows 50% fruits and vegetables and is number 1 dairy state in the US • ~25 million acres agricultural lands (10 million ha) • 52% is pasture/rangeland and 37% is irrigated crop land (10 million acres or 4 million ha) • Irrigated agriculture requires about 27 MAF (27 BCM) of developed water (surface plus groundwater) • State with most endangered ecological communities in the US • Significant climate warming is forecasted, which will negatively impact available water supplies and mandate change/regulate state-wide water management practices/policies.
  • 26.
    Climate Change Impactson CA Water Resources • More rain than snow • Earlier snow melt • Higher probability of flooding • Less reliable water supply from reservoirs in the Valley for irrigation
  • 27.
    California Drought 2011-14 • About 1 million acres is expected to be fallowed; • 2013-14 water year Is driest year on record • Precipitation is about 1/3 of normal year The Palmer Drought Severity Index was devised in 1965, to assess moisture status comprehensively. It uses temperature and precipitation data to calculate water supply and demand, incorporates soil moisture.
  • 28.
    Continued expansion oftree crops/vines in CA As water becomes less available
  • 29.
    California groundwater depletionand nitrate concentration Groundwater pumping increased from about 1/3 to 2/3 of total irrigation water use in CA
  • 30.
    Gg N /yr Sources and Sinks of Nitrate
  • 31.
    Agriculture and Energy About 10 calories of energy is required to produce 1 calorie of edible food (35 calories for beef production); • Roughly about 50% of this required energy goes towards production of synthetic fertilizers and pesticides; • Fertilizer manufacturing uses about 3-5 % of the world’s annual natural gas production, and is equivalent to 1-2 % of the world’s annual energy supply; • Specifically, it takes nearly 1,000 m3 of natural gas to produce one ton of ammonia, with annual fertilizer production of 178 million tons)
  • 32.
    Nitrate use efficiencyby crops • Typically, half or more of the applied nitrate fertilizer is not taken up by the crop; • The rest ends up in the natural environment: soil – surface/groundwater – atmosphere CHALLENGE: How would one monitor nitrate leaching???
  • 33.
    Efficient irrigation andfertigation practices Across California Objectives: •Develop water & nitrate measurement techniques •Recommend guidelines for improved irrigation and nitrate management practices Wireless Sensor Networks
  • 34.
    Instruments list andfunctions: 1. Tensiometers: measures soil matric potential, range: 850 - 0 mbar, individually-calibrated pressure transducers 2. Decagon 5TE sensors: measures soil water content, electrical conductivity, temperature 3. Decagon MPS-2 sensors: measures soil matric potentials, range -4000 mbar – 0 4. Neutron Probe: measures soil water content, large representative soil volume 5. Suction lysimeters : is used to collect soil solution for nitrate analysis 6. Equilibrium-Tension Lysimeters: measures drainage below the root zone and collect soil solution samples for nitrate analysis Multiple sensors at various depths and locations for each treatment plot
  • 35.
    Leaching measurement: Tensiometersbelow 40cm 140cm 200cm A B root zone – Darcy Flow q q = - K q H - H ( ) B A A B A B z - - D Improved Deep Tensiometer
  • 36.
    Enormous depth variationin soil texture/layering, soil water retention,with corresponding unsaturated hydraulic conductivity functions
  • 37.
    Darcy Flow approach Soil hydraulic properties Laboratory methods e.g. multi-step outflow experiments Modelling based on measured parameters e.g. soil moisture monitoring
  • 38.
    Russell Ranch Sustainable Agriculture Facility Photo: R. Ford Denison Summer Winter Fallow Bell Bean Triticale Tomato/ Corn Two soil types: Rincon silty clay loam Yolo silt loam •3 replicates of each treatment
  • 39.
    Russell Ranch – Tomatoes Treatments: Winter fallow Triticale Bell beans
  • 40.
    Daily leaching ratesof water and nitrate in Bell Bean treatment 1st graph: Average water potential in soil profile (0 is soil saturation, the more negative the dryer the soil) 2nd graph: Soil water gradients (driving force for water movement) across a soil layer at 90-150 cm deep 3rd graph: Soil nitrate concentrations measured in soil solution in the 90-150 cm soil layer 4th graph: Daily vertical downward /upward fluxes of water (blue line on left Y axes) and nitrate (green line on the right axes). Negative fluxes are downward and positive fluxes are upward. Most of the leaching of water and nitrate seem to happen in the fall and early corn season. Tomato Cover Crop Corn Cover Crop
  • 41.
    Cumulative nitrate leachingin all three treatments Vertical downward leaching of nitrate (negative values) throughout the crop rotations. Triticale showed to be the most efficient in reducing the nitrate leaching below the root zone (150 cm deep). Note the difference in nitrate leaching rate during different seasons in different treatments. While nitrate continuously leached below the root zone of winter fallow in fall through corn season, it slowed down in the two cover crop treatments. Tomato Cover Crop Corn Cover Crop
  • 42.
    Citrus sites: OrangeCove and Strathmore, CA • Collecting water and nitrate movement data in the root zone and below the root zone to capture seasonal variations in leaching and following irrigation and fertigation events • Where the tree roots are taking up water? Excavating and imaging root distribution in depth and lateral distances from the trunk and irrigation sprinklers Wireless Sensor Networks
  • 43.
  • 44.
    Summary Water andNitrate Leaching/Monitoring • Only relevant if deep surface is wet • Deploy wireless sensor network at the field scale • Develop deep tensiometers for accurate gradient measurements •Still need in situ soil nitrate sensor Tuli, A., J.-B. Wei, B. D. Shaw, and J.W. Hopmans. 2009. In situ monitoring of soil solution nitrate: Proof of concept. Soil Science Society Journal. 73(2). Doi: 10.2136/sssaj2008.0160 .
  • 45.
    Required Research Needs to meet food security challenge • Develop improved water and nutrient use efficiency methods for both rainfed and irrigated crop production systems; Field Research: • Development of soil sensors using new technologies (wireless, multi-functional, noninvasive, big data); • Study impacts of soil environmental stresses (water, nutrients, salinity, temperature) for both rainfed and irrigated production systems. Collaborate with plant & soil scientists, agronomists, climate scientists, hydrologists, and others
  • 48.
    Changes in CAWater Use, Irrigated Area (by crop type), and Agricultural Income 1,400 1,200 1,000 800 600 400 200 0 CA population 30-40% is groundwater 1960 1972 1980 1985 1992 2000 2005 Year -205 inflation adjusted dolars per acre fot aplied water 1 acrefoot ~ 1ML 1 MAF ~ 1 BCM~1 km3 CA agriculture has shown to be innovative and flexible, and seek ways to increase income (yield) with less water :  Sustaining CA agriculture in an uncertain future, Pacific Institute, 2009;  Managing CA’s water - From conflict to reconciliation Public Policy Institute of CA, 2011  Agricultural issues Center, DANR, 2012 Total Developed Water Use in CA Irrigated Area in CA Adjusted Income/AF applied water

Editor's Notes

  • #2 Helicopter view at 30,000 feet This is Our Challenge, and it Thought Provoking. Answer is affirmative yes. Check Millinium Goals. Main outcome of sust agr is that it is strongly correlated with reducing poverty. Sustainable intensification of agriculture. Sustainable agriculture refers to the ability to produce food indefinitely, without causing irreversible damage to ecosystem health ; But also: Enhance the quality of life for farmers, farm workers, and society as a whole.
  • #5 Urban versus Rural Adapt and Mitigate
  • #8 More groundwater depletion. Becomes irreversible.
  • #11 Projections are that half of the population growth will occur in Africa…..
  • #12 Expand irrigated area in africa, but where does water come from???
  • #13 We estimate up to twice as much water will be required to grow food and feed requirements in 2050. India and China have just about utilised their readily available water resources – so productivity increases and waste water reuse have to be the way forward. In CA, water availabity per capita is about 4,000 L/day
  • #23 Historical yield changes due to 0.13oC/decade since 1950. Left: 1 means that temperature trend over 30 years is equal to inter-annual variation Right: -0.1 means that the setback of 10 years of climate trend is equivalent to 1 year of technology gains.
  • #32 IN US, near 20% of all energy use is consumed in food production systems.
  • #35 Again, this is the list of sensors we have installed in the field. Apart from the ones described in the previous slide, we also have Equilibrium tension lysimeters, to collect soil solution samples for nitrate analysis. These are installed at 125 cm depth in the centre of the bed, about 5m away from other sensors
  • #36 Recent field work is started to make clear that leaching may be much better quantified using the conventional tensiometers, installed in pairs below the rooting zone, as shown here, and with leaching flux computed from Darcy’s law, where K is the unsat hydraulic conductity, which is a function of soil water content, and larger as water content increases. Total head is computed from tensiometer measurement of soil water potential with pressure transducer, and much more accurate than using elec resistance (gypsum) blocks.
  • #37 This slide presenrts the wide variations in both soil water retention and unsat K for the various soil textures that occur in the layers of the almond field site. For example at value of soil water potential of -200cm, unsat K varies between almost zero to about 0.5 cm/day.