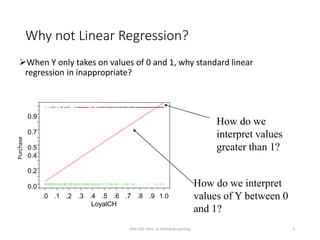
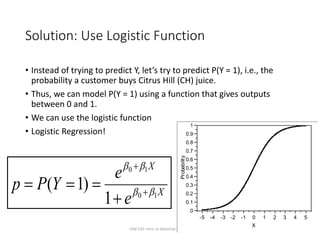
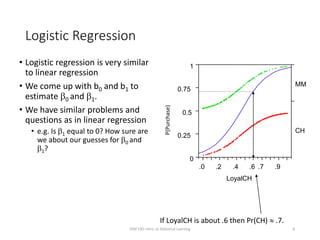
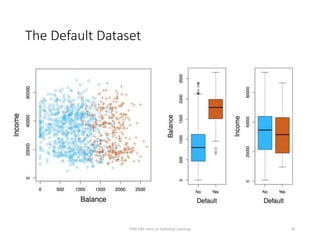
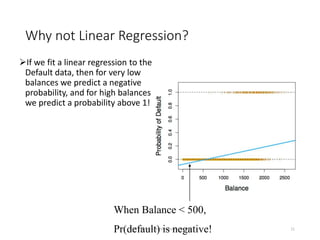
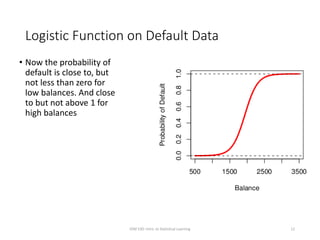
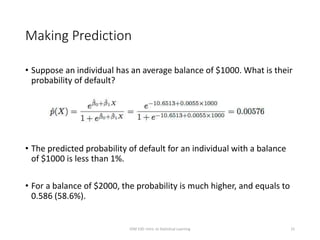
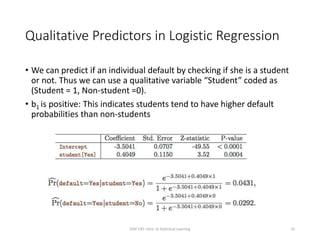
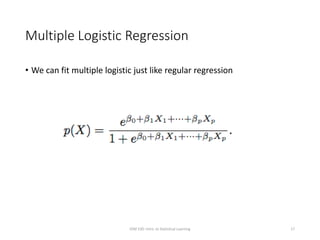
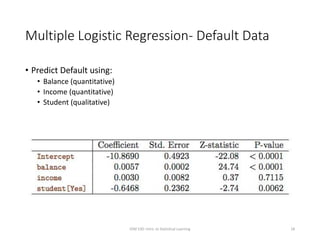
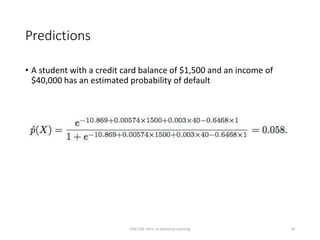
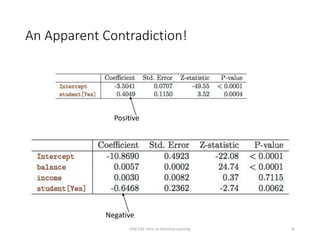
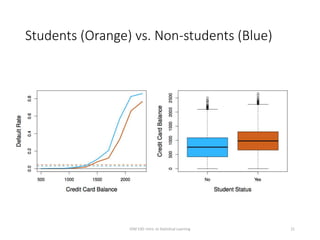
Classification Methods
Chapter 04 (part 01)
IOM 530: Intro. to Statistical Learning 1
Logistic Regression
IOM 530: Intro. to Statistical Learning 2
Outline
Cases:
Orange Juice Brand Preference
Credit Card Default Data
Why Not Linear Regression?
Simple Logistic Regression
Logistic Function
 Interpreting the coefficients
Making Predictions
Adding Qualitative Predictors
Multiple Logistic Regression
IOM 530: Intro. to Statistical Learning 3
Case 1: Brand Preference for Orange Juice
• We would like to predict what customers prefer to buy: Citrus Hill or
Minute Maid orange juice?
• The Y (Purchase) variable is categorical: 0 or 1
• The X (LoyalCH) variable is a numerical value (between 0 and 1)
which specifies the how much the customers are loyal to the Citrus
Hill (CH) orange juice
• Can we use Linear Regression when Y is categorical?
IOM 530: Intro. to Statistical Learning 4
Why not Linear Regression?
When Y only takes on values of 0 and 1, why standard linear
regression in inappropriate?
IOM 530: Intro. to Statistical Learning 5
0.0
0.2
0.4
0.5
0.7
0.9
.0 .1 .2 .3 .4 .5 .6 .7 .8 .9 1.0
LoyalCH
Purchase
How do we interpret
values of Y between 0
and 1?
How do we
interpret values
greater than 1?
Problems
• The regression line 0+1X can take on any value between negative
and positive infinity
• In the orange juice classification problem, Y can only take on two
possible values: 0 or 1.
• Therefore the regression line almost always predicts the wrong value
for Y in classification problems
IOM 530: Intro. to Statistical Learning 6
Solution: Use Logistic Function
• Instead of trying to predict Y, let’s try to predict P(Y = 1), i.e., the
probability a customer buys Citrus Hill (CH) juice.
• Thus, we can model P(Y = 1) using a function that gives outputs
between 0 and 1.
• We can use the logistic function
• Logistic Regression!
IOM 530: Intro. to Statistical Learning 7
X
X
e
e
YPp 10
10
1
)1( 





0
0.1
0.2
0.3
0.4
0.5
0.6
0.7
0.8
0.9
1
Probability
-5 -4 -3 -2 -1 0 1 2 3 4 5
X
Logistic Regression
• Logistic regression is very similar
to linear regression
• We come up with b0 and b1 to
estimate 0 and 1.
• We have similar problems and
questions as in linear regression
• e.g. Is 1 equal to 0? How sure are
we about our guesses for 0 and
1?
IOM 530: Intro. to Statistical Learning 8
0
0.25
0.5
0.75
1
.0 .2 .4 .6 .7 .9
LoyalCH
CH
MM
If LoyalCH is about .6 then Pr(CH)  .7.
P(Purchase)
Case 2: Credit Card Default Data
We would like to be able to predict customers that are likely to
default
Possible X variables are:
Annual Income
Monthly credit card balance
The Y variable (Default) is categorical: Yes or No
How do we check the relationship between Y and X?
IOM 530: Intro. to Statistical Learning 9
The Default Dataset
IOM 530: Intro. to Statistical Learning 10
Why not Linear Regression?
If we fit a linear regression to the
Default data, then for very low
balances we predict a negative
probability, and for high balances
we predict a probability above 1!
IOM 530: Intro. to Statistical Learning 11
When Balance < 500,
Pr(default) is negative!
Logistic Function on Default Data
• Now the probability of
default is close to, but
not less than zero for
low balances. And close
to but not above 1 for
high balances
IOM 530: Intro. to Statistical Learning 12
Interpreting 1
• Interpreting what 1 means is not very easy with logistic regression,
simply because we are predicting P(Y) and not Y.
• If 1 =0, this means that there is no relationship between Y and X.
• If 1 >0, this means that when X gets larger so does the probability
that Y = 1.
• If 1 <0, this means that when X gets larger, the probability that Y = 1
gets smaller.
• But how much bigger or smaller depends on where we are on the
slope
IOM 530: Intro. to Statistical Learning 13
Are the coefficients significant?
• We still want to perform a hypothesis test to see whether we can be
sure that are 0 and 1 significantly different from zero.
• We use a Z test instead of a T test, but of course that doesn’t change
the way we interpret the p-value
• Here the p-value for balance is very small, and b1 is positive, so we
are sure that if the balance increase, then the probability of default
will increase as well.
IOM 530: Intro. to Statistical Learning 14
Making Prediction
• Suppose an individual has an average balance of $1000. What is their
probability of default?
• The predicted probability of default for an individual with a balance
of $1000 is less than 1%.
• For a balance of $2000, the probability is much higher, and equals to
0.586 (58.6%).
IOM 530: Intro. to Statistical Learning 15
Qualitative Predictors in Logistic Regression
• We can predict if an individual default by checking if she is a student
or not. Thus we can use a qualitative variable “Student” coded as
(Student = 1, Non-student =0).
• b1 is positive: This indicates students tend to have higher default
probabilities than non-students
IOM 530: Intro. to Statistical Learning 16
Multiple Logistic Regression
• We can fit multiple logistic just like regular regression
IOM 530: Intro. to Statistical Learning 17
Multiple Logistic Regression- Default Data
• Predict Default using:
• Balance (quantitative)
• Income (quantitative)
• Student (qualitative)
IOM 530: Intro. to Statistical Learning 18
Predictions
• A student with a credit card balance of $1,500 and an income of
$40,000 has an estimated probability of default
IOM 530: Intro. to Statistical Learning 19
An Apparent Contradiction!
IOM 530: Intro. to Statistical Learning 20
Positive
Negative
Students (Orange) vs. Non-students (Blue)
IOM 530: Intro. to Statistical Learning 21
To whom should credit be offered?
• A student is risker than non students if no information about the
credit card balance is available
• However, that student is less risky than a non student with the same
credit card balance!
IOM 530: Intro. to Statistical Learning 22

classification_methods-logistic regression Machine Learning

  • 1.
    Classification Methods Chapter 04(part 01) IOM 530: Intro. to Statistical Learning 1
  • 2.
    Logistic Regression IOM 530:Intro. to Statistical Learning 2
  • 3.
    Outline Cases: Orange Juice BrandPreference Credit Card Default Data Why Not Linear Regression? Simple Logistic Regression Logistic Function  Interpreting the coefficients Making Predictions Adding Qualitative Predictors Multiple Logistic Regression IOM 530: Intro. to Statistical Learning 3
  • 4.
    Case 1: BrandPreference for Orange Juice • We would like to predict what customers prefer to buy: Citrus Hill or Minute Maid orange juice? • The Y (Purchase) variable is categorical: 0 or 1 • The X (LoyalCH) variable is a numerical value (between 0 and 1) which specifies the how much the customers are loyal to the Citrus Hill (CH) orange juice • Can we use Linear Regression when Y is categorical? IOM 530: Intro. to Statistical Learning 4
  • 5.
    Why not LinearRegression? When Y only takes on values of 0 and 1, why standard linear regression in inappropriate? IOM 530: Intro. to Statistical Learning 5 0.0 0.2 0.4 0.5 0.7 0.9 .0 .1 .2 .3 .4 .5 .6 .7 .8 .9 1.0 LoyalCH Purchase How do we interpret values of Y between 0 and 1? How do we interpret values greater than 1?
  • 6.
    Problems • The regressionline 0+1X can take on any value between negative and positive infinity • In the orange juice classification problem, Y can only take on two possible values: 0 or 1. • Therefore the regression line almost always predicts the wrong value for Y in classification problems IOM 530: Intro. to Statistical Learning 6
  • 7.
    Solution: Use LogisticFunction • Instead of trying to predict Y, let’s try to predict P(Y = 1), i.e., the probability a customer buys Citrus Hill (CH) juice. • Thus, we can model P(Y = 1) using a function that gives outputs between 0 and 1. • We can use the logistic function • Logistic Regression! IOM 530: Intro. to Statistical Learning 7 X X e e YPp 10 10 1 )1(       0 0.1 0.2 0.3 0.4 0.5 0.6 0.7 0.8 0.9 1 Probability -5 -4 -3 -2 -1 0 1 2 3 4 5 X
  • 8.
    Logistic Regression • Logisticregression is very similar to linear regression • We come up with b0 and b1 to estimate 0 and 1. • We have similar problems and questions as in linear regression • e.g. Is 1 equal to 0? How sure are we about our guesses for 0 and 1? IOM 530: Intro. to Statistical Learning 8 0 0.25 0.5 0.75 1 .0 .2 .4 .6 .7 .9 LoyalCH CH MM If LoyalCH is about .6 then Pr(CH)  .7. P(Purchase)
  • 9.
    Case 2: CreditCard Default Data We would like to be able to predict customers that are likely to default Possible X variables are: Annual Income Monthly credit card balance The Y variable (Default) is categorical: Yes or No How do we check the relationship between Y and X? IOM 530: Intro. to Statistical Learning 9
  • 10.
    The Default Dataset IOM530: Intro. to Statistical Learning 10
  • 11.
    Why not LinearRegression? If we fit a linear regression to the Default data, then for very low balances we predict a negative probability, and for high balances we predict a probability above 1! IOM 530: Intro. to Statistical Learning 11 When Balance < 500, Pr(default) is negative!
  • 12.
    Logistic Function onDefault Data • Now the probability of default is close to, but not less than zero for low balances. And close to but not above 1 for high balances IOM 530: Intro. to Statistical Learning 12
  • 13.
    Interpreting 1 • Interpretingwhat 1 means is not very easy with logistic regression, simply because we are predicting P(Y) and not Y. • If 1 =0, this means that there is no relationship between Y and X. • If 1 >0, this means that when X gets larger so does the probability that Y = 1. • If 1 <0, this means that when X gets larger, the probability that Y = 1 gets smaller. • But how much bigger or smaller depends on where we are on the slope IOM 530: Intro. to Statistical Learning 13
  • 14.
    Are the coefficientssignificant? • We still want to perform a hypothesis test to see whether we can be sure that are 0 and 1 significantly different from zero. • We use a Z test instead of a T test, but of course that doesn’t change the way we interpret the p-value • Here the p-value for balance is very small, and b1 is positive, so we are sure that if the balance increase, then the probability of default will increase as well. IOM 530: Intro. to Statistical Learning 14
  • 15.
    Making Prediction • Supposean individual has an average balance of $1000. What is their probability of default? • The predicted probability of default for an individual with a balance of $1000 is less than 1%. • For a balance of $2000, the probability is much higher, and equals to 0.586 (58.6%). IOM 530: Intro. to Statistical Learning 15
  • 16.
    Qualitative Predictors inLogistic Regression • We can predict if an individual default by checking if she is a student or not. Thus we can use a qualitative variable “Student” coded as (Student = 1, Non-student =0). • b1 is positive: This indicates students tend to have higher default probabilities than non-students IOM 530: Intro. to Statistical Learning 16
  • 17.
    Multiple Logistic Regression •We can fit multiple logistic just like regular regression IOM 530: Intro. to Statistical Learning 17
  • 18.
    Multiple Logistic Regression-Default Data • Predict Default using: • Balance (quantitative) • Income (quantitative) • Student (qualitative) IOM 530: Intro. to Statistical Learning 18
  • 19.
    Predictions • A studentwith a credit card balance of $1,500 and an income of $40,000 has an estimated probability of default IOM 530: Intro. to Statistical Learning 19
  • 20.
    An Apparent Contradiction! IOM530: Intro. to Statistical Learning 20 Positive Negative
  • 21.
    Students (Orange) vs.Non-students (Blue) IOM 530: Intro. to Statistical Learning 21
  • 22.
    To whom shouldcredit be offered? • A student is risker than non students if no information about the credit card balance is available • However, that student is less risky than a non student with the same credit card balance! IOM 530: Intro. to Statistical Learning 22