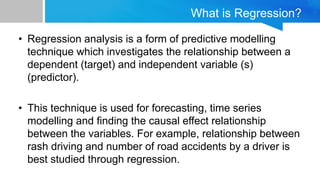
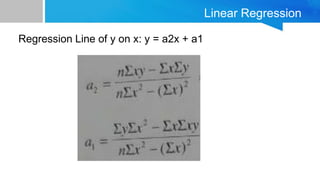
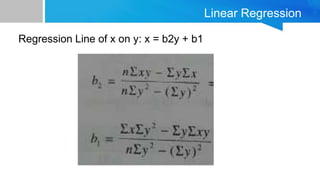
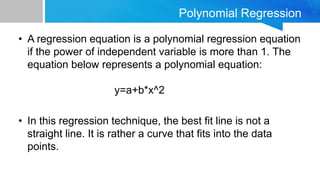
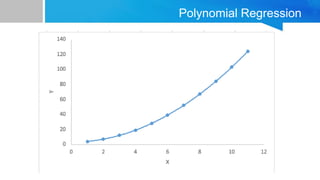
Regression
What is Regression?
• Regression analysis is a form of predictive modelling
technique which investigates the relationship between a
dependent (target) and independent variable (s)
(predictor).
• This technique is used for forecasting, time series
modelling and finding the causal effect relationship
between the variables. For example, relationship between
rash driving and number of road accidents by a driver is
best studied through regression.
What is Regression?
• In regression the output is continuous
• Many models could be used – Simplest is linear
regression
Linear Regression
Linear Regression
Important Points
• There must be linear relationship between independent
and dependent variables
• Linear Regression is very sensitive to Outliers. It can
terribly affect the regression line and eventually the
forecasted values.
Linear Regression
Regression Line of y on x: y = a2x + a1
Linear Regression
Regression Line of x on y: x = b2y + b1
Polynomial Regression
• A regression equation is a polynomial regression equation
if the power of independent variable is more than 1. The
equation below represents a polynomial equation:
y=a+b*x^2
• In this regression technique, the best fit line is not a
straight line. It is rather a curve that fits into the data
points.
Polynomial Regression
Important Points
• Look out for curve towards the ends and see whether
those shapes and trends make sense. Higher polynomials
can end up producing wierd results on extrapolation.
Applications of Regression
• Predictive Analysis
Forecasting future opportunities and risks is the most
prominent application of regression analysis in business.
Demand analysis, for instance, predicts the number of items
which a consumer will probably purchase.
Applications of Regression
• Operation Efficiency
Regression models can also be used to optimize business
processes.
In a call center, we can analyze the relationship between
wait times of callers and number of complaints.
Applications of Regression
• Supporting Decisions
Businesses today are overloaded with data on finances,
operations and customer purchases. Increasingly,
executives are now leaning on data analytics to make
informed business decisions.
Applications of Regression
• Correcting Errors
Regression is not only great for lending empirical support to
management decisions but also for identifying errors in
judgment. For example, a retail store manager may believe
that extending shopping hours will greatly increase sales.
Regression analysis, however, may indicate that the
increase in revenue might not be sufficient to support the
rise in operating expenses due to longer working hours
(such as additional employee labor charges).
Applications of Regression
• New Insights
Over time businesses have gathered a large volume of
unorganized data that has the potential to yield valuable
insights.
However, this data is useless without proper analysis.

Regression & It's Types

  • 1.
  • 2.
    What is Regression? •Regression analysis is a form of predictive modelling technique which investigates the relationship between a dependent (target) and independent variable (s) (predictor). • This technique is used for forecasting, time series modelling and finding the causal effect relationship between the variables. For example, relationship between rash driving and number of road accidents by a driver is best studied through regression.
  • 3.
    What is Regression? •In regression the output is continuous • Many models could be used – Simplest is linear regression
  • 4.
  • 5.
    Linear Regression Important Points •There must be linear relationship between independent and dependent variables • Linear Regression is very sensitive to Outliers. It can terribly affect the regression line and eventually the forecasted values.
  • 6.
    Linear Regression Regression Lineof y on x: y = a2x + a1
  • 7.
    Linear Regression Regression Lineof x on y: x = b2y + b1
  • 8.
    Polynomial Regression • Aregression equation is a polynomial regression equation if the power of independent variable is more than 1. The equation below represents a polynomial equation: y=a+b*x^2 • In this regression technique, the best fit line is not a straight line. It is rather a curve that fits into the data points.
  • 9.
  • 10.
    Polynomial Regression Important Points •Look out for curve towards the ends and see whether those shapes and trends make sense. Higher polynomials can end up producing wierd results on extrapolation.
  • 11.
    Applications of Regression •Predictive Analysis Forecasting future opportunities and risks is the most prominent application of regression analysis in business. Demand analysis, for instance, predicts the number of items which a consumer will probably purchase.
  • 12.
    Applications of Regression •Operation Efficiency Regression models can also be used to optimize business processes. In a call center, we can analyze the relationship between wait times of callers and number of complaints.
  • 13.
    Applications of Regression •Supporting Decisions Businesses today are overloaded with data on finances, operations and customer purchases. Increasingly, executives are now leaning on data analytics to make informed business decisions.
  • 14.
    Applications of Regression •Correcting Errors Regression is not only great for lending empirical support to management decisions but also for identifying errors in judgment. For example, a retail store manager may believe that extending shopping hours will greatly increase sales. Regression analysis, however, may indicate that the increase in revenue might not be sufficient to support the rise in operating expenses due to longer working hours (such as additional employee labor charges).
  • 15.
    Applications of Regression •New Insights Over time businesses have gathered a large volume of unorganized data that has the potential to yield valuable insights. However, this data is useless without proper analysis.