This report summarizes the results of a single site verification test for a Wi tribe LTE TDD project. Key findings include:
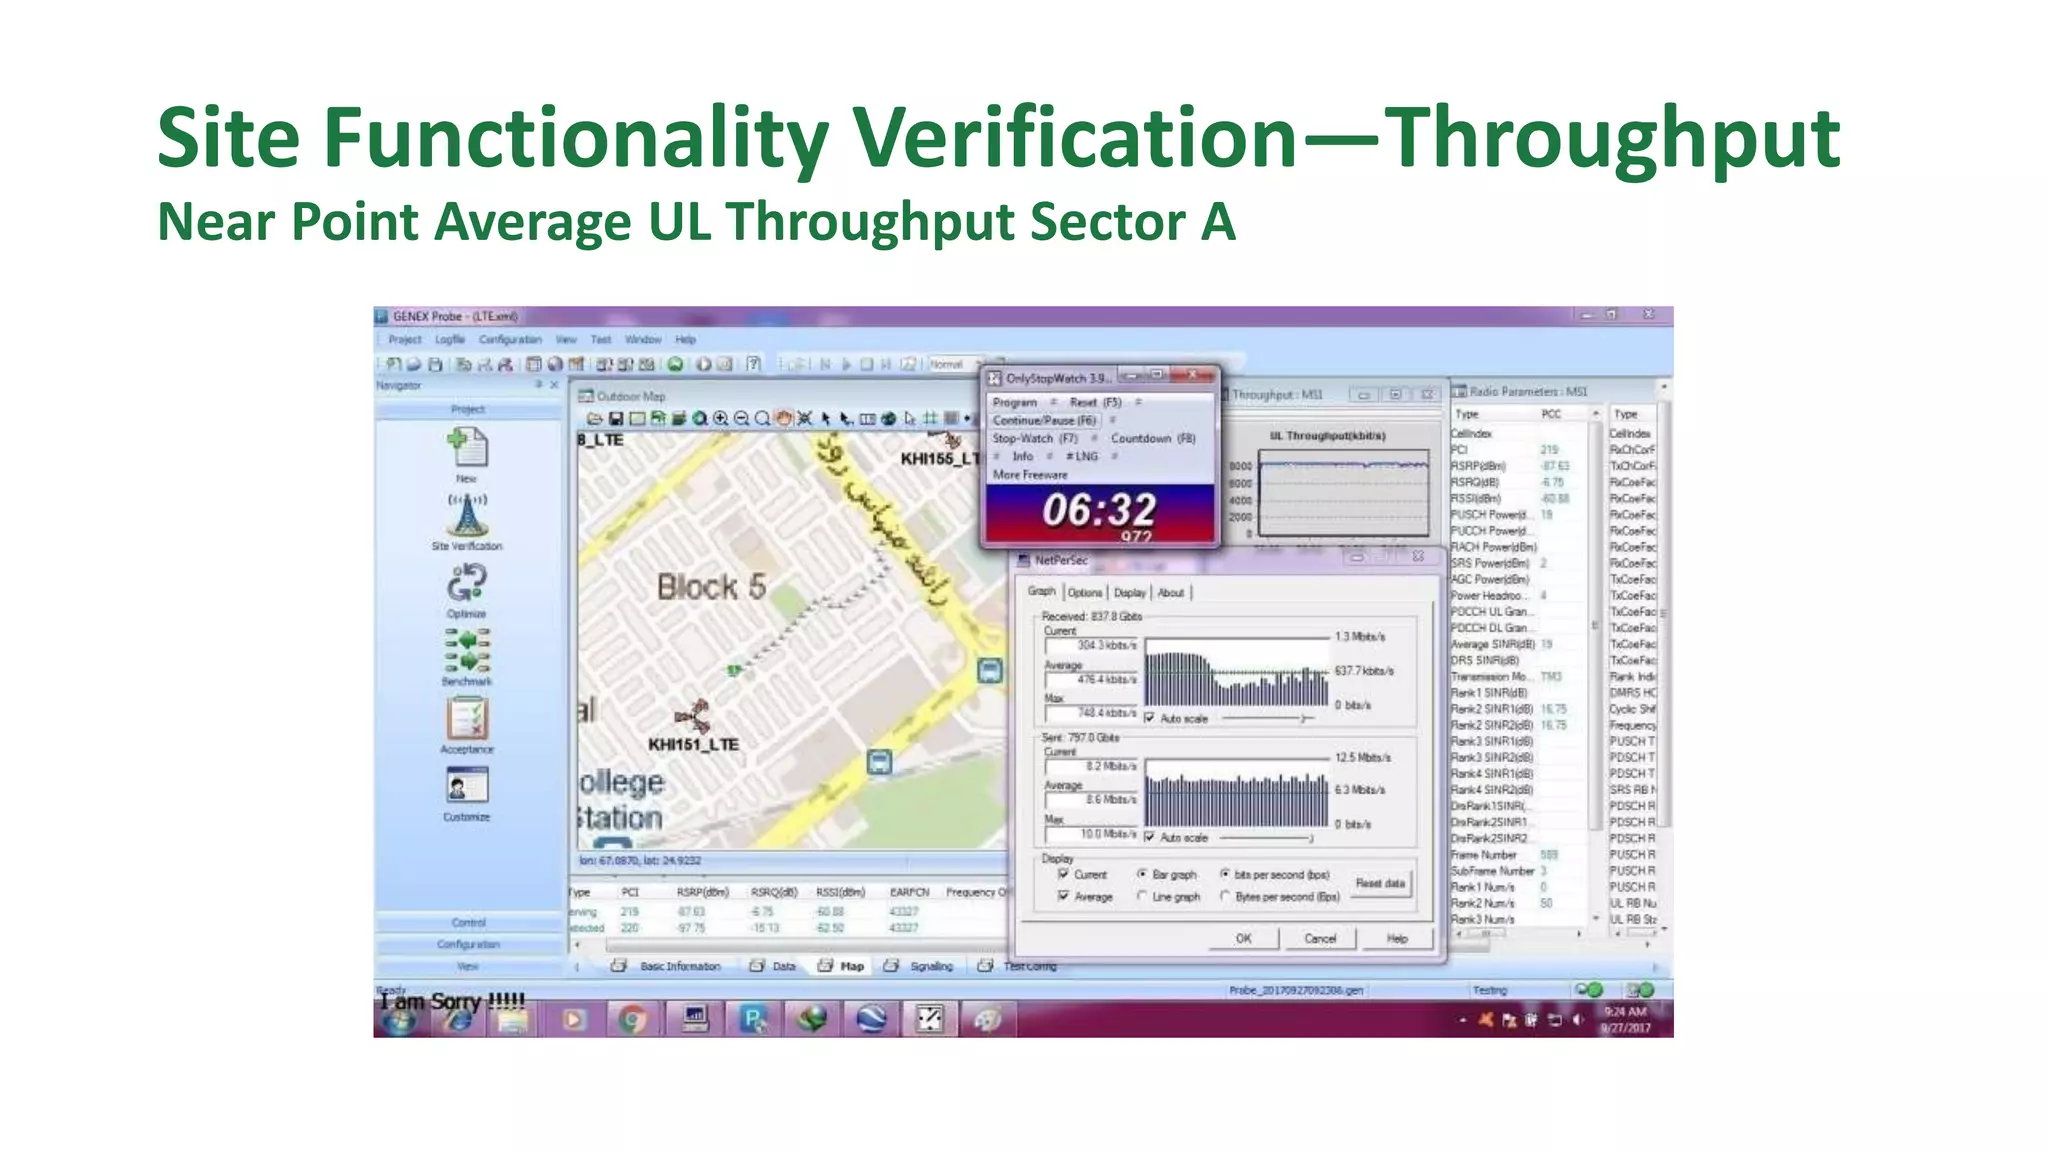
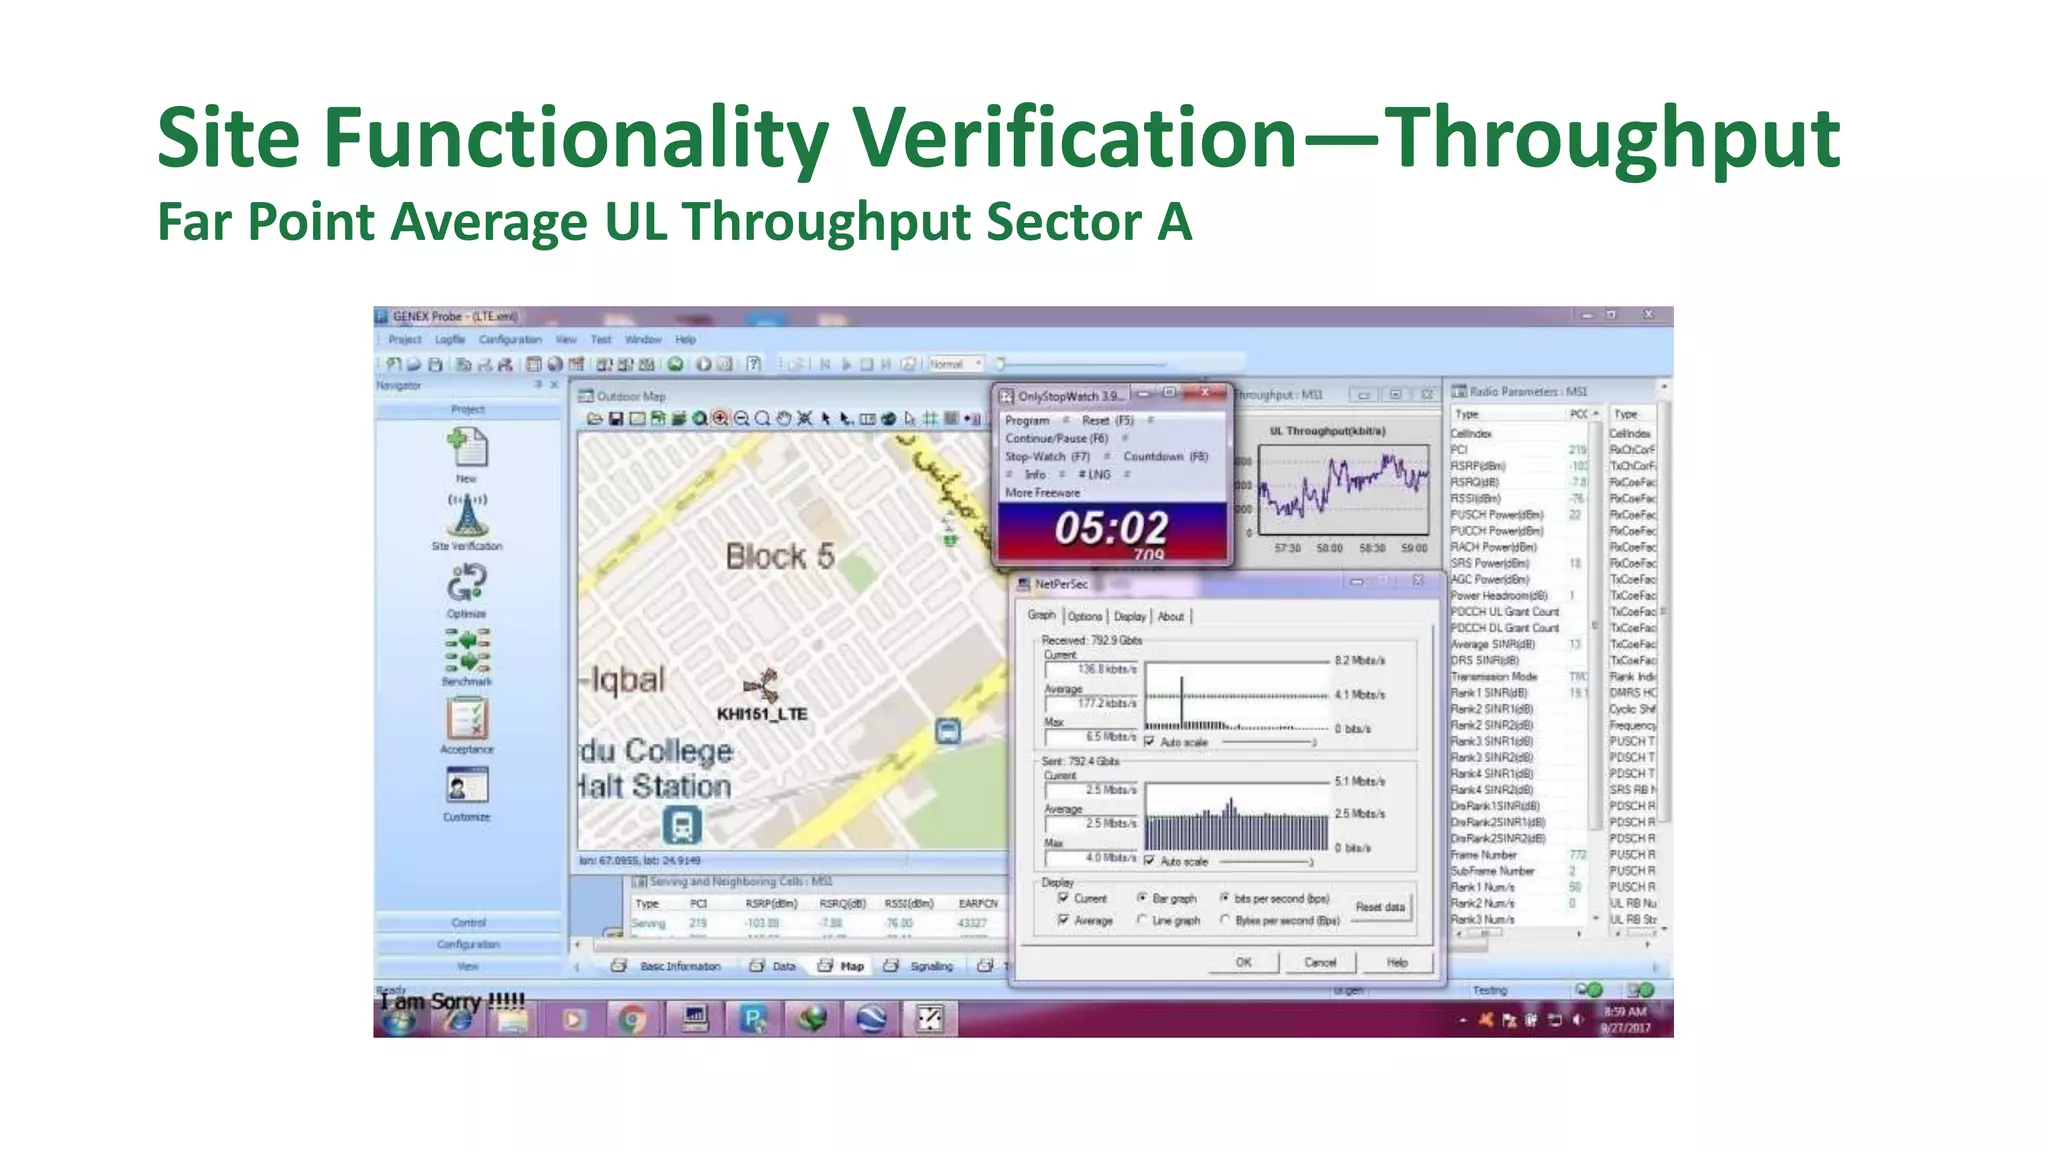
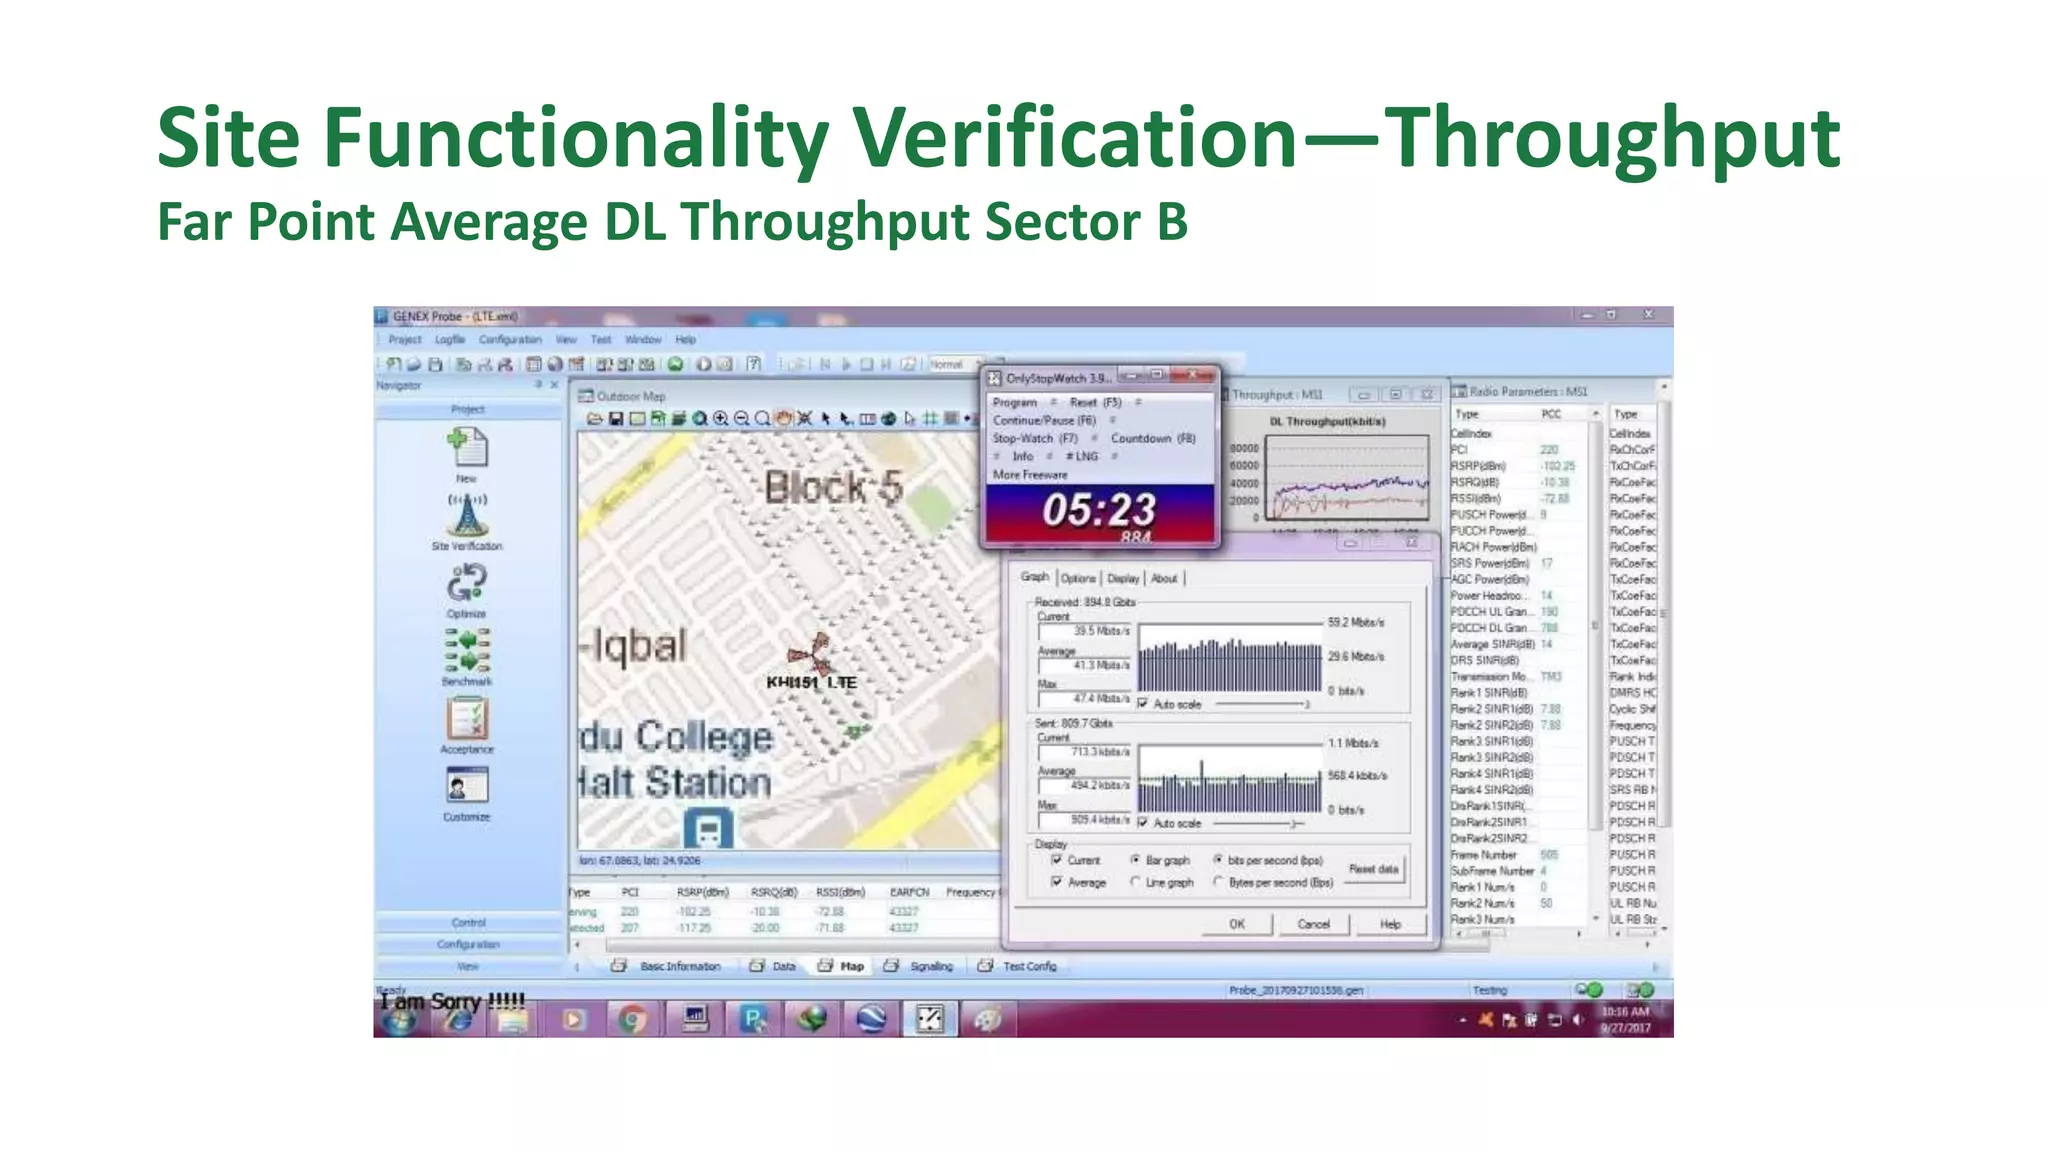
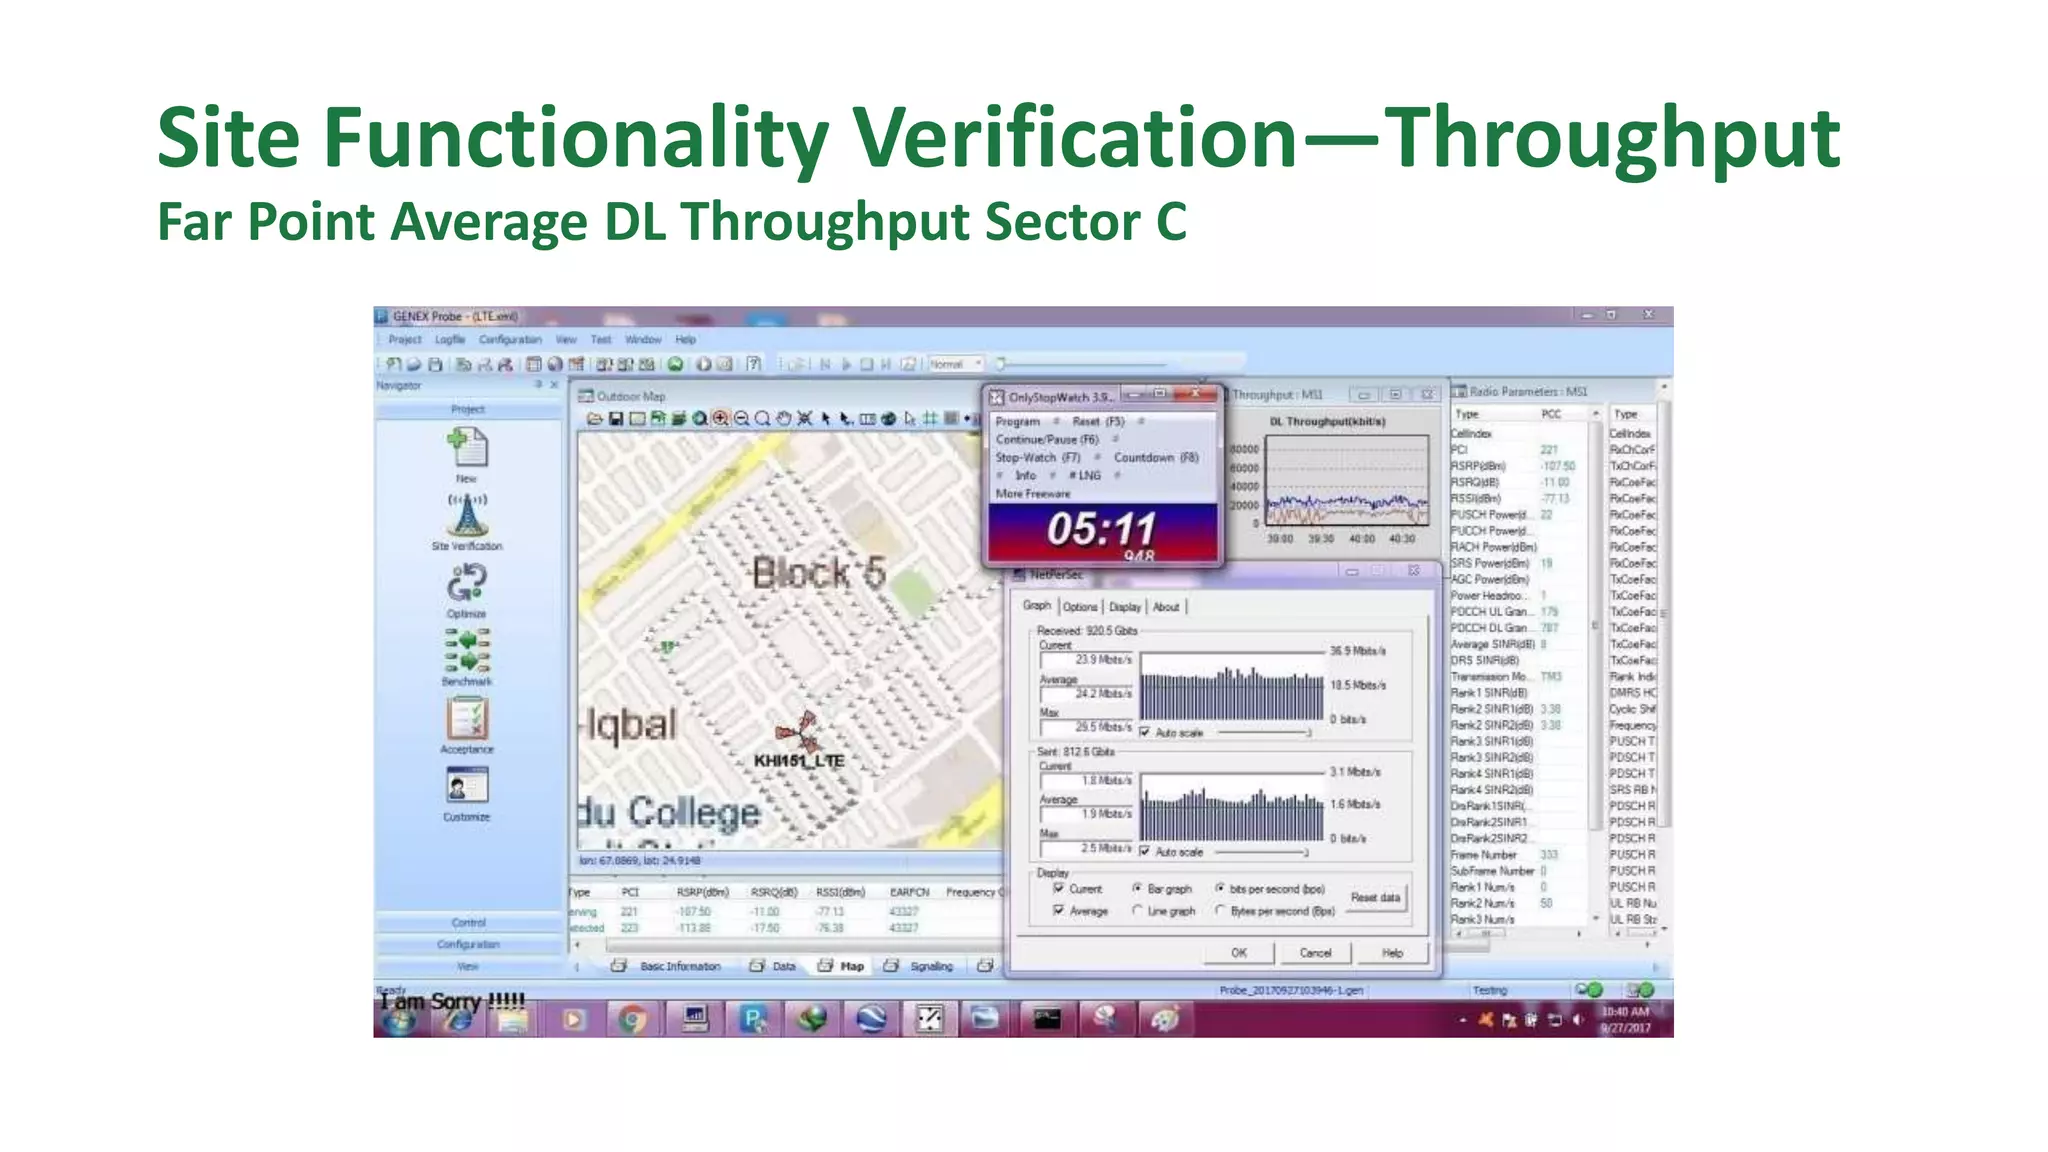
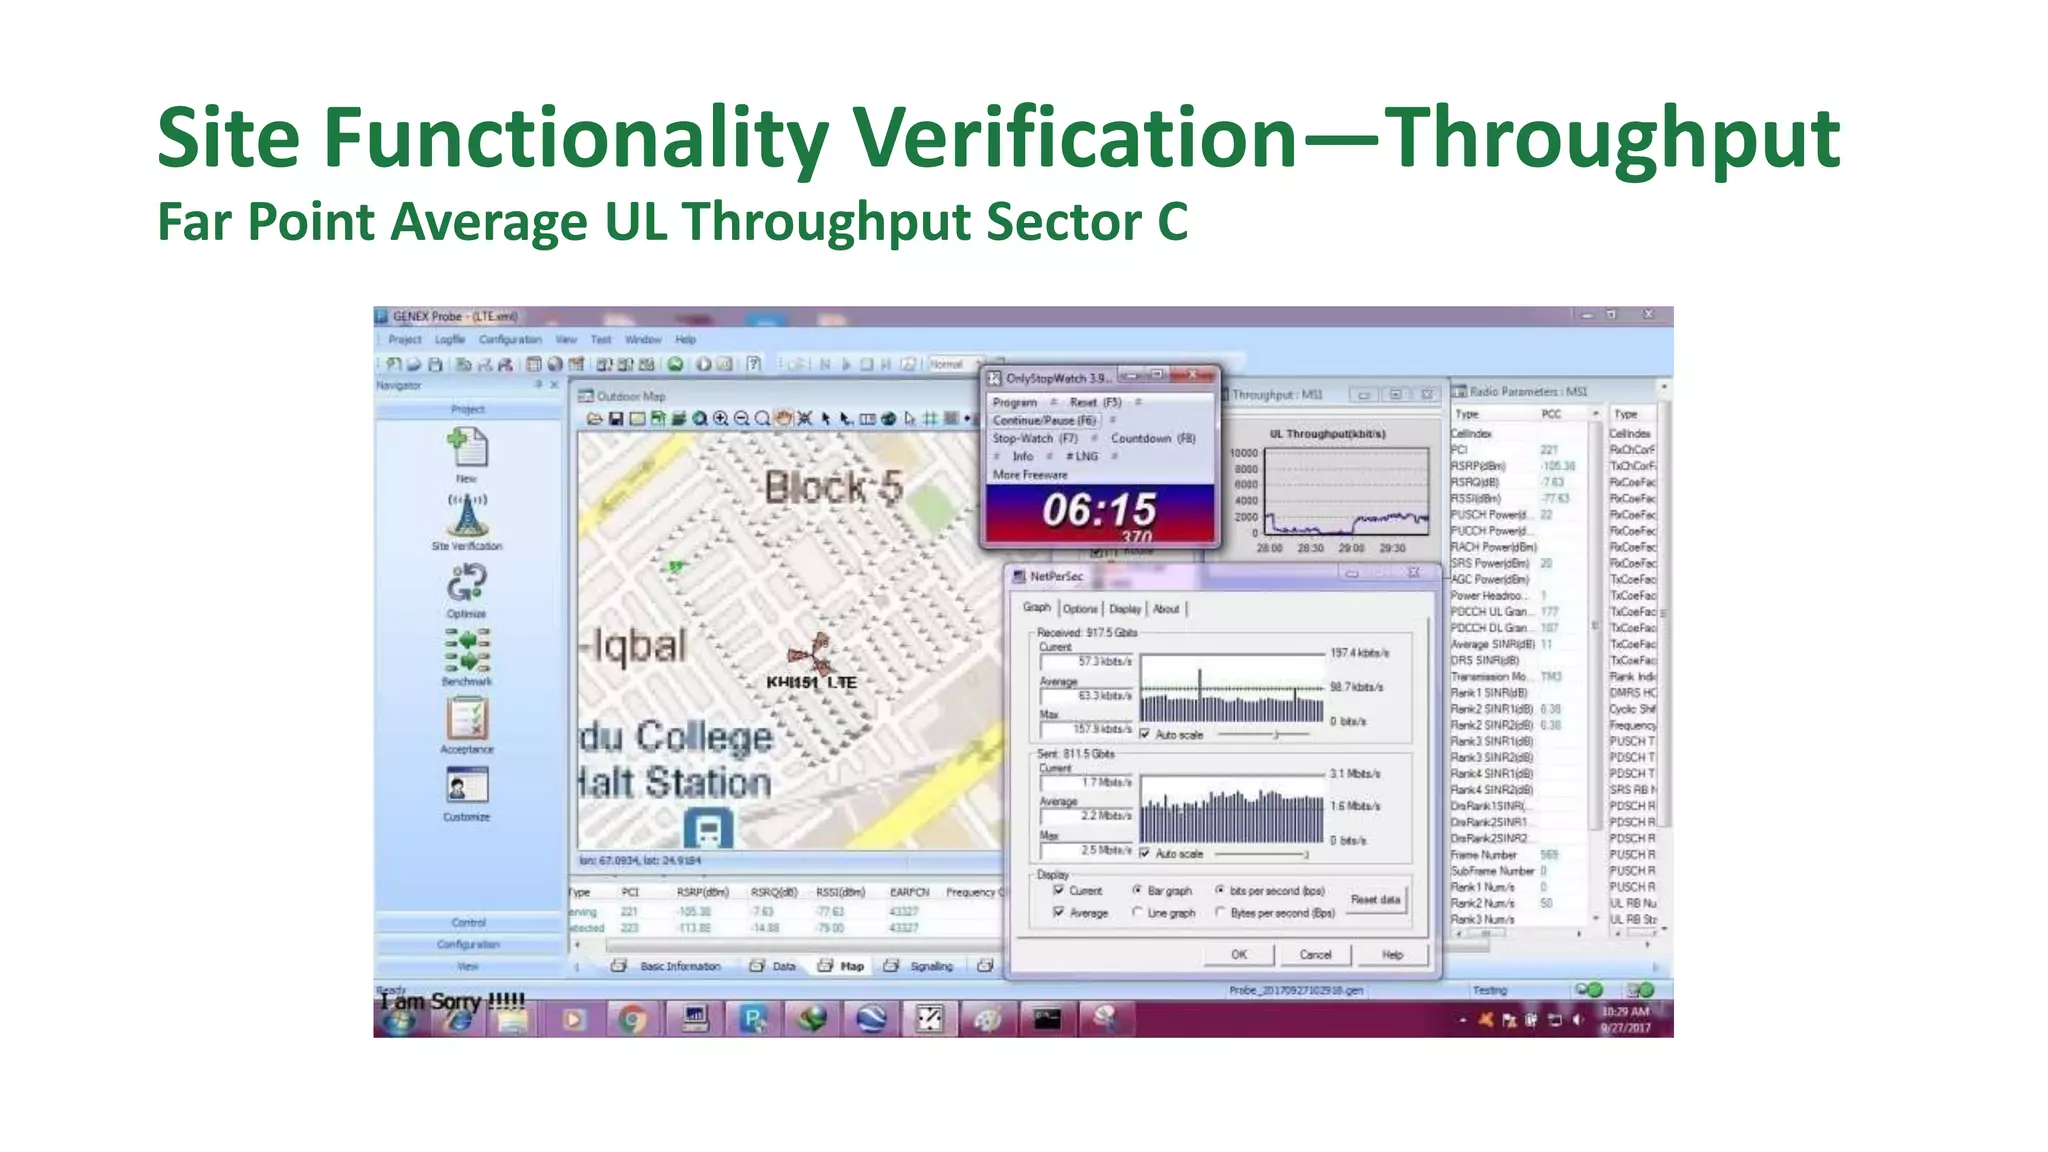
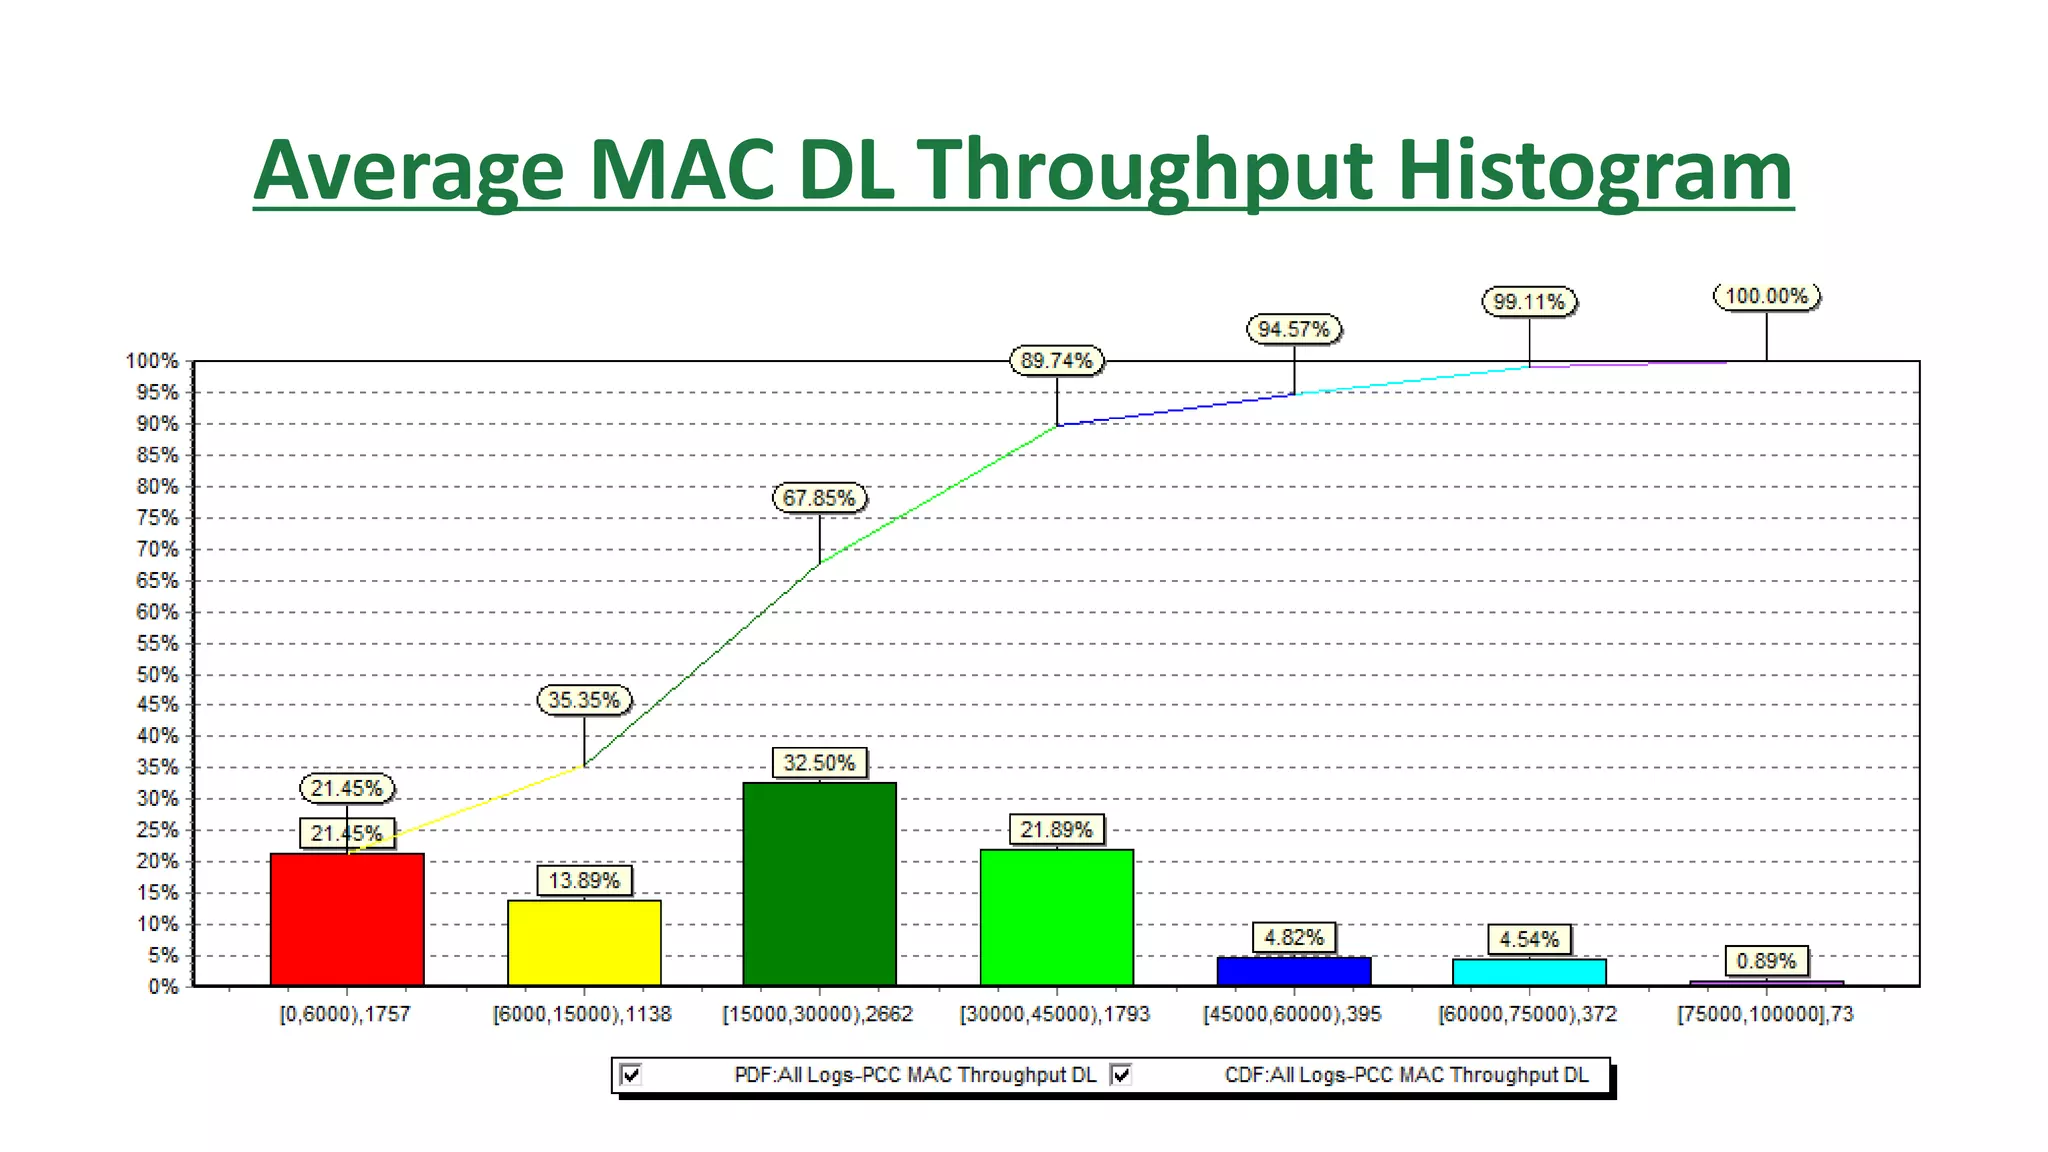
1) Throughput targets were met or exceeded at near points for all sectors, but not all far points.
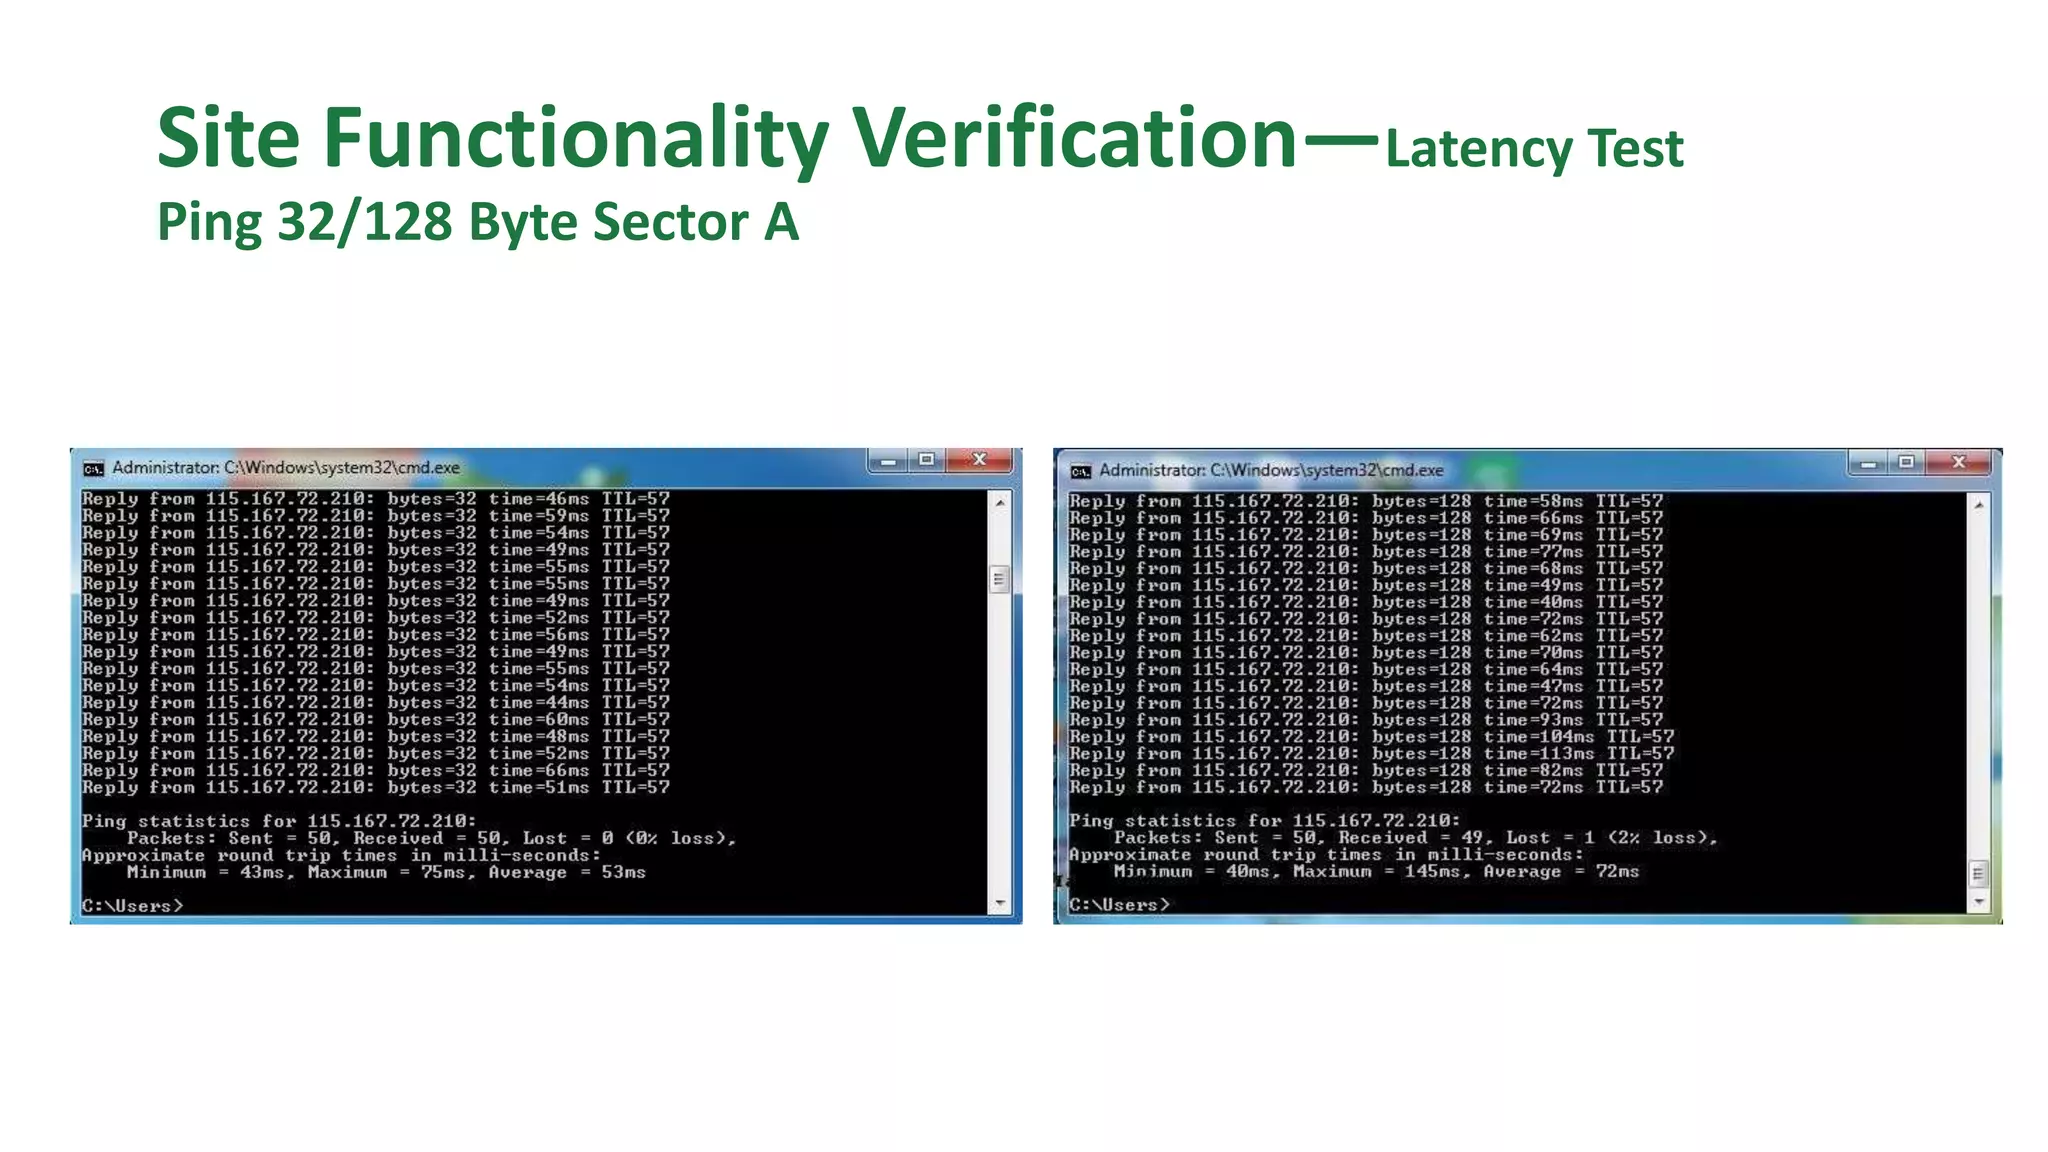
2) Latency was below targets for most tests.
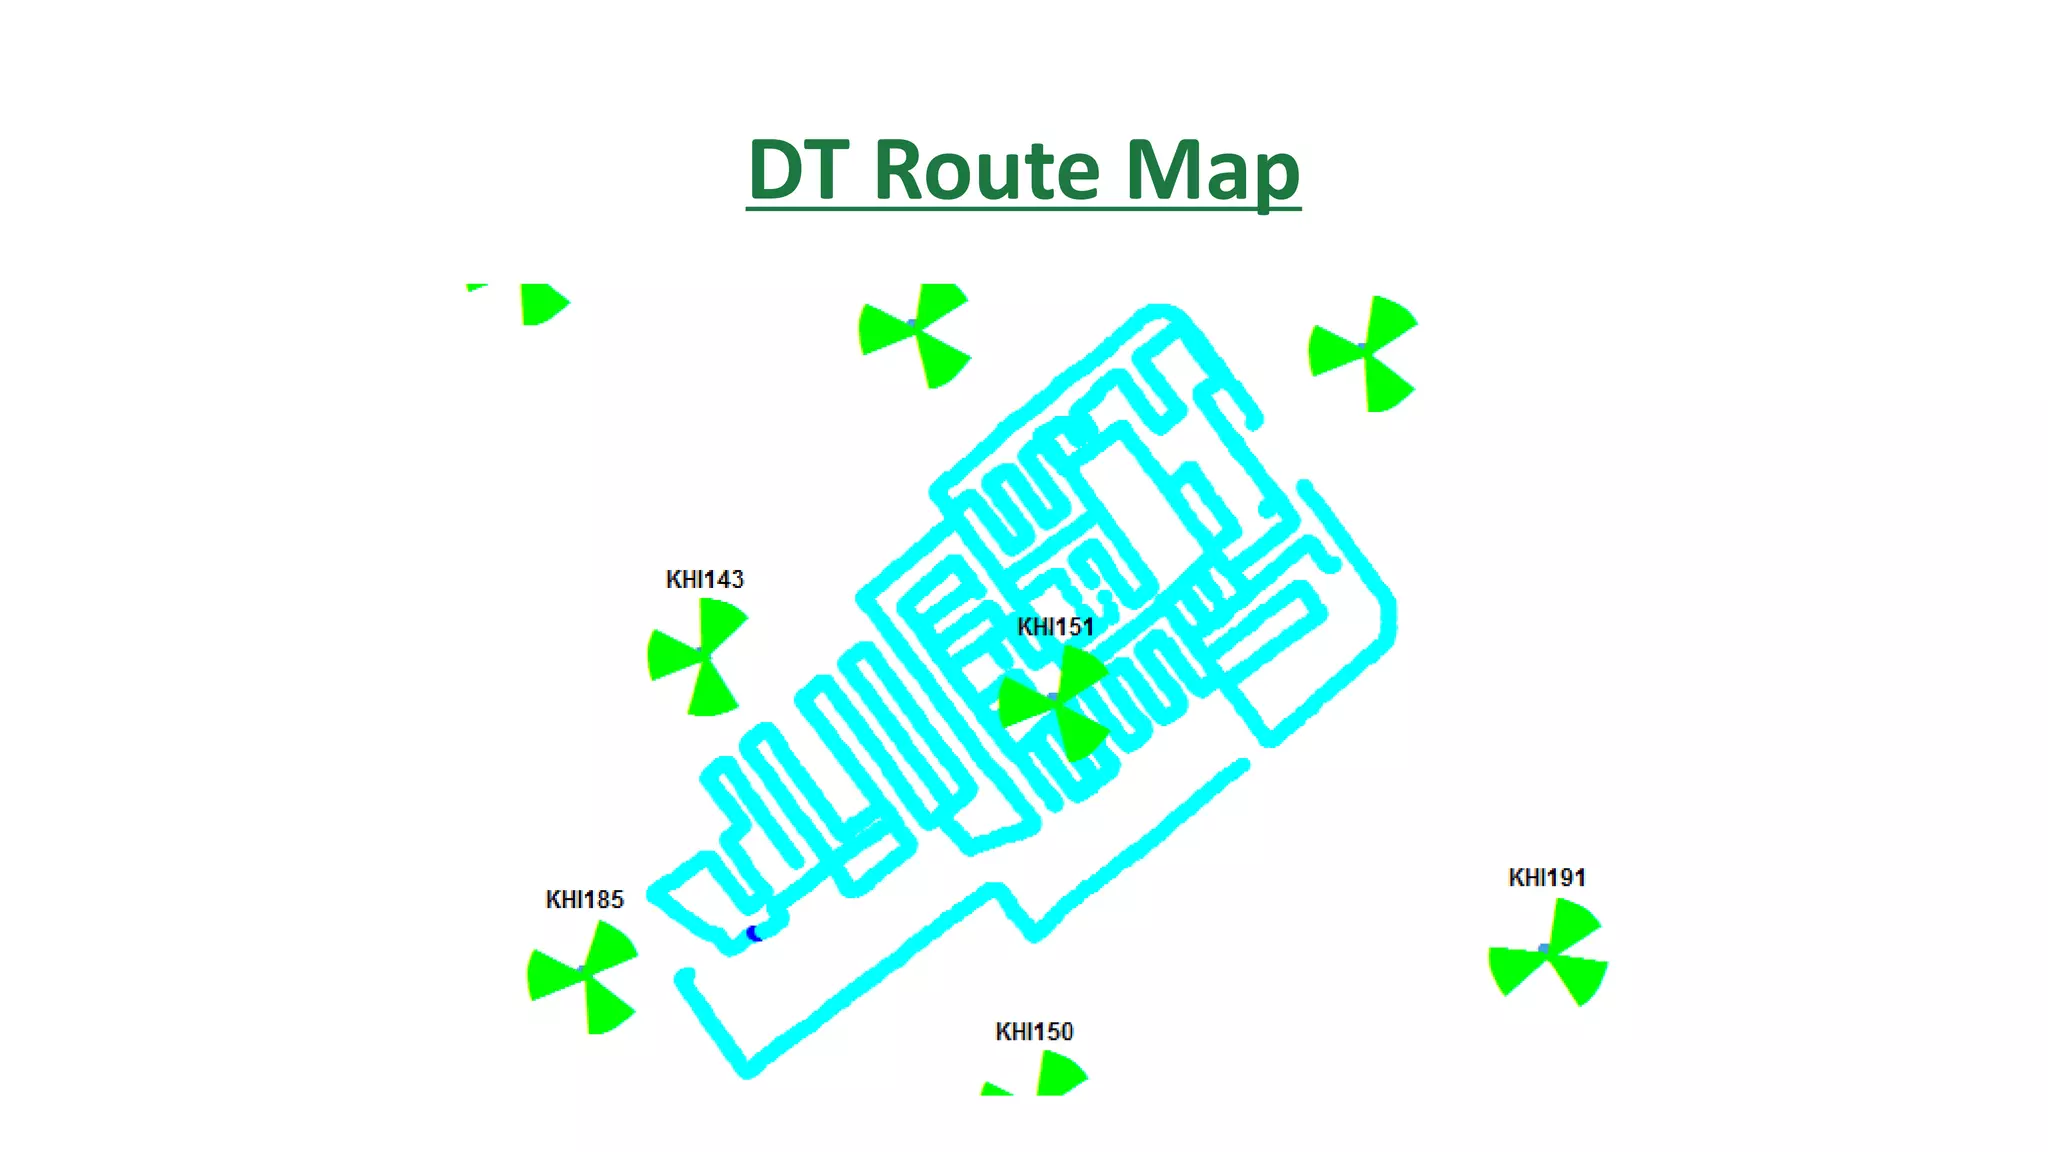
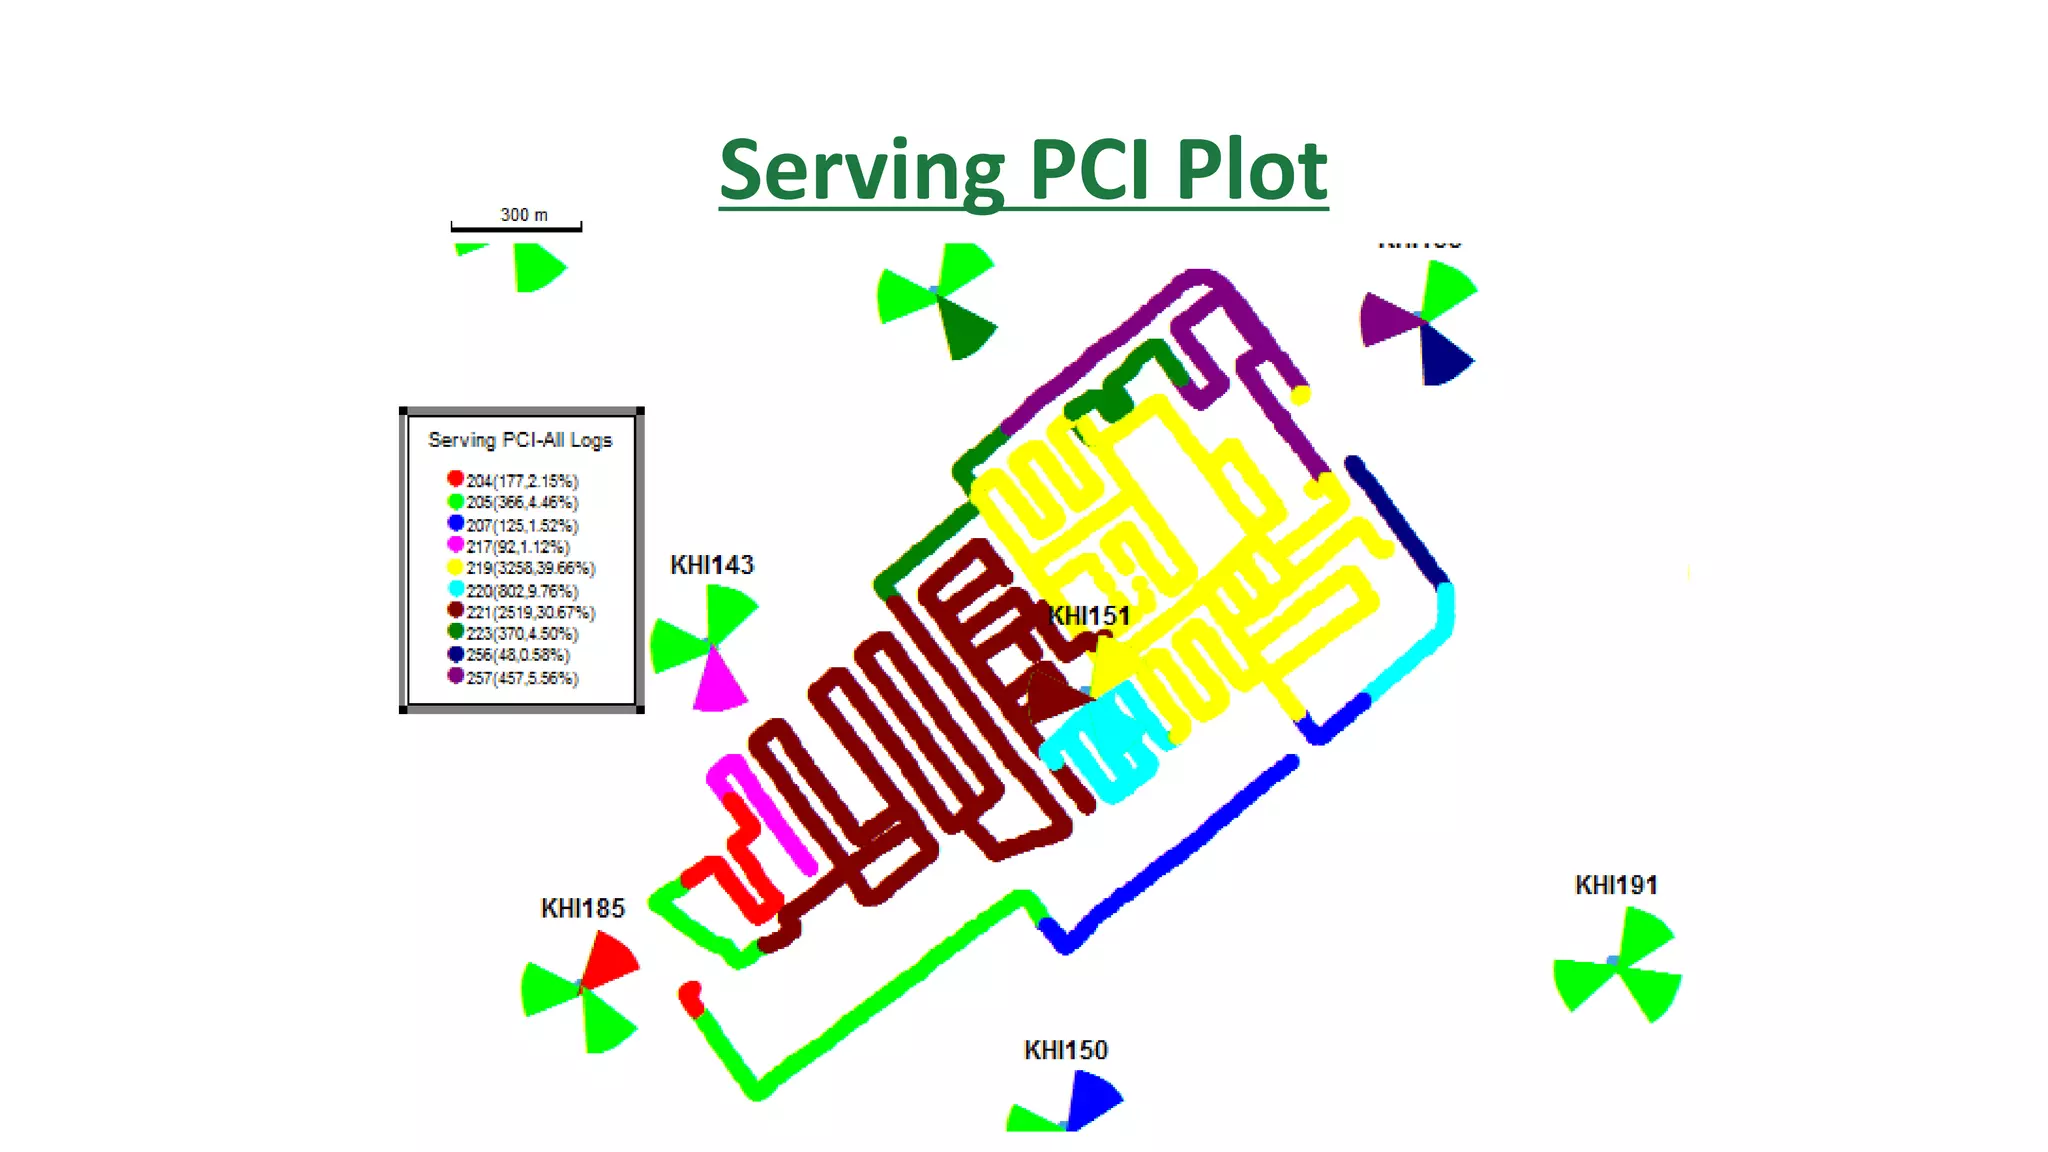
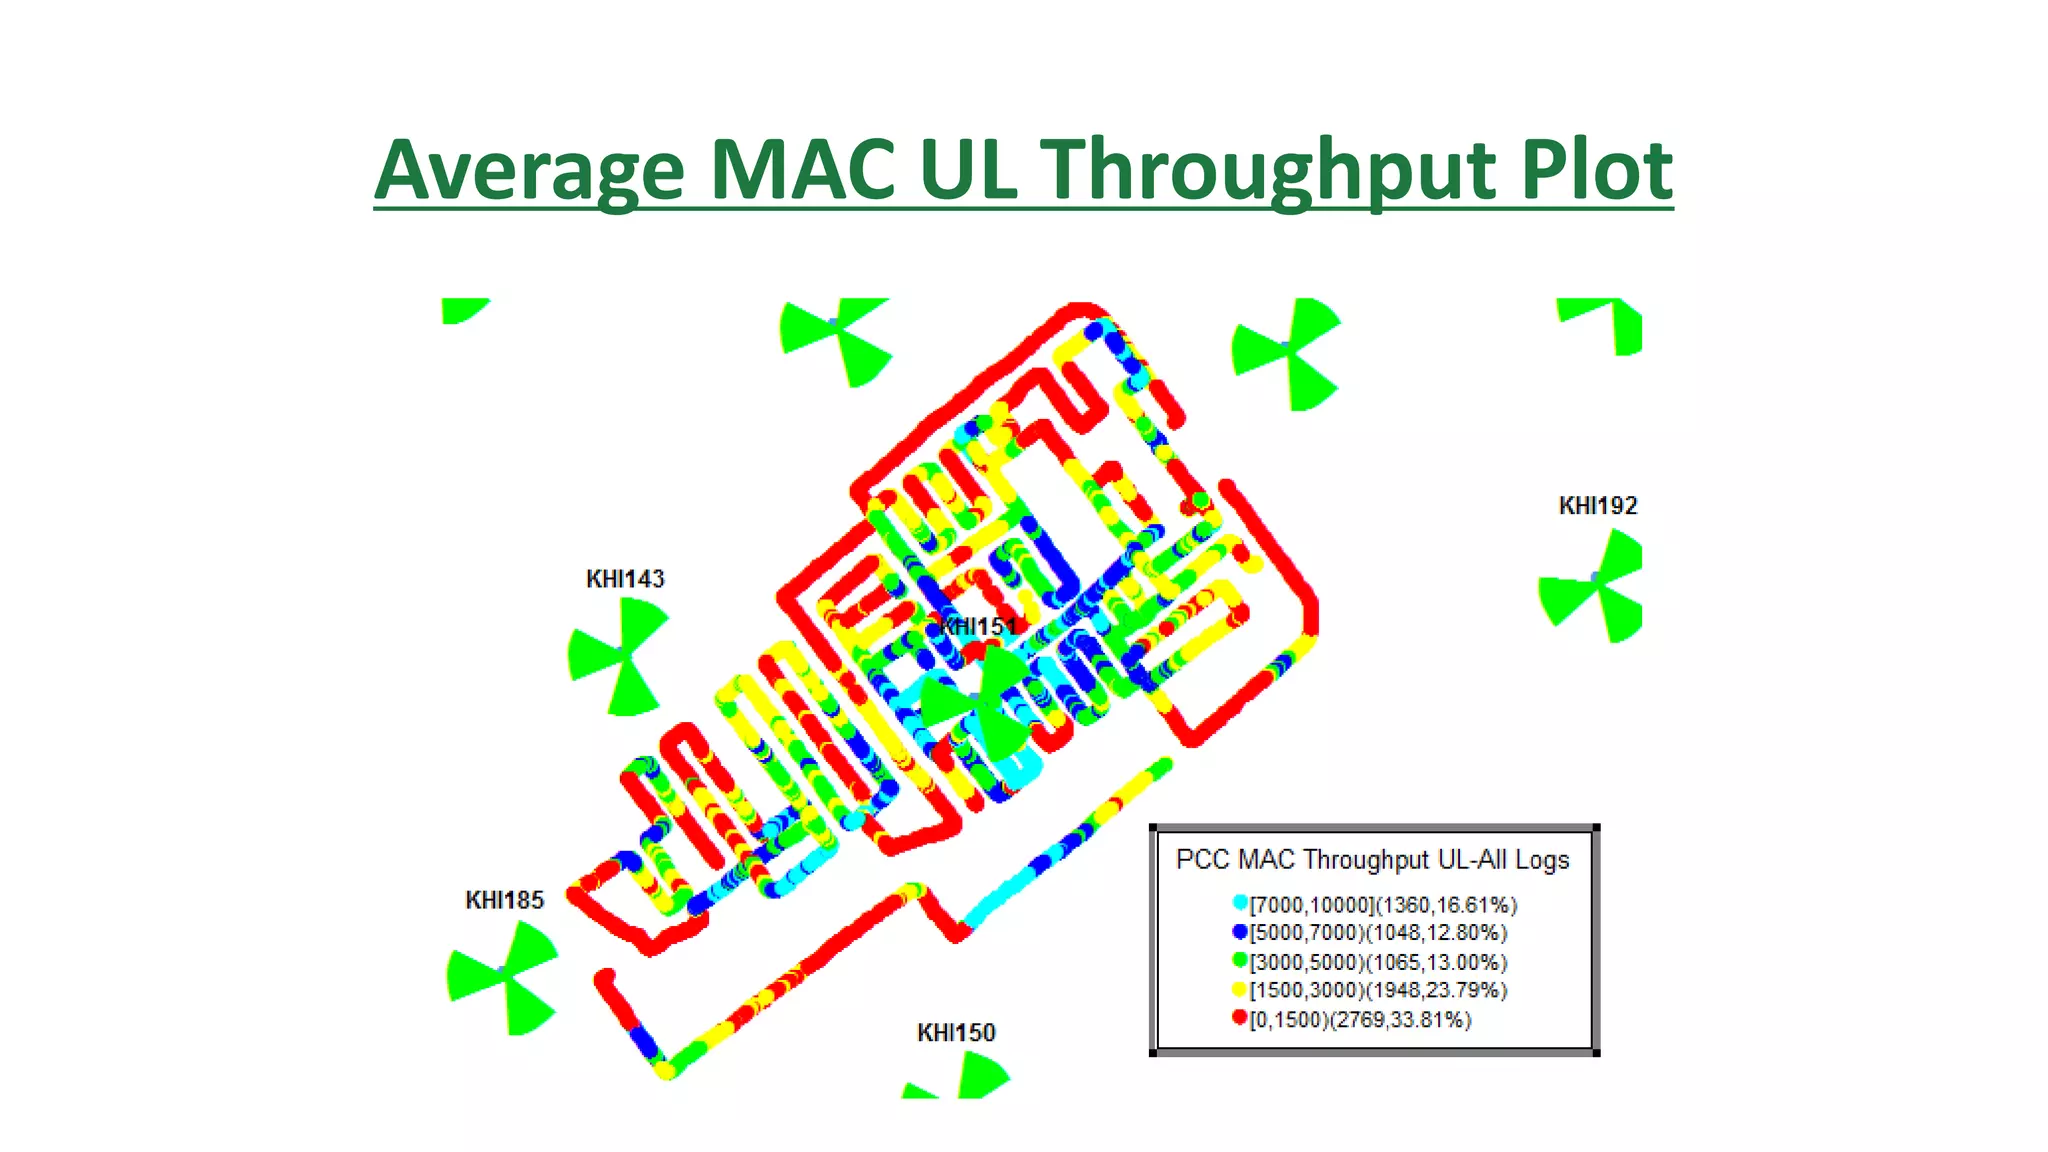
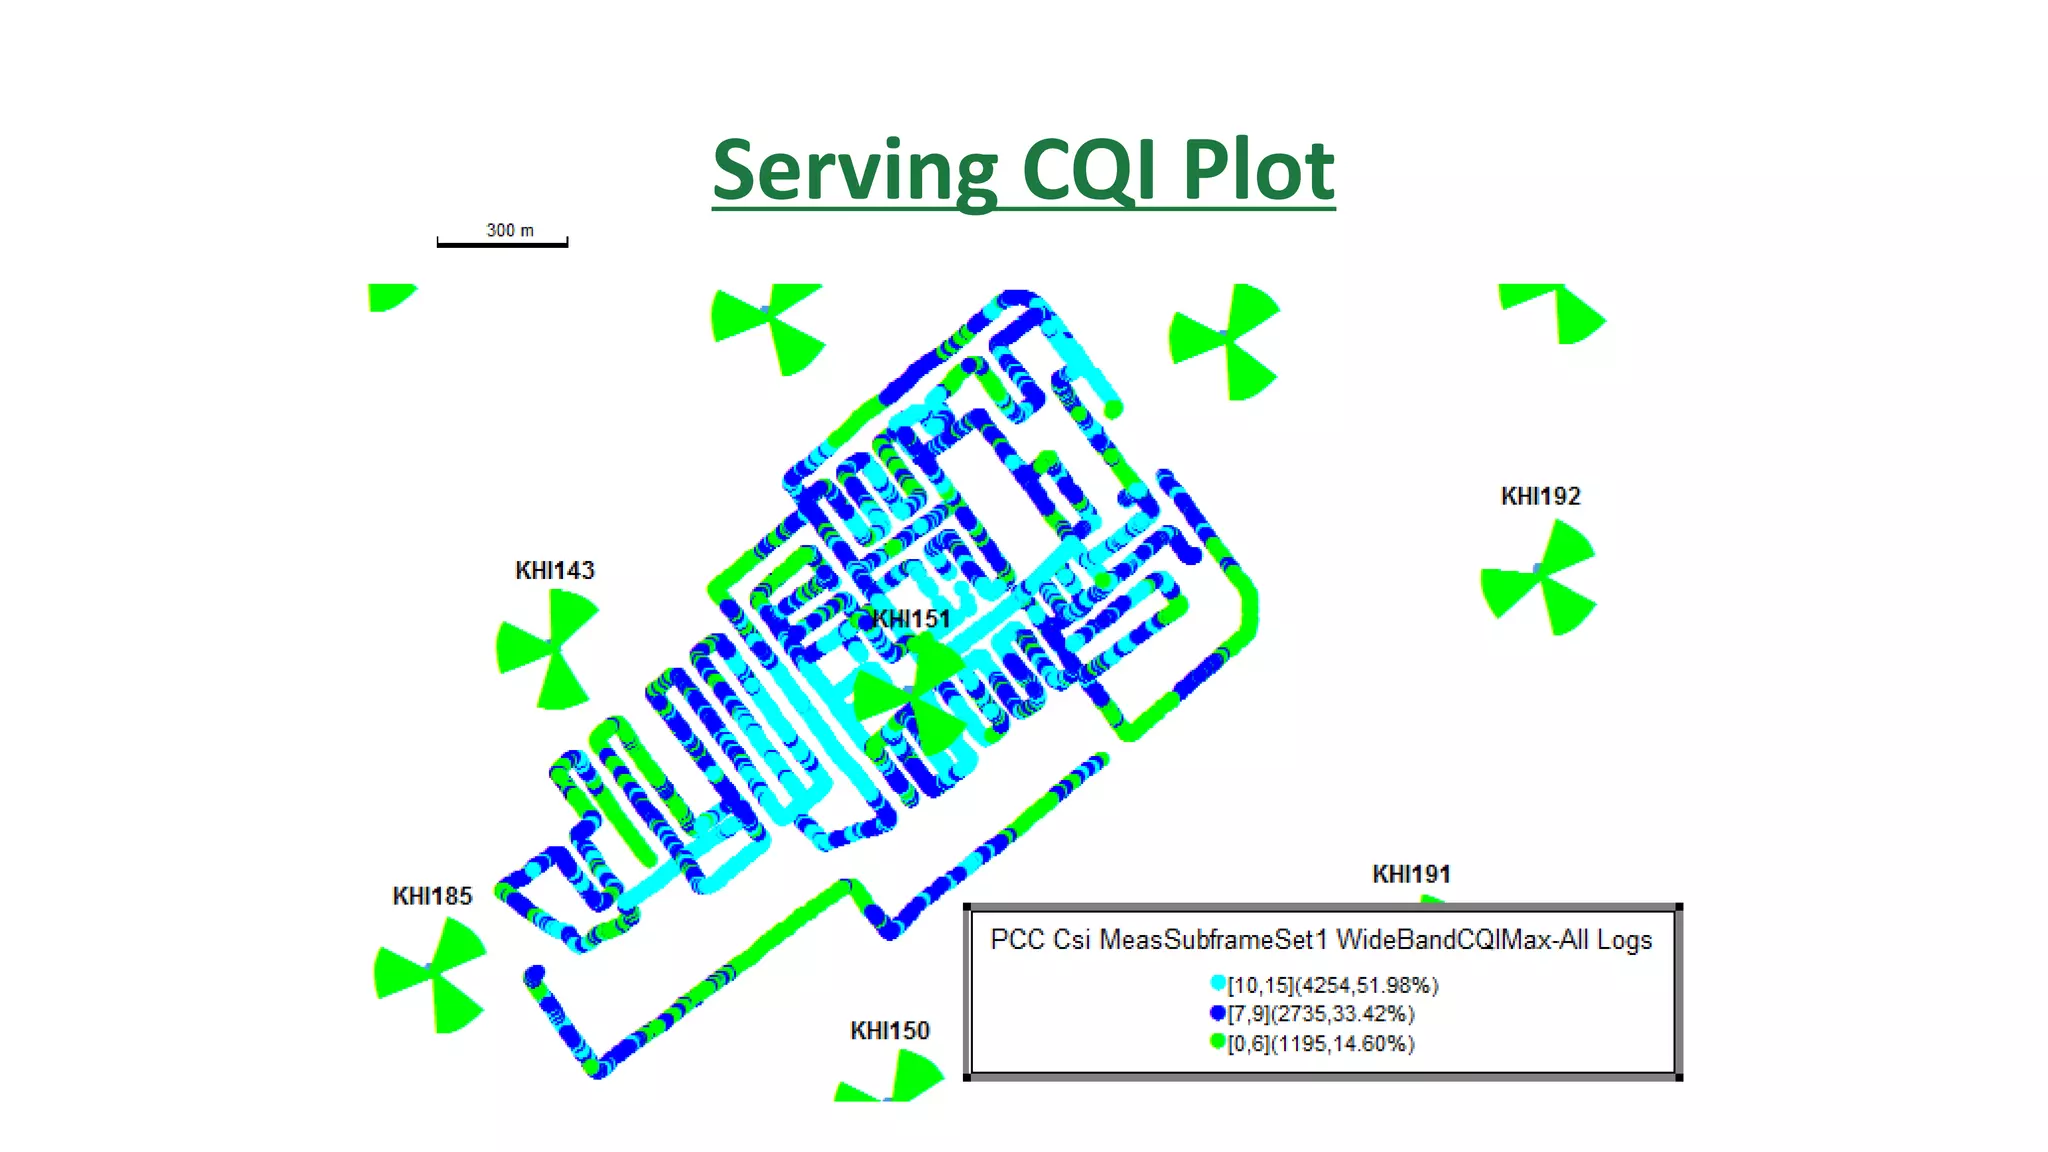
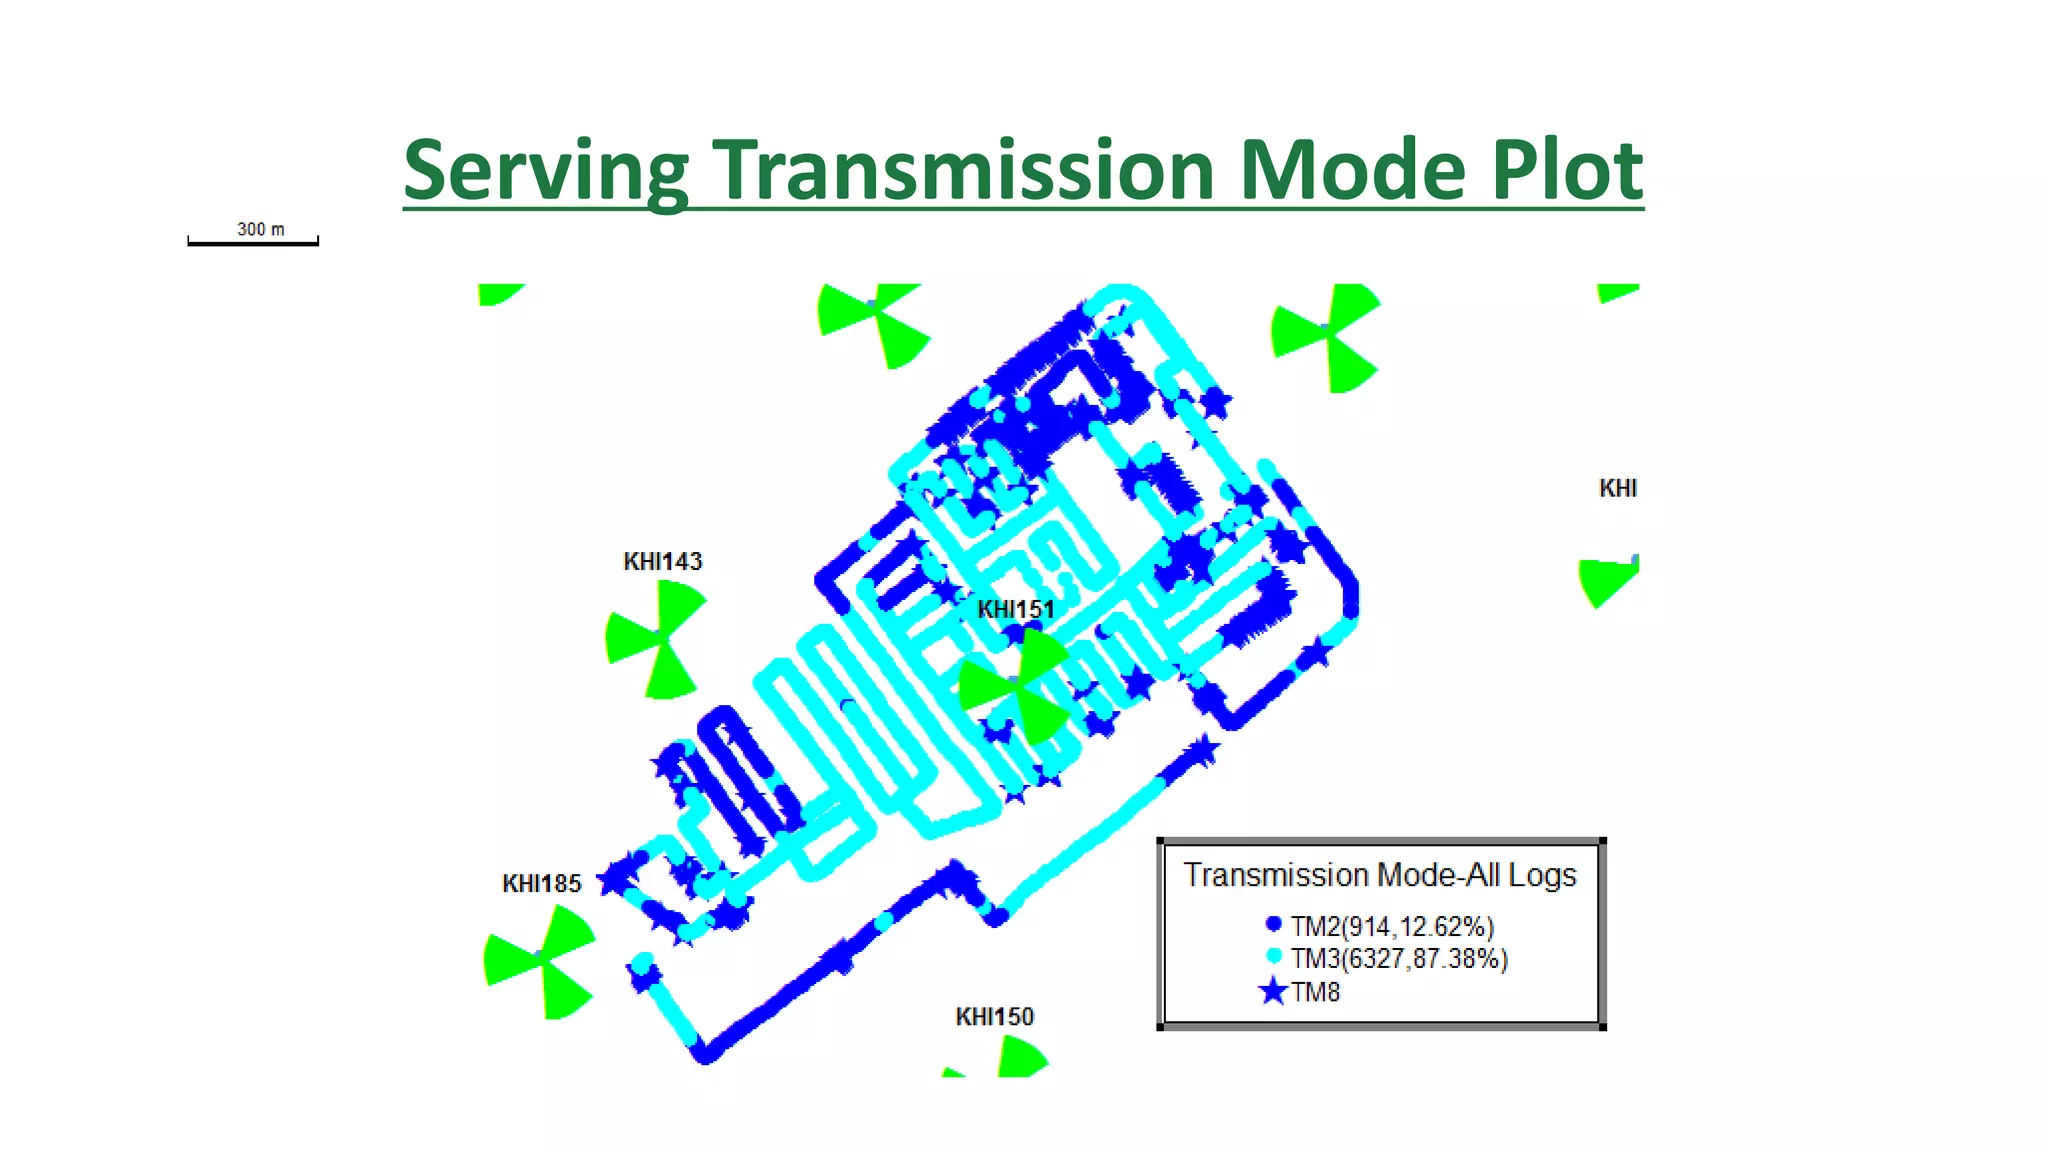
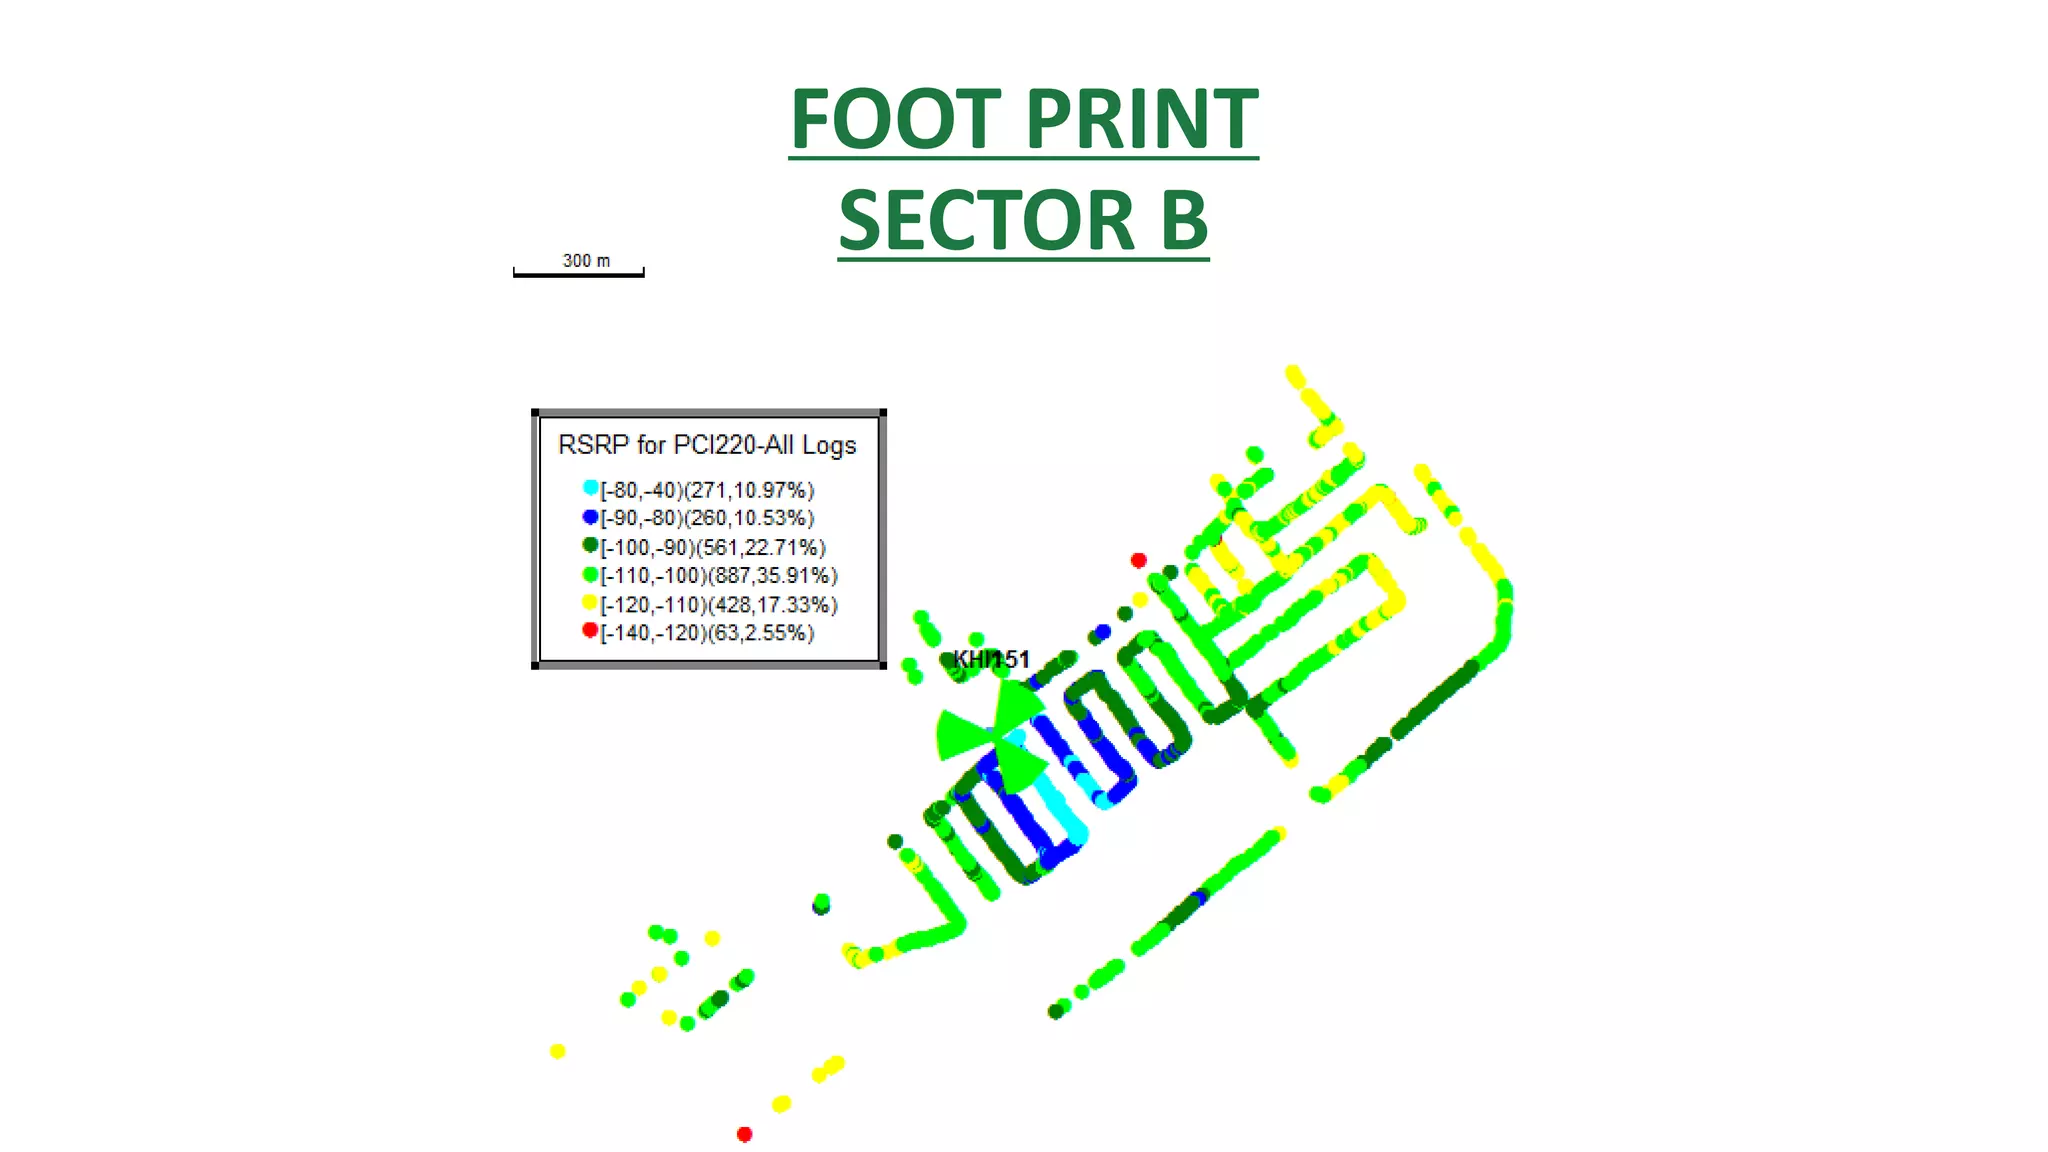
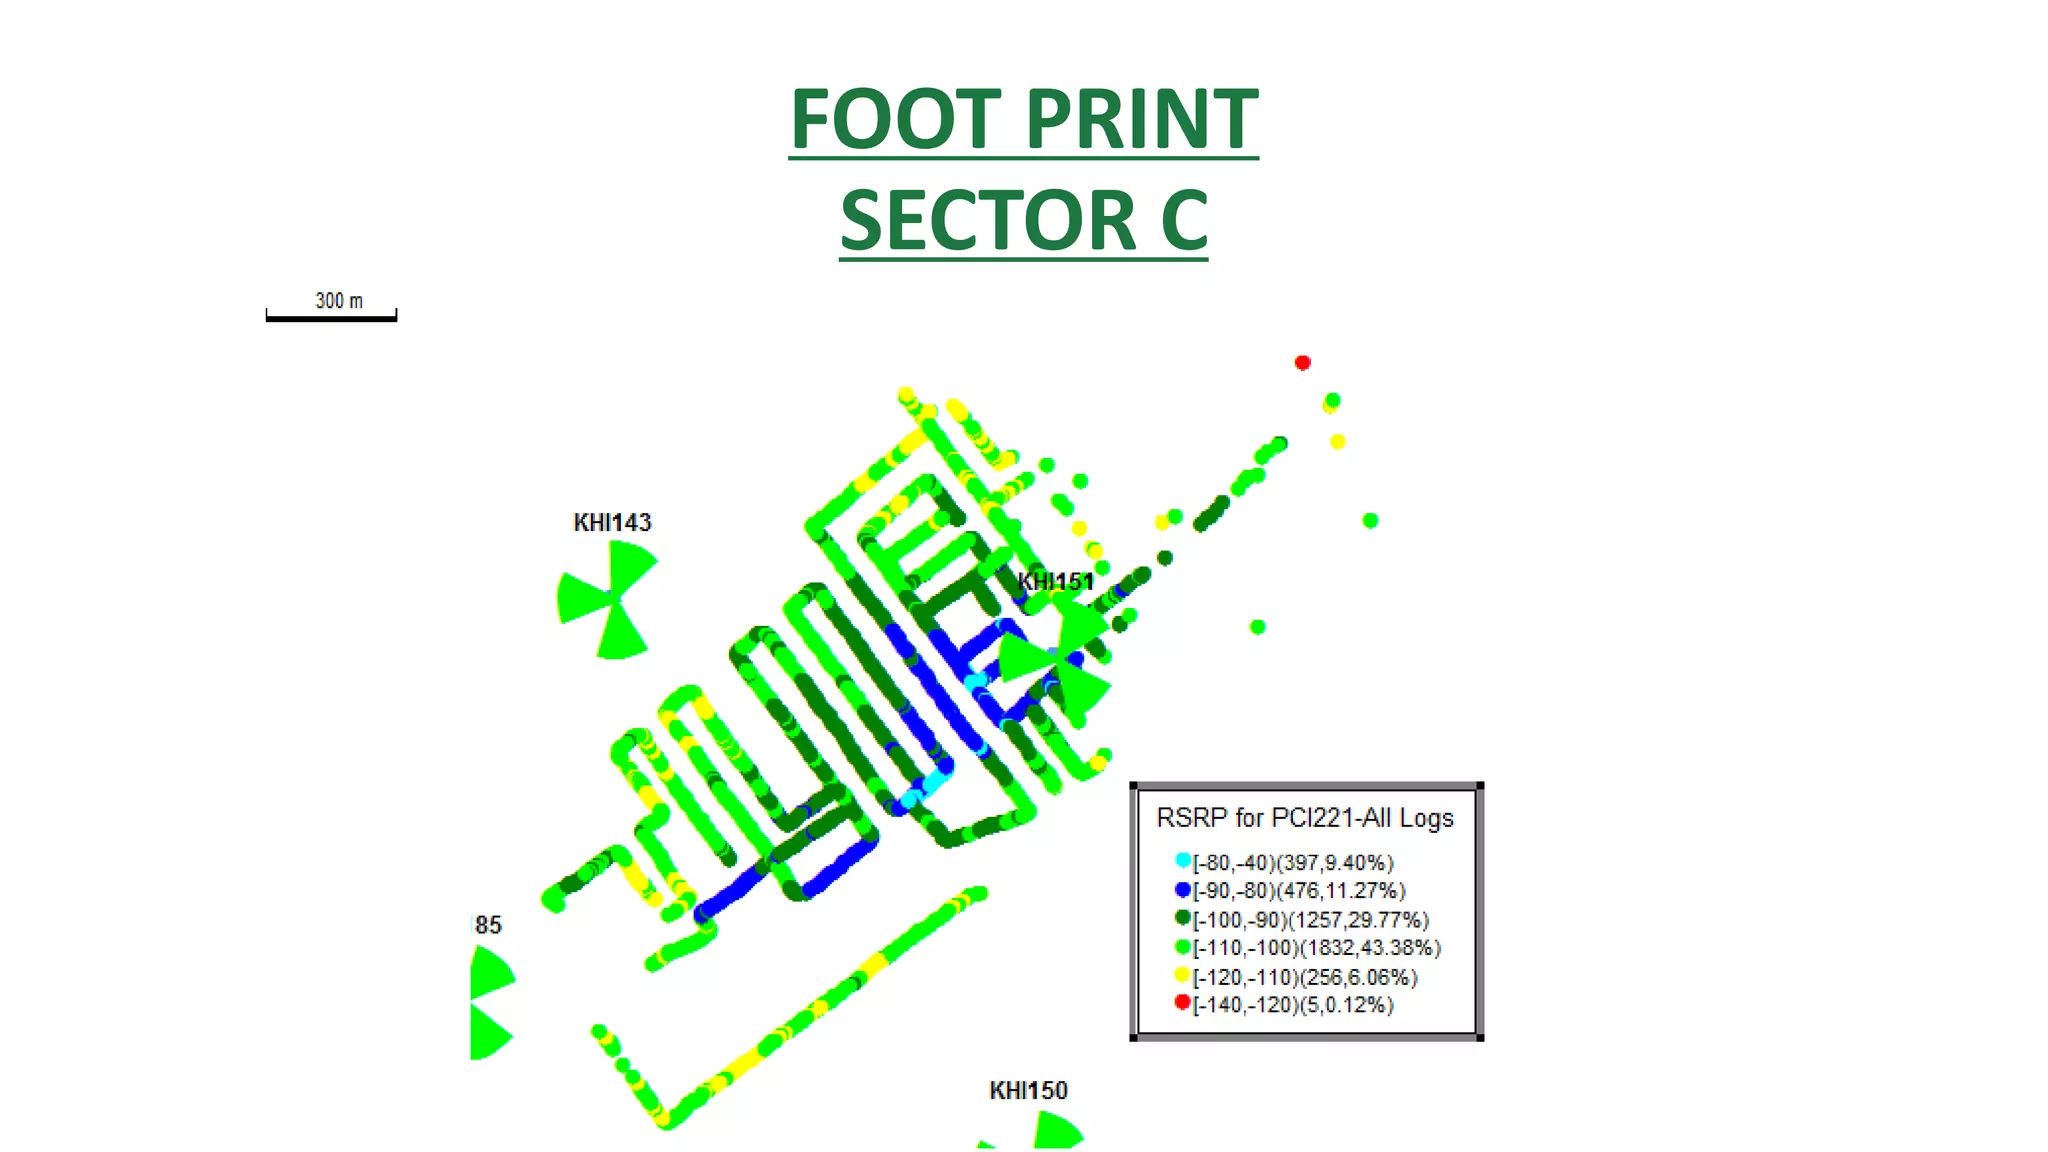
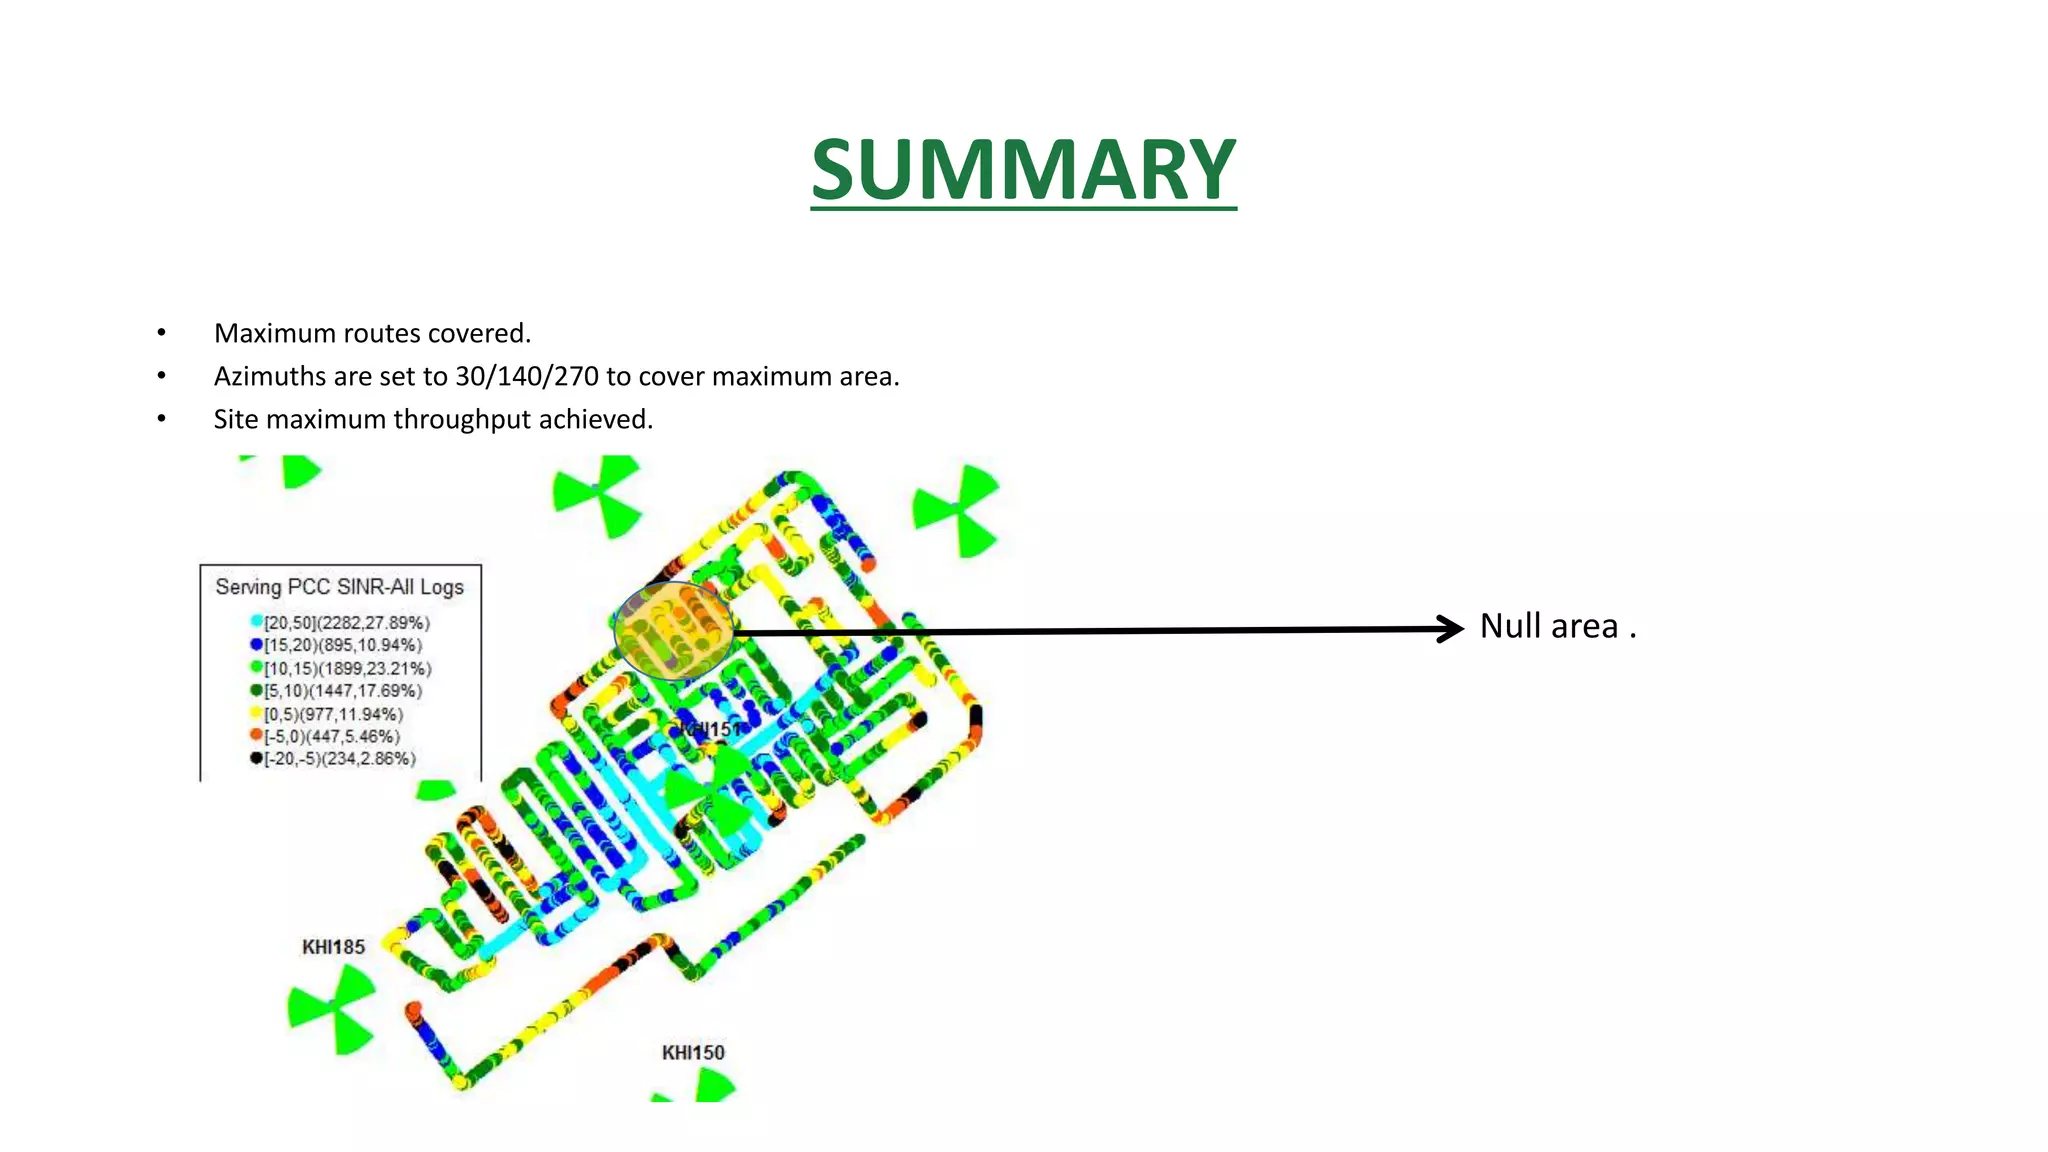
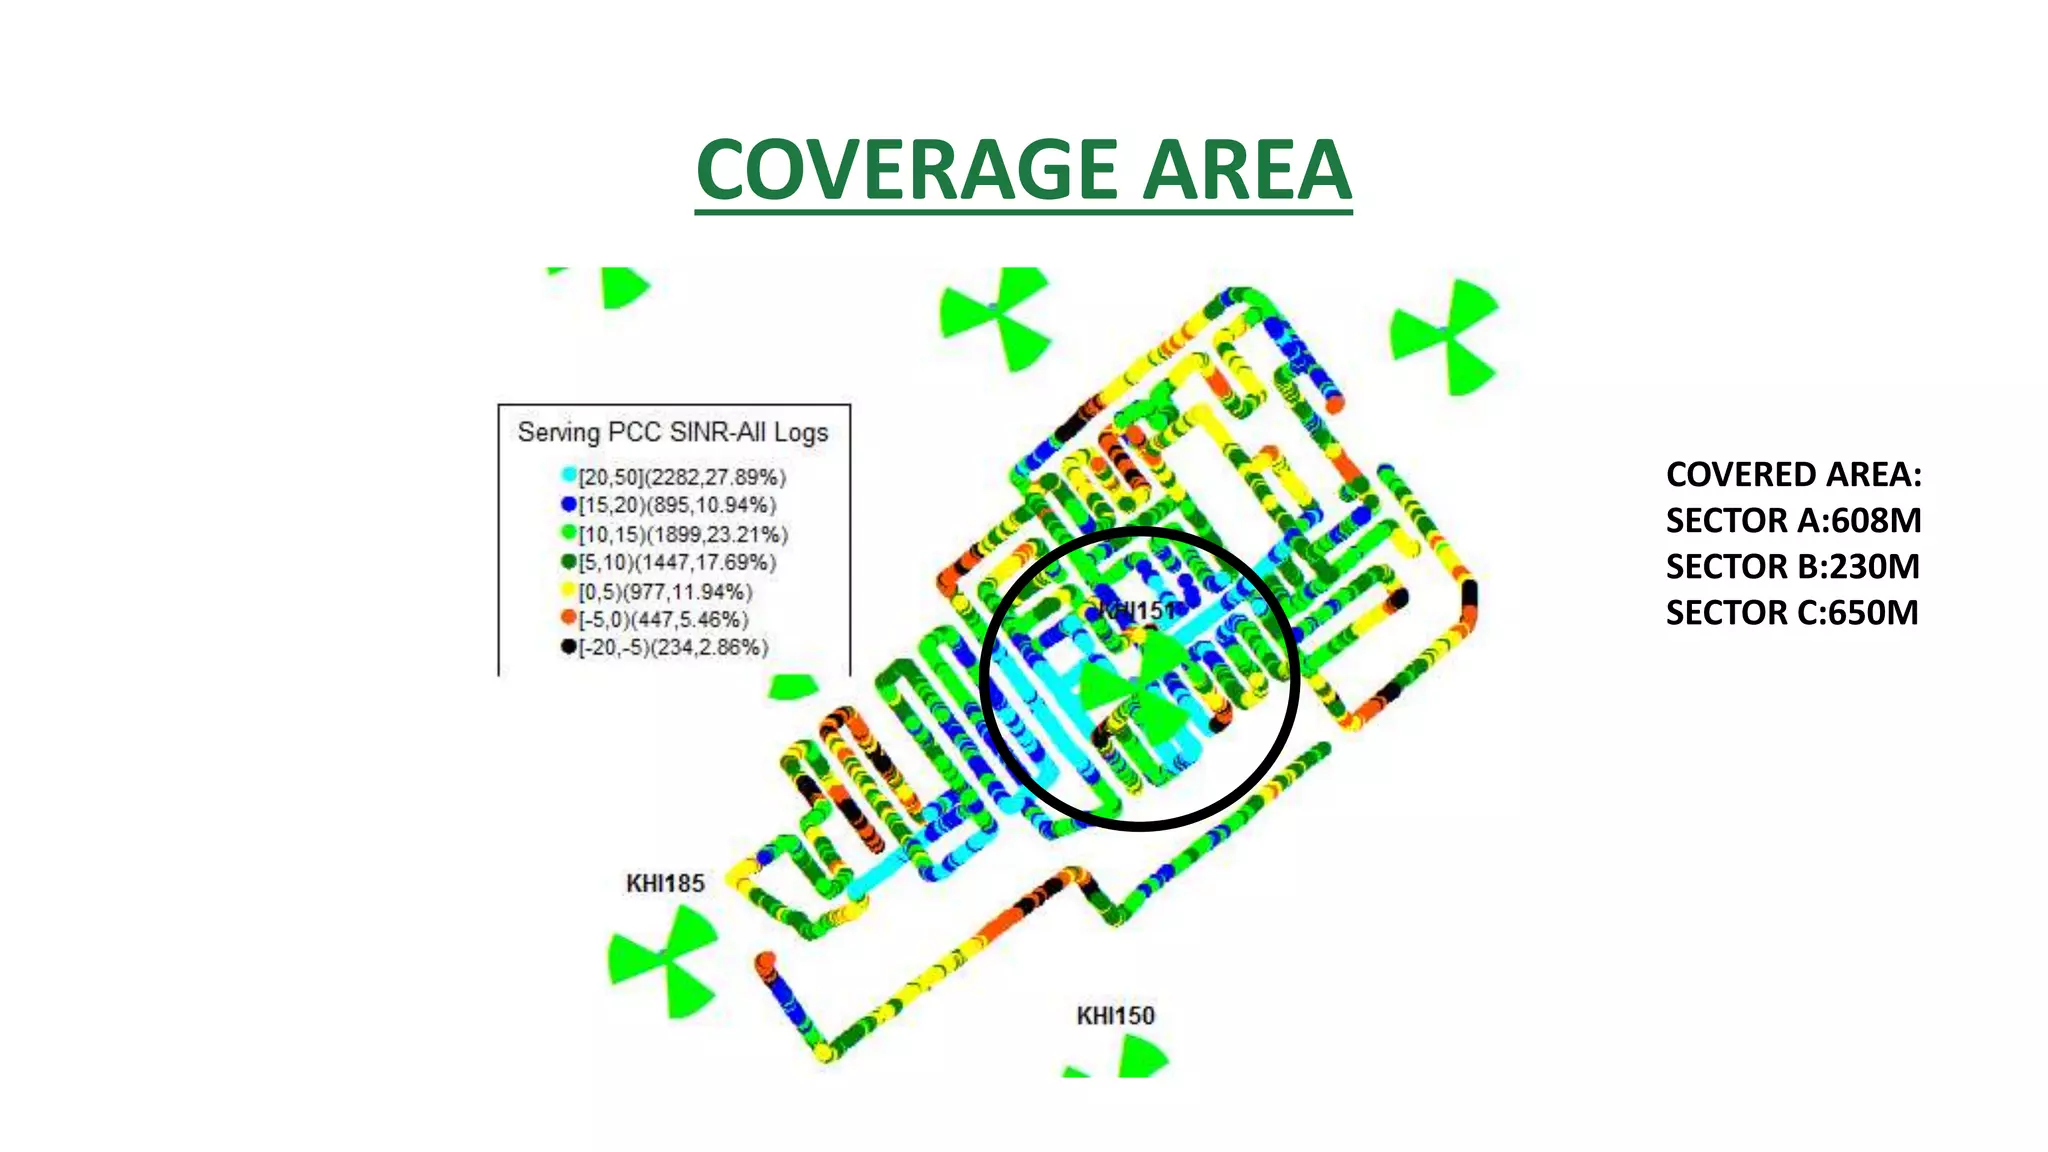
3) Coverage from the three sectors was able to achieve a maximum route with minimal null areas.