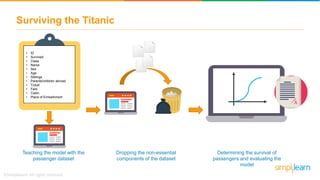
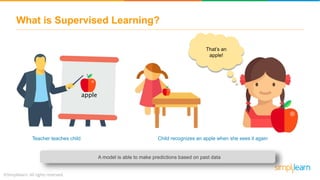
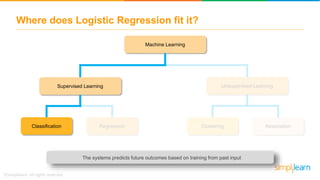
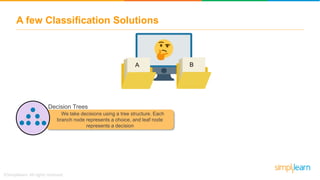
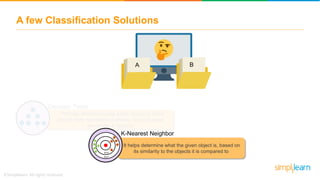
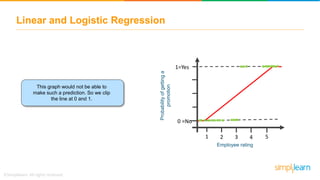
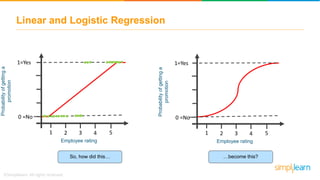
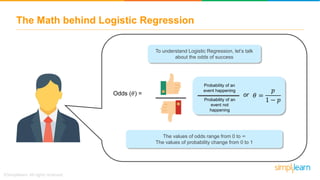
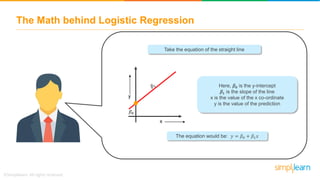
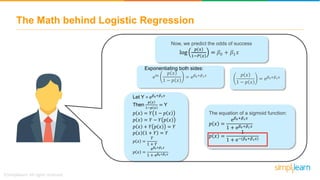
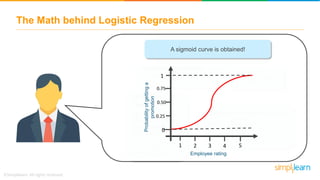
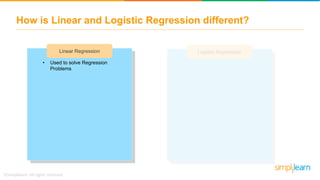
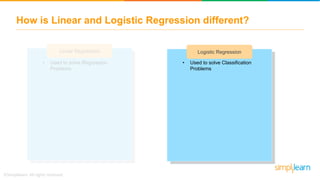
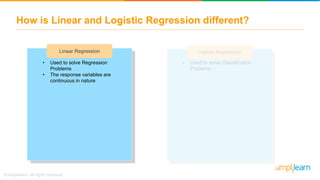
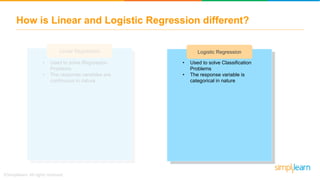
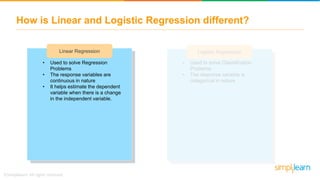
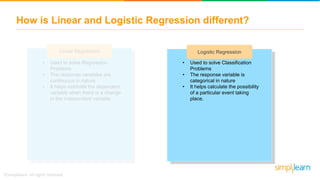
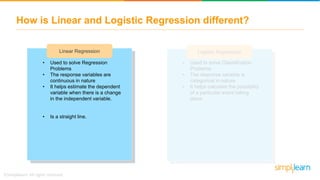
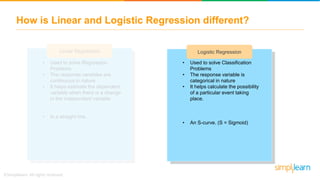
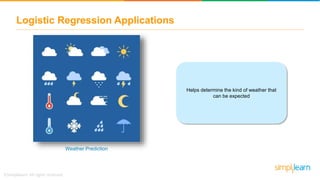
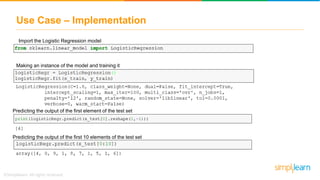
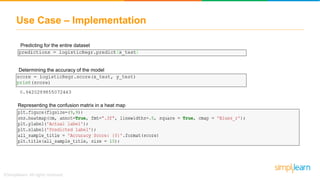
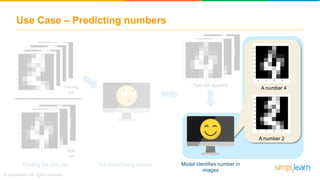
This Logistic Regression Presentation will help you understand how a Logistic Regression algorithm works in Machine Learning. In this tutorial video, you will learn what is Supervised Learning, what is Classification problem and some associated algorithms, what is Logistic Regression, how it works with simple examples, the maths behind Logistic Regression, how it is different from Linear Regression and Logistic Regression applications. At the end, you will also see an interesting demo in Python on how to predict the number present in an image using Logistic Regression.
Below topics are covered in this Machine Learning Algorithms Presentation:
1. What is supervised learning?
2. What is classification? what are some of its solutions?
3. What is logistic regression?
4. Comparing linear and logistic regression
5. Logistic regression applications
6. Use case - Predicting the number in an image
What is Machine Learning: Machine Learning is an application of Artificial Intelligence (AI) that provides systems the ability to automatically learn and improve from experience without being explicitly programmed.
- - - - - - - -
About Simplilearn Machine Learning course:
A form of artificial intelligence, Machine Learning is revolutionizing the world of computing as well as all peopleβs digital interactions. Machine Learning powers such innovative automated technologies as recommendation engines, facial recognition, fraud protection and even self-driving cars.This Machine Learning course prepares engineers, data scientists and other professionals with knowledge and hands-on skills required for certification and job competency in Machine Learning.
- - - - - - -
Why learn Machine Learning?
Machine Learning is taking over the world- and with that, there is a growing need among companies for professionals to know the ins and outs of Machine Learning
The Machine Learning market size is expected to grow from USD 1.03 Billion in 2016 to USD 8.81 Billion by 2022, at a Compound Annual Growth Rate (CAGR) of 44.1% during the forecast period.
- - - - - -
What skills will you learn from this Machine Learning course?
By the end of this Machine Learning course, you will be able to:
1. Master the concepts of supervised, unsupervised and reinforcement learning concepts and modeling.
2. Gain practical mastery over principles, algorithms, and applications of Machine Learning through a hands-on approach which includes working on 28 projects and one capstone project.
3. Acquire thorough knowledge of the mathematical and heuristic aspects of Machine Learning.
4. Understand the concepts and operation of support vector machines, kernel SVM, naive bayes, decision tree classifier, random forest classifier, logistic regression, K-nearest neighbors, K-means clustering and more.
5. Be able to model a wide variety of robust Machine Learning algorithms including deep learning, clustering, and recommendation systems
- - - - - - -
4. Surviving the Titanic
β’ ID
β’ Survived
β’ Class
β’ Name
β’ Sex
β’ Age
β’ Siblings
β’ Parents/children abroad
β’ Ticket
β’ Fare
β’ Cabin
β’ Place of Embarkment
Teaching the model with the
passenger dataset
Dropping the non-essential
components of the dataset
Determining the survival of
passengers and evaluating the
model
5. Agenda
What is Supervised Learning?
What is Classification? What are some of its solutions?
What is Logistic Regression?
Comparing Linear and Logistic Regression
Logistic Regression applications
Use Case β Predicting the number in an image
7. What is Supervised Learning?
Thatβs an
apple!
apple
Teacher teaches child Child recognizes an apple when she sees it again
A model is able to make predictions based on past data
8. Where does Logistic Regression fit it?
Machine Learning
Supervised Learning Unsupervised Learning
AssociationClusteringClassification Regression
The systems predicts future outcomes based on training from past input
10. A few Classification Solutions
A B
We take decisions using a tree structure. Each
branch node represents a choice, and leaf node
represents a decision
Decision Trees
11. A few Classification Solutions
A B
Decision Trees
We take decisions using a tree structure. Each
branch node represents a choice, and leaf node
represents a decision
It helps determine what the given object is, based on
its similarity to the objects it is compared toK=3
K=7
K-Nearest Neighbor
12. It helps determine what the given object is, based on
its similarity to the objects it is compared toK=3
K=7
K-Nearest Neighbor
Decision Trees
A few Classification Solutions
A B
We determine the probability of an event occurring
with the help of a tree structure
A dataset with one or more independent variables is
used to determine binary output of the dependent
variable
Logistic Regression
14. What is Logistic Regression?
Imagine itβs been a few years since
you serviced your car.
One day you wonderβ¦
15. What is Logistic Regression?
It is a classification algorithm, used to predict binary outcomes for a given set of independent
variables. The dependent variableβs outcome is discrete.
Regression model created based on other
usersβ experience
0.60
0.20
0.40
0.80
1.00
1 2 3 4 5 6
Years since service
Probabilityofbreakdown
How long until the
car breaks down?
You provide years since
last service
16. What is Logistic Regression?
Probability>0.50
Value rounded off to
1 : The car will
breakdown
Probability<0.50
Value rounded off to 0:
The car will not
breakdown
Here, the threshold
value 0.50 indicates
that the car is more
likely to breakdown
after 3.5 years of
usage
Model makes predictions
0.60
0.20
0.40
0.80
1.00
1 2 3 4 5 6
Years since last service
Probabilityofbreakdown
0.50
0.29
0.90
Threshold Value
18. Linear Regression
It is a statistical method that helps find the relationship between an independent and dependent variable,
both of which are continuous
He performed
well in the last
quarter. How
much raise
should he get?
19. Linear Regression
41 2 3 5
5
10
15
20
25
Employee rating
Salaryhike
Collection of ratings and corresponding
hikes Linear Regression is performed on data
The management provides the
corresponding salary hike
Employee rating
20. Linear and Logistic Regression
Hereβs the graph of how linear
regression would be, for a given
scenario
x
y
21. Linear and Logistic Regression
What if you wanted to know whether the
employee would get a promotion or not
based on their rating
41 2 3 5
0 =No
1=Yes
Employee rating
Probabilityofgettinga
promotion
22. Linear and Logistic Regression
This graph would not be able to
make such a prediction. So we clip
the line at 0 and 1.
41 2 3 5
Employee rating
0 =No
1=Yes
Probabilityofgettinga
promotion
23. Linear and Logistic Regression
So, how did thisβ¦ β¦become this?
41 2 3 5
Employee rating
41 2 3 5
Employee rating
0 =No
1=Yes
Probabilityofgettinga
promotion
0 =No
1=Yes
Probabilityofgettinga
promotion
24. The Math behind Logistic Regression
To understand Logistic Regression, letβs talk
about the odds of success
Odds (π) =
Probability of an
event happening
Probability of an
event not
happening
or π =
π
1 β π
The values of odds range from 0 to β
The values of probability change from 0 to 1
25. The Math behind Logistic Regression
Type equation here.
Take the equation of the straight line
π½0
x
y
Here, π½0 is the y-intercept
π½1 is the slope of the line
x is the value of the x co-ordinate
y is the value of the prediction
The equation would be: π¦ = π½0 + π½1 π₯
26. The Math behind Logistic Regression
Type equation here.
Now, we predict the odds of success
eππ
π π₯
1 β π π₯
= e π½0+π½1 π₯
log
π π₯
1βπ π₯
= π½0 + π½1 π₯
Exponentiating both sides:
π π₯
1 β π π₯
= e π½0+π½1 π₯
Let Y = e π½0+π½1 π₯
Then
π π₯
1βπ π₯
= Y
π π₯ = π 1 β π π₯
π π₯ = π β π π π₯
π π₯ + π π π₯ = π
π π₯ 1 + π = π
π π₯ =
π
1 + π
π π₯ =
e π½0+π½1 π₯
1 + e π½0+π½1 π₯
The equation of a sigmoid function:
π π₯ =
e π½0+π½1 π₯
1 + e π½0+π½1 π₯
π π₯ =
1
1 + eβ(π½0+π½1 π₯)
27. The Math behind Logistic Regression
Type equation here.
Now, we predict the odds of success
eππ
π π₯
1 β π π₯
= e π½0+π½1 π₯
log
π π₯
1βπ π₯
= π½0 + π½1 π₯
Exponentiating both sides:
π π₯
1 β π π₯
= e π½0+π½1 π₯
Let Y = e π½0+π½1 π₯
Then
π π₯
1βπ π₯
= Y
π π₯ = π 1 β π π₯
π π₯ = π β π π π₯
π π₯ + π π π₯ = π
π π₯ 1 + π = π
π π₯ =
π
1 + π
π π₯ =
e π½0+π½1 π₯
1 + e π½0+π½1 π₯
The equation of a sigmoid function:
π π₯ =
e π½0+π½1 π₯
1 + e π½0+π½1 π₯
π π₯ =
1
1 + eβ(π½0+π½1 π₯)
41 2 3 5
0
0.25
0.50
0.75
1
Employee rating
Probabilityofgettinga
promotion
A sigmoid curve is obtained!
29. How is Linear and Logistic Regression different?
Linear Regression Logistic Regression
β’ Used to solve Regression
Problems
30. How is Linear and Logistic Regression different?
Linear Regression Logistic Regression
β’ Used to solve Classification
Problems
β’ Used to solve Regression
Problems
31. How is Linear and Logistic Regression different?
Linear Regression Logistic Regression
β’ Used to solve Classification
Problems
β’ Used to solve Regression
Problems
β’ The response variables are
continuous in nature
32. How is Linear and Logistic Regression different?
Linear Regression Logistic Regression
β’ Used to solve Classification
Problems
β’ The response variable is
categorical in nature
β’ Used to solve Regression
Problems
β’ The response variables are
continuous in nature
33. How is Linear and Logistic Regression different?
Linear Regression Logistic Regression
β’ Used to solve Classification
Problems
β’ The response variable is
categorical in nature
β’ Used to solve Regression
Problems
β’ The response variables are
continuous in nature
β’ It helps estimate the dependent
variable when there is a change
in the independent variable.
34. How is Linear and Logistic Regression different?
Linear Regression Logistic Regression
β’ Used to solve Classification
Problems
β’ The response variable is
categorical in nature
β’ It helps calculate the possibility
of a particular event taking
place.
β’ Used to solve Regression
Problems
β’ The response variables are
continuous in nature
β’ It helps estimate the dependent
variable when there is a change
in the independent variable.
35. How is Linear and Logistic Regression different?
Linear Regression Logistic Regression
β’ Used to solve Classification
Problems
β’ The response variable is
categorical in nature
β’ It helps calculate the possibility
of a particular event taking
place.
β’ Used to solve Regression
Problems
β’ The response variables are
continuous in nature
β’ It helps estimate the dependent
variable when there is a change
in the independent variable.
β’ Is a straight line.
36. How is Linear and Logistic Regression different?
Linear Regression Logistic Regression
β’ Used to solve Classification
Problems
β’ The response variable is
categorical in nature
β’ It helps calculate the possibility
of a particular event taking
place.
β’ An S-curve. (S = Sigmoid)
β’ Used to solve Regression
Problems
β’ The response variables are
continuous in nature
β’ It helps estimate the dependent
variable when there is a change
in the independent variable.
β’ Is a straight line.
38. Identifies the different components
that are present in the image, and
helps categorize them
Logistic Regression Applications
Humans Animals Vehicles
Image Categorization
39. Determines the possibility of patient
survival, taking age, ISS and RTS into
consideration
Logistic Regression Applications
Healthcare (TRISS)
Patient survival %
Revised
Trauma Score
Injury Severity
Score
Age
41. Use Case β Predicting numbers
Can you guess
what number I am? Are you a 3? 4?
I donβt know!
8x8 image
42. Use Case β Predicting numbers
Dividing the data set
Training
set
Test set
The model being trained
Model identifies number in
images
Test set applied
A number 4
A number 1
43. Use Case β Implementation
Importing libraries and their associated methods
Determining the total number of images and labels
44. Use Case β Implementation
Displaying some of the images and labels
45. Use Case β Implementation
Dividing dataset into Training and Test set
46. Use Case β Implementation
Import the Logistic Regression model
Making an instance of the model and training it
Predicting the output of the first element of the test set
Predicting the output of the first 10 elements of the test set
47. Use Case β Implementation
Predicting for the entire dataset
Determining the accuracy of the model
Representing the confusion matrix in a heat map
48. Use Case β Implementation
Accurately predicting the image to
contain a zero
Inaccurately predicting the image to
contain a seven
49. Use Case β Implementation
Presenting predictions and actual output
50. Use Case β Predicting numbers
Dividing the data set
Training
set
Test
set
The model being trained Model identifies number in
images
Test set applied
A number 4
A number 2