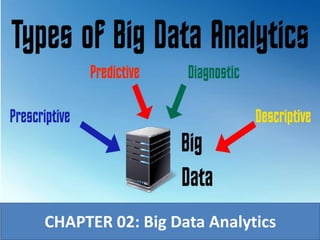
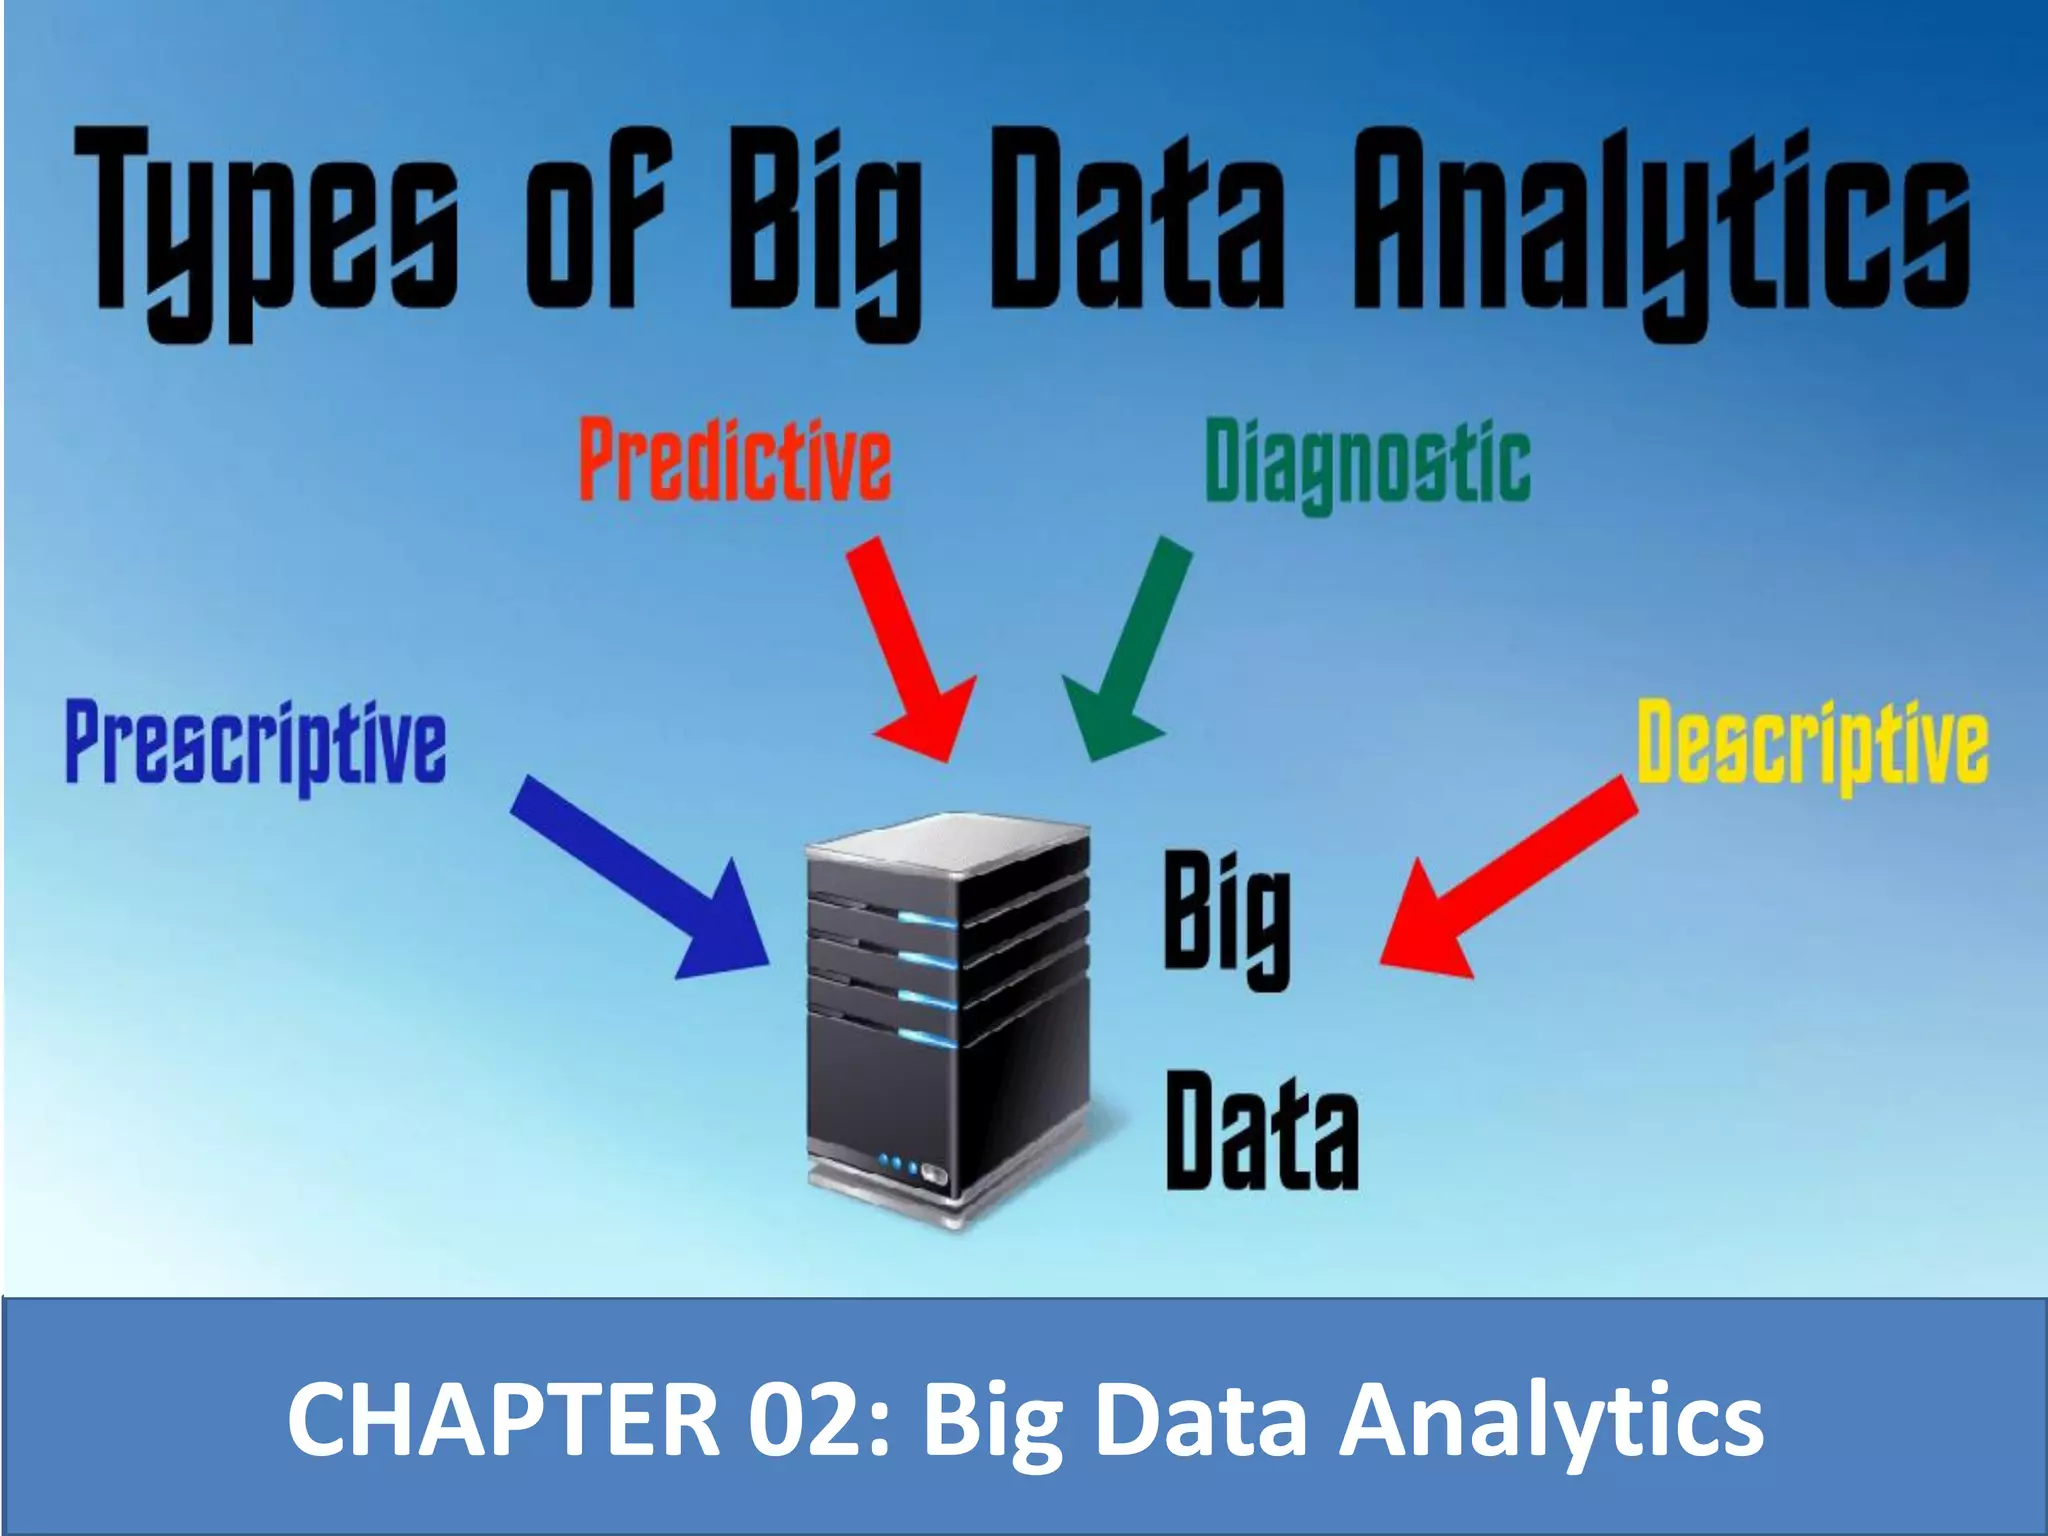
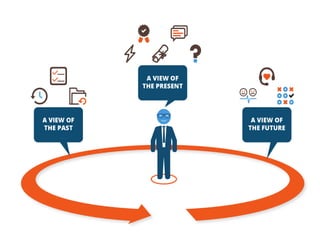
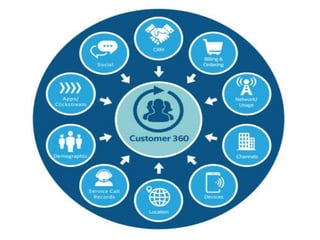
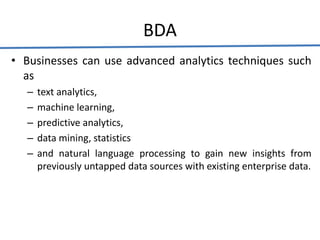
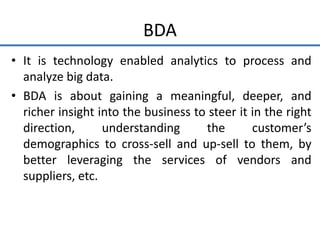
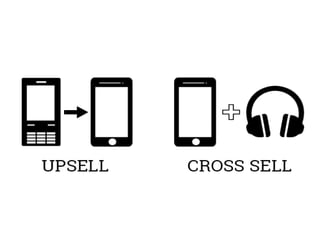
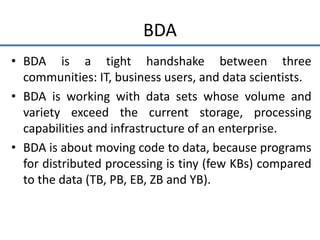
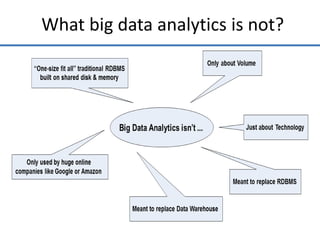
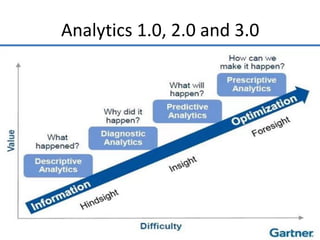
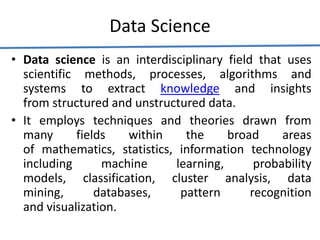
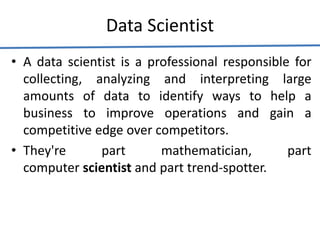
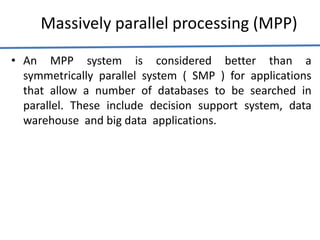
Big data analytics (BDA) involves examining large, diverse datasets to uncover hidden patterns, correlations, trends, and insights. BDA helps organizations gain a competitive advantage by extracting insights from data to make faster, more informed decisions. It supports a 360-degree view of customers by analyzing both structured and unstructured data sources like clickstream data. Businesses can leverage techniques like machine learning, predictive analytics, and natural language processing on existing and new data sources. BDA requires close collaboration between IT, business users, and data scientists to process and analyze large datasets beyond typical storage and processing capabilities.
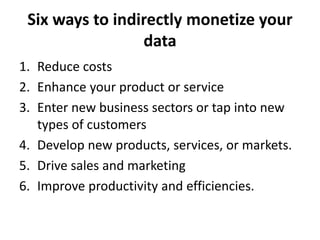
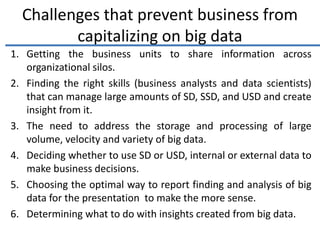
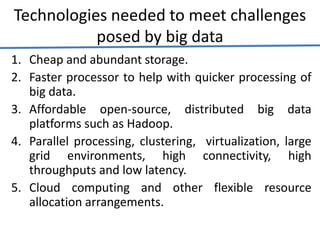
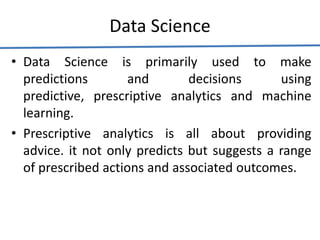
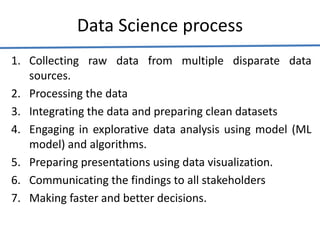
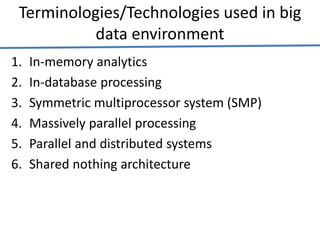
![Importance of BDA
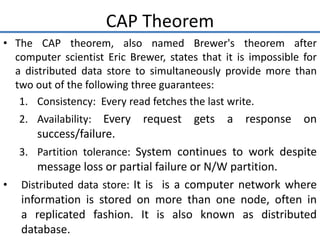
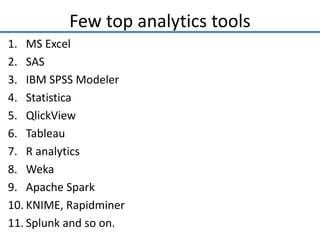
• Cost reduction: Cost-effective storage system for
huge data sets. [Hadoop and cloud based
analytics]
• Faster, better decision making: Provides ways to
analyze information quickly and make decisions.
• [Hadoop processing speed and in-memory
analytics, combined with the ability to analyze new
sources of data]](https://image.slidesharecdn.com/chapter2-211114070723/85/Big-data-Analytics-31-320.jpg)


![7.__Developing_a_Research_Proposal[1].pptx](https://cdn.slidesharecdn.com/ss_thumbnails/7-260131073037-df92dd7d-thumbnail.jpg?width=640&height=640&fit=bounds)


![제 23회 보아즈(BOAZ) 빅데이터 컨퍼런스 - [MBOAX] : ABSA를 활용한 소비자 반응 분석 기반 운영 효율화 대시보드 설계](https://cdn.slidesharecdn.com/ss_thumbnails/3-1boaz23rdconferencemboax-260203102709-9d519923-thumbnail.jpg?width=640&height=640&fit=bounds)


