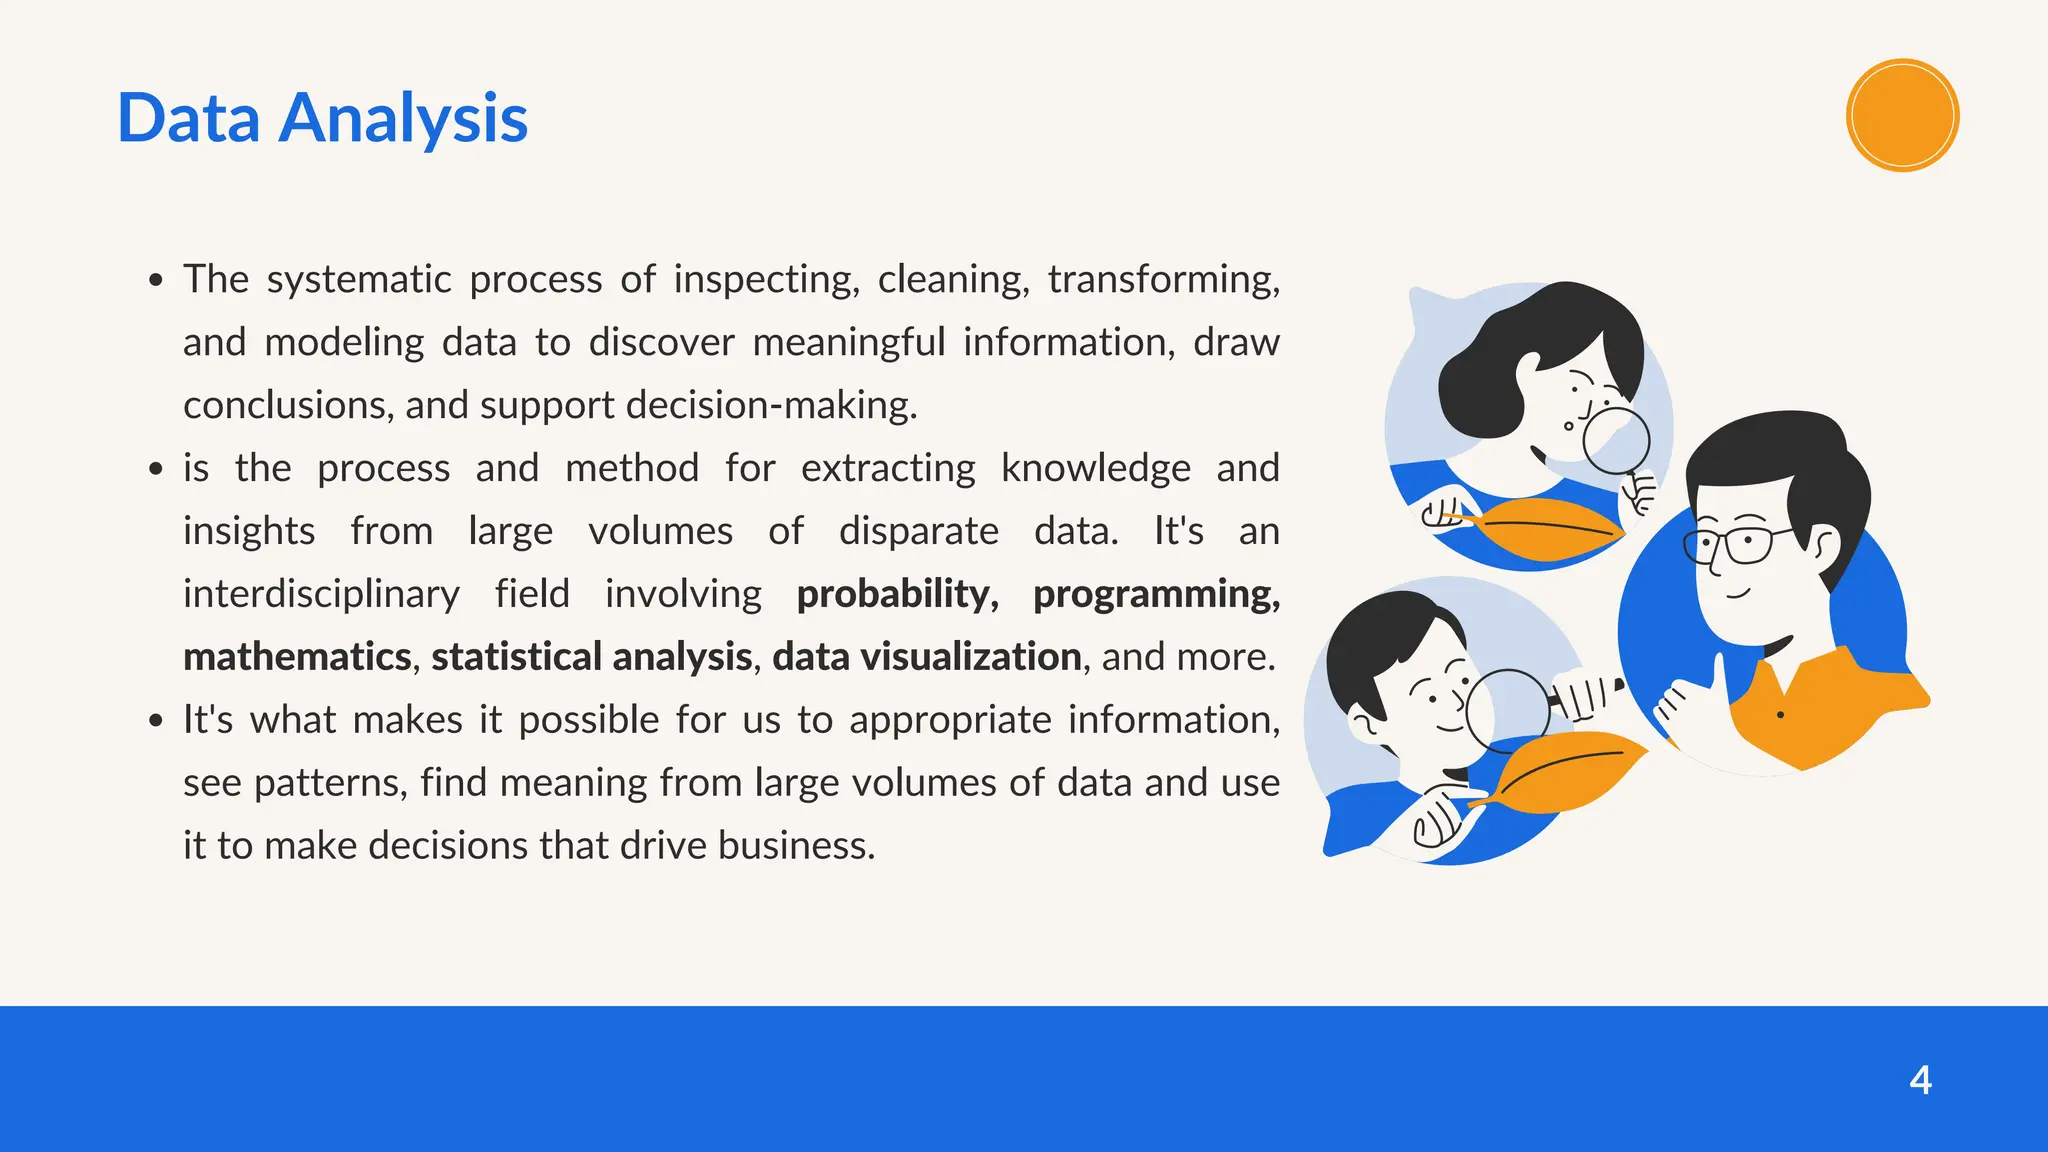
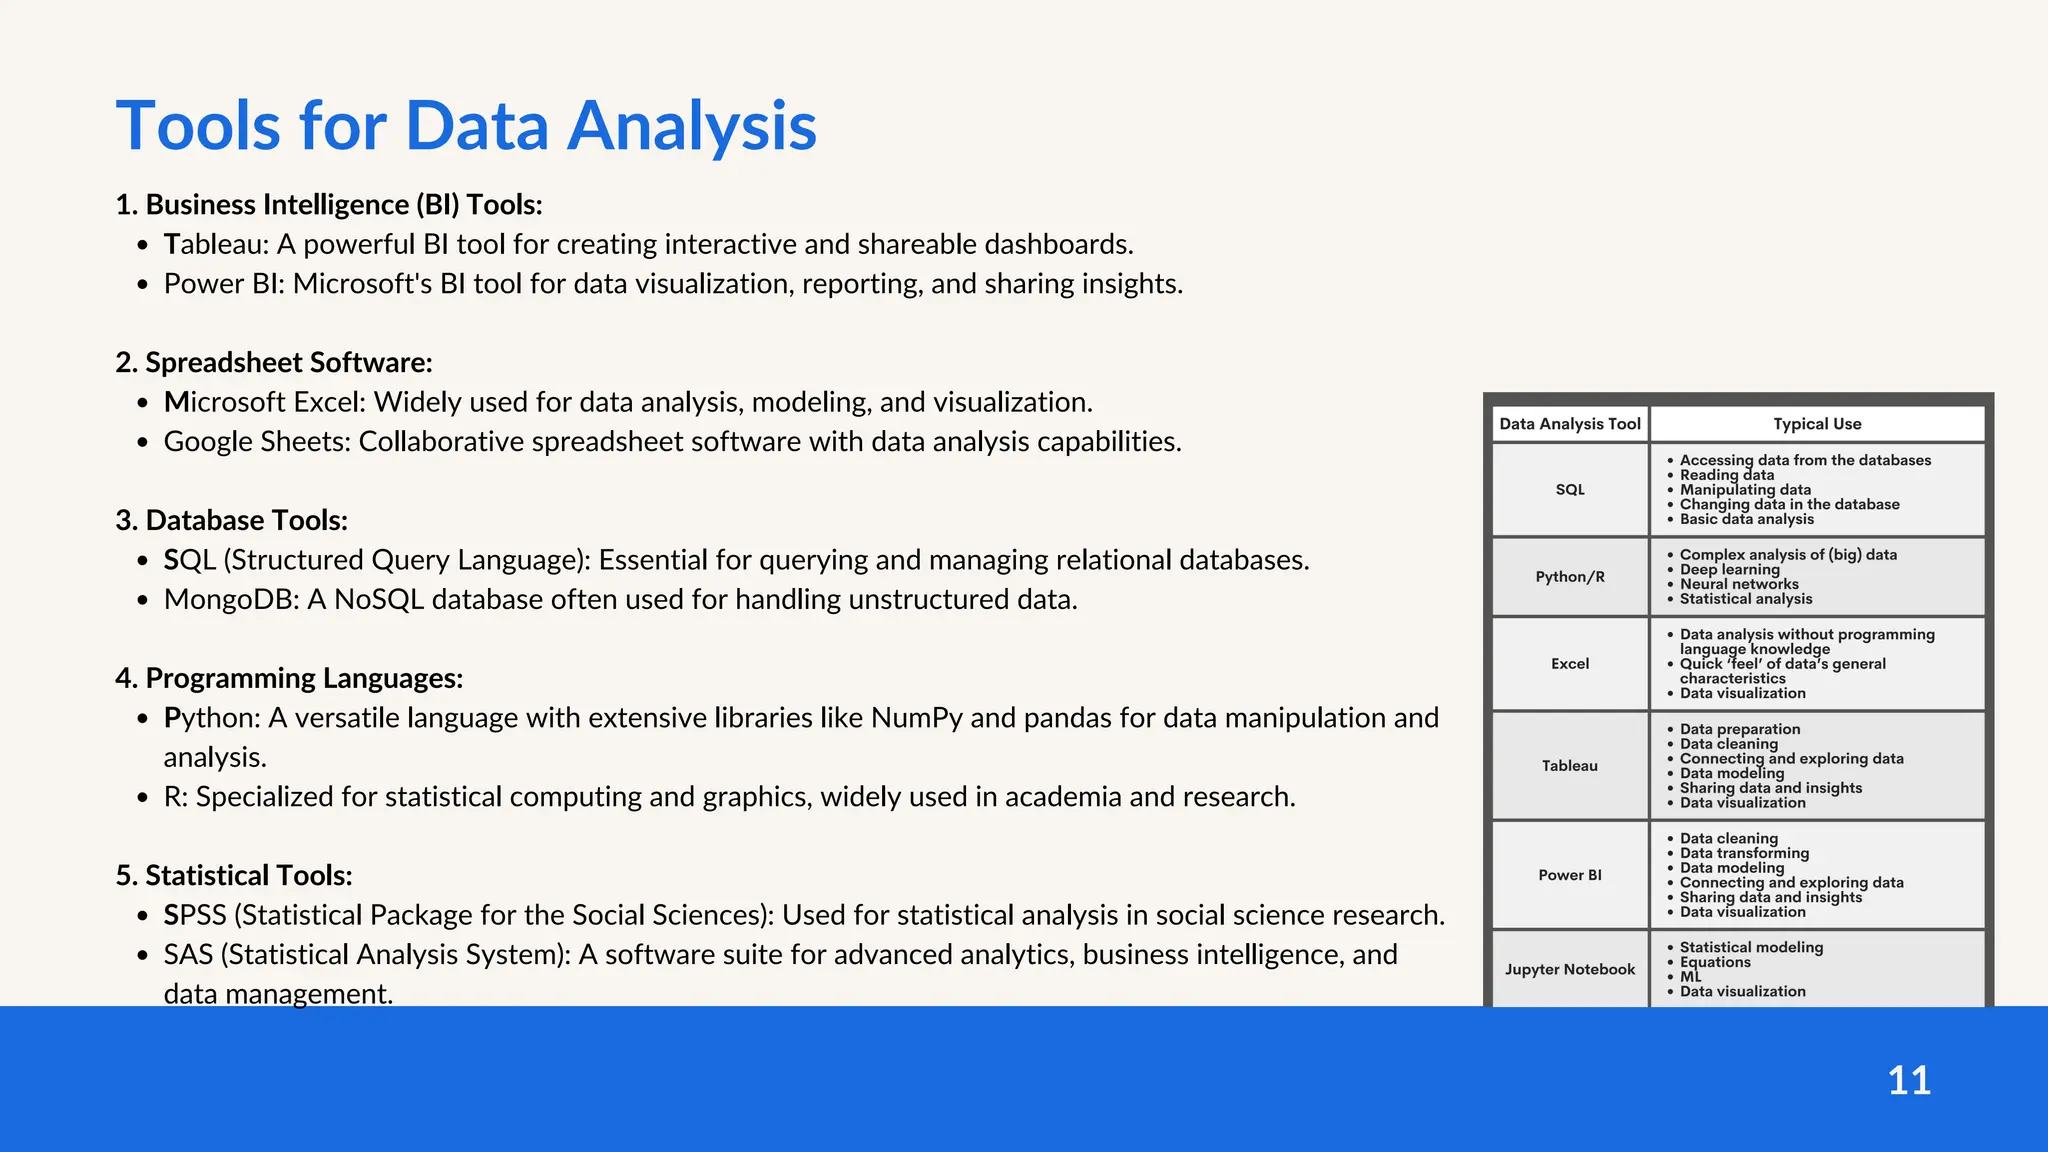
Introduction to Data
Analysis
Course Notes
02-Feb-2024
by: Grace Jidael
Contents
What is Data and Data Analysis
Types of Data
Types of Data Analysis
Life Cycle of Data Analysis Project
Tools for Data Analysis
2
3
7
8
10
11
Data
3
Data:
Data is Raw facts and figures that need to be processed to
extract meaningful information.
The term big data refers to data sets that are so massive, so
quickly built, and so varied that they defy traditional analysis
methods such as you might perform with a relational database.
Big data is often described in terms of five V's; velocity,
volume, variety, veracity, and value.
Examples: Numbers, text, images, sound, etc.
Data Analysis
4
The systematic process of inspecting, cleaning, transforming,
and modeling data to discover meaningful information, draw
conclusions, and support decision-making.
is the process and method for extracting knowledge and
insights from large volumes of disparate data. It's an
interdisciplinary field involving probability, programming,
mathematics, statistical analysis, data visualization, and more.
It's what makes it possible for us to appropriate information,
see patterns, find meaning from large volumes of data and use
it to make decisions that drive business.
Good to Know...
5
If you have data, and you have curiosity, and you're manipulating
it, you're exploring it, the very exercise of going through analyzing
data, trying to get some answers from it is data analysis.
Data science/Analysis is relevant today because we have tons of
data available.
We used to worry about lack of data. Now we have a data deluge.
In the past, we didn't have algorithms, now we have algorithms.
In the past, the software was expensive, now it's open source and
free.
In the past, we couldn't store large amounts of data, now for a
fraction of the cost, we can have gazillions of datasets for a
very low cost.
So, the tools to work with data, the very availability of data,
and the ability to store and analyze data, it's all cheap, it's all
available, it's all ubiquitous, it's here.
There's never been a better time to be a data scientist/analyst
Good to Know...
6
If data set has one variable it is Univariate, and if you have multiple variables it is Multivariate
Grace Jidael
Types of Data
7
Structured
Unstructured
Semi Structured
Categorical(Nominal or
Ordinal)
Numeric(Continuous or
Interval)
Cross Sectional
Time-Series
By Structure By Type By Variable Type
Types of Analysis
8
Inferential Analysis:
Inferential analysis are numeric values that
enables an analyst/researcher draw
conclusions about a population based on a
sample of data. It aims to make generalizations
or predictions about a larger group from which
the data was sampled.
It uses Statistical test, either to test for
significant relationships amongst variables or
to find statistical support to hypotheses.
It is based on laws of probability
Descriptive Analysis:
Summarizes and organizes data to understand the
sample’s characteristics.
Descriptive Statistics are numeric values obtained
from the data that gives meaning to the data
collected. They include frequency distribution,
measures of central tendency, measures of
dispersion/variability, bi-variate descriptive
statistics.
It gives the current status of data
Other Types of Analysis
9
Predictive Analysis(Forcasting):
Uses statistical algorithms and machine
learning to make predictions about future
outcomes.
What if these trends continue?
What will happen next?
Exploratory Data Analysis:
Analyzes data sets to uncover patterns,
relationships, or trends.
Diagnostic Analysis:
Focuses on identifying the cause of a particular
problem or issue.
What happened?
Why is it happening?
Prescriptive Analysis:
Recommends actions to optimize or take
advantage of predicted future scenarios.
How do we solve it?
10
Life cycle of data
science project
11
Tools for Data Analysis
1. Business Intelligence (BI) Tools:
Tableau: A powerful BI tool for creating interactive and shareable dashboards.
Power BI: Microsoft's BI tool for data visualization, reporting, and sharing insights.
2. Spreadsheet Software:
Microsoft Excel: Widely used for data analysis, modeling, and visualization.
Google Sheets: Collaborative spreadsheet software with data analysis capabilities.
3. Database Tools:
SQL (Structured Query Language): Essential for querying and managing relational databases.
MongoDB: A NoSQL database often used for handling unstructured data.
4. Programming Languages:
Python: A versatile language with extensive libraries like NumPy and pandas for data manipulation and
analysis.
R: Specialized for statistical computing and graphics, widely used in academia and research.
5. Statistical Tools:
SPSS (Statistical Package for the Social Sciences): Used for statistical analysis in social science research.
SAS (Statistical Analysis System): A software suite for advanced analytics, business intelligence, and
data management.
Thank You
Introduction to Data Analysis
02-Feb-2024
by: Grace Jidael

Introduction to Data Analysis Course Notes.pdf

  • 1.
    Introduction to Data Analysis CourseNotes 02-Feb-2024 by: Grace Jidael
  • 2.
    Contents What is Dataand Data Analysis Types of Data Types of Data Analysis Life Cycle of Data Analysis Project Tools for Data Analysis 2 3 7 8 10 11
  • 3.
    Data 3 Data: Data is Rawfacts and figures that need to be processed to extract meaningful information. The term big data refers to data sets that are so massive, so quickly built, and so varied that they defy traditional analysis methods such as you might perform with a relational database. Big data is often described in terms of five V's; velocity, volume, variety, veracity, and value. Examples: Numbers, text, images, sound, etc.
  • 4.
    Data Analysis 4 The systematicprocess of inspecting, cleaning, transforming, and modeling data to discover meaningful information, draw conclusions, and support decision-making. is the process and method for extracting knowledge and insights from large volumes of disparate data. It's an interdisciplinary field involving probability, programming, mathematics, statistical analysis, data visualization, and more. It's what makes it possible for us to appropriate information, see patterns, find meaning from large volumes of data and use it to make decisions that drive business.
  • 5.
    Good to Know... 5 Ifyou have data, and you have curiosity, and you're manipulating it, you're exploring it, the very exercise of going through analyzing data, trying to get some answers from it is data analysis. Data science/Analysis is relevant today because we have tons of data available. We used to worry about lack of data. Now we have a data deluge. In the past, we didn't have algorithms, now we have algorithms. In the past, the software was expensive, now it's open source and free.
  • 6.
    In the past,we couldn't store large amounts of data, now for a fraction of the cost, we can have gazillions of datasets for a very low cost. So, the tools to work with data, the very availability of data, and the ability to store and analyze data, it's all cheap, it's all available, it's all ubiquitous, it's here. There's never been a better time to be a data scientist/analyst Good to Know... 6
  • 7.
    If data sethas one variable it is Univariate, and if you have multiple variables it is Multivariate Grace Jidael Types of Data 7 Structured Unstructured Semi Structured Categorical(Nominal or Ordinal) Numeric(Continuous or Interval) Cross Sectional Time-Series By Structure By Type By Variable Type
  • 8.
    Types of Analysis 8 InferentialAnalysis: Inferential analysis are numeric values that enables an analyst/researcher draw conclusions about a population based on a sample of data. It aims to make generalizations or predictions about a larger group from which the data was sampled. It uses Statistical test, either to test for significant relationships amongst variables or to find statistical support to hypotheses. It is based on laws of probability Descriptive Analysis: Summarizes and organizes data to understand the sample’s characteristics. Descriptive Statistics are numeric values obtained from the data that gives meaning to the data collected. They include frequency distribution, measures of central tendency, measures of dispersion/variability, bi-variate descriptive statistics. It gives the current status of data
  • 9.
    Other Types ofAnalysis 9 Predictive Analysis(Forcasting): Uses statistical algorithms and machine learning to make predictions about future outcomes. What if these trends continue? What will happen next? Exploratory Data Analysis: Analyzes data sets to uncover patterns, relationships, or trends. Diagnostic Analysis: Focuses on identifying the cause of a particular problem or issue. What happened? Why is it happening? Prescriptive Analysis: Recommends actions to optimize or take advantage of predicted future scenarios. How do we solve it?
  • 10.
    10 Life cycle ofdata science project
  • 11.
    11 Tools for DataAnalysis 1. Business Intelligence (BI) Tools: Tableau: A powerful BI tool for creating interactive and shareable dashboards. Power BI: Microsoft's BI tool for data visualization, reporting, and sharing insights. 2. Spreadsheet Software: Microsoft Excel: Widely used for data analysis, modeling, and visualization. Google Sheets: Collaborative spreadsheet software with data analysis capabilities. 3. Database Tools: SQL (Structured Query Language): Essential for querying and managing relational databases. MongoDB: A NoSQL database often used for handling unstructured data. 4. Programming Languages: Python: A versatile language with extensive libraries like NumPy and pandas for data manipulation and analysis. R: Specialized for statistical computing and graphics, widely used in academia and research. 5. Statistical Tools: SPSS (Statistical Package for the Social Sciences): Used for statistical analysis in social science research. SAS (Statistical Analysis System): A software suite for advanced analytics, business intelligence, and data management.
  • 12.
    Thank You Introduction toData Analysis 02-Feb-2024 by: Grace Jidael